


Introduction
Low back pain (LBP) is a commonly observed condition and one of the most serious physiological issues worldwide [1]. It can be caused by a variety of problems in any part of the complex, such as the interconnected network of the spinal muscles, bones, discs, nerves, or tendons in the lumbar spine. Intervertebral disc degeneration (IVDD) is considered to be the main cause of LBP [2]. Many studies have reported the pathology, diagnosis, and treatment of discogenic LBP; however, the underlying mechanism and treatment remain unclear.
Schmorl’s node (SN) is an intraspongious disc herniation formed within the vertebral body through a cartilaginous endplate [3]. Although SNs are common in the spine [4], they are seldom symptomatic, and their clinical significance as an origin of LBP has not been determined. Nonetheless, a previous report has shown that SN might be an active symptomatic process and cause LBP in patients with evidence of inflammation and/or edema in the vertebral bone marrow [5]. The pathophysiology of the symptomatic cases and the radiological differences between the asymptomatic and symptomatic individuals are also controversial. Most SNs are reportedly combined with IVDD [6]; however, the relationship between SN and IVDD has not been examined or understood [4,6].
Magnetic resonance imaging (MRI) is an important modality for intervertebral disc (IVD) diagnosis. Signal variation of the discs on T2-weighted images reflects the age and degeneration enabling disc degeneration determination. In particular, because MRI signal strength is related to water and proteoglycan content, changes in the MRI signal strength in the nucleus pulposus (NP) can indicate IVDD [7]. IVDD has been classified with the use of T2-weighted images, as described by Pfirrmann et al. [8]. Nonetheless, this strategy is based on visual evaluation; therefore, the quantification of degeneration is unclear. In recent years, there have been several studies that attempted to quantify lumbar disc degeneration with the use of MRI T2 and MRI T1p mapping [9-13]. MRI T2 mapping utilizes T2 relaxation time for quantification of moisture contents and collagen sequence breakdown. In our previous work, we used MRI T2 mapping to quantify the extent of IVDD and found a correlation with Pfirrmann classification [14]. Furthermore, we quantitatively evaluated IVDD with MRI T2 mapping and found a correlation between posterior annulus fibrosus (AF) degeneration and chronic low back pain (CLBP) [15].
The purpose of this study was to determine the connection among CLBP, SN, and IVDD, quantified with the use of MRI T2 mapping.
Materials and Methods
The institutional review board of the Sapporo Medical University approved this study (IRB approval no., 262-1074). All the subjects were presented with written and verbal explanations of the study, and they provided their consent before participation.
1. Participants
The standard Visual Analog Scale (VAS) scores to diagnose patients with LBP were not clearly defined. Nonetheless, there was a report that included patients with LBP whose VAS scores were more than 30 mm; therefore, in this study, we marked out those whose VAS scores were more than 30 mm. The exclusion criteria included the following: (1) systemic inflammatory disease; (2) neurological disorder; (3) previous spine surgery; (4) neoplasm, infection, or acute trauma; and (5) spondylolisthesis and scoliosis. There were a total of 105 patients (48 men and 57 women; mean age, 63.2±2.7 years; range, 22–84 years). We analyzed the five functional spinal unit levels (L1–L2, L2–L3, L3–L4, L4–L5, and L5–S1), obtaining a total of 725 levels. All the subjects completed the LBP VAS (scores 0–100 mm) and underwent MRI of the lumbar spine. We also calculated the body mass index (BMI) with the use of the self-reported body weight (kg) divided by the height squared (m2).
2. Magnetic resonance imaging protocol
The equipment used consisted of a spine coil with a GE Signa HDx 1.5 T (GE Healthcare, Milwaukee, WI, USA). T2-weighted sagittal images (repetition time [TR], 4,000 ms; echo time [TE], 102 ms; receive band width [RBW], ±31.25 kHz; field of view [FOV], 24 cm; matrix, 384×288; slice thickness/gap, 4 mm/1 mm; number of excitations [NEX], 4; and total scan time, 3 minutes and 4 seconds) were obtained.
3. Assessment of Schmorl’s node
SN was defined as a localized defect at the cranium, caudal endplate, or both endplates, with a well-defined herniation that concaved in the vertebral body, with or without a surrounding sclerotic rim with low signal intensity (SI) on T2-weighted image [16]. We did not consider the erosive defects of the endplate at the degenerate segments as SN. For the intra- and interobserver reliabilities, two investigators (observer 1, I.O. and observer 2, H.T.) scored the magnetic resonance (MR) images in the same manner. The intra- and interobserver variabilities for SN were 0.93 and 0.90, respectively.
4. Magnetic resonance imaging T2 mapping
The sagittal images for T2 mapping were acquired, and T2 maps were created on a pixel-by-pixel basis (Fig. 1). We used the T2 values in the midsagittal section, the sagittal sections centered on the lumbar midline region with optimized 8 echo multispin echo (TR/first echo TE, last echo TE, 1,000/14.8, 118.6; RBW, ±15.63 kHz; FOV, 22 cm; matrix, 320×256; slice thickness/gap, 4 mm/4 mm; 5 slices; NEX, 2; total scan time, 8 minutes and 34 seconds) obtained with an Advantage Workstation (ver. 4.4, Functool; GE Healthcare, Milwaukee, WA, USA). Nevertheless, the first echo from the multispin system was excluded to minimize the effect of the stimulated echo. T2 map was calculated in each pixel from the SI in the respective TE with the following formula: SI (TE)=e−TE/T2.
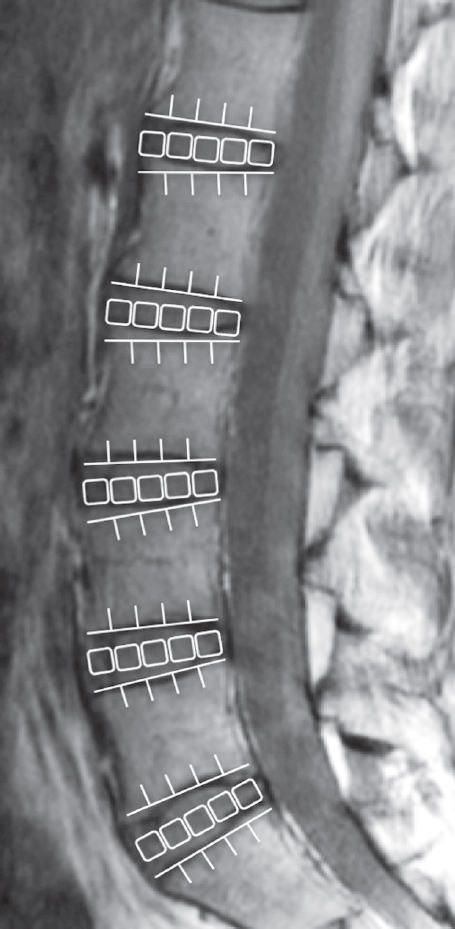
To measure the disc, it was divided into five equal areas that designate the front fifth of the anterior AF, the middle fifth of the NP, and the last fifth of the posterior AF [14,15], at five functional spinal unit levels (L1–L2, L2–L3, L3–L4, L4–L5, and L5–S1) (Fig. 2). In the same region, we measured the mean values obtaining a total of 725 levels. The T2 values were measured by an individual with PhD degree (H.T. who has 12-year experience in spine MR image analysis) with the use of MedCalc (ver. 10.2.0.0; MedCalc Software, Mariakerke, Belgium).
5. Statistical analyses
The subjects were divided into the following five groups based on their age: 20s, 30s, 40s, 50s, 60s, 70s, and 80s (more than 10 subjects in each age decade). The SN prevalence in each decade and gender was analyzed with the use of the chi-square test, and the SN distribution level was examined. We compared the LBP VAS scores and the T2 values with or without SN with the use of the Mann-Whitney U-test. A probability value of <0.05 indicated statistical significance. All the numerical data are expressed as the means±standard error of the mean values.
Results
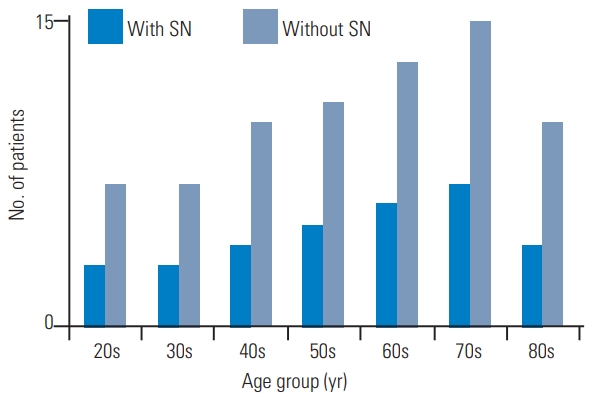
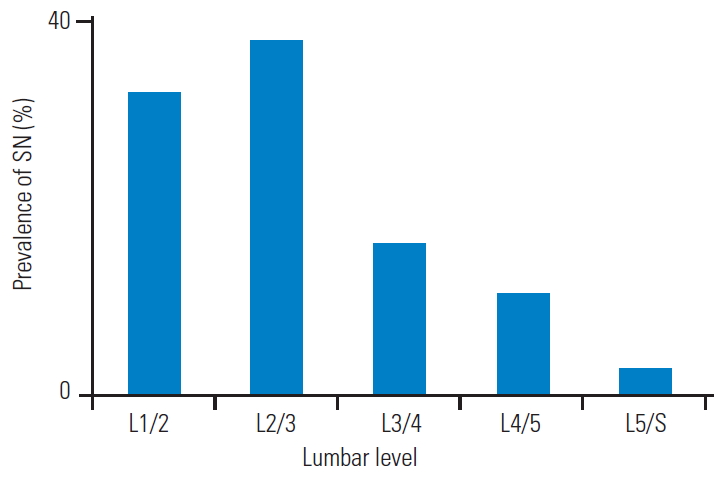
The patients were categorized into two groups, with SN (n=32) and without SN (n=73) (Table 1). The study population composed of 30.5% with those with SN (n=32), of which 13 were men (40.6%) and 19 were women (59.4%), and 69.5% with those without SN (n=73), of which 35 were men (47.9%) and 38 were women (52.1%). Nevertheless, there were no statistically significant gender differences (p=0.49). The mean age of the subjects with SN and without SN was 63.9±2.8 years and 63.1±2.2 years, respectively, but this difference was not statistically significant (p=0.72). The mean BMI of the subjects with SN and without SN was 23.4±0.5 kg/m2 and 23.9±0.6 kg/m2, respectively, but this difference was also not statistically significant (p=0.79). Furthermore, the LBP VAS scores in those with and without SN were 64.7±2.1 mm and 61.9±2.8 mm, respectively, with no significant differences between the groups (p=0.62). The number of patients with SN per the age decade was as follows: three out of 10 for the 20s, three out of 10 for the 30s, four out of 14 for the 40s, 5 out of 16 for the 50s, six out of 19 for the 60s, seven out of 22 for the 70s, four out of 14 for the 80s, and 32 out of 105 for the total study population (Fig. 3). There were no remarkable differences in the SN prevalence rate regarding the age decade. In those with SN, 87.5% (n=28) had single, 9.4% (n=3) double, and 3.1% (n=3) triple lumbar-level involvement. The SN distribution was 32.4% (12 out of 37) for the L1–2 level, 37.9% (14 out of 37) for L2–3, 16.2% (six out of 37) for L3–4 level, 10.8% (four out of 37) for L4–5 level, and 2.7% (one out of 37) for L5–S (Fig. 4). SNs were more prevalent in the upper 2 levels (70.3%), especially in L2/3.
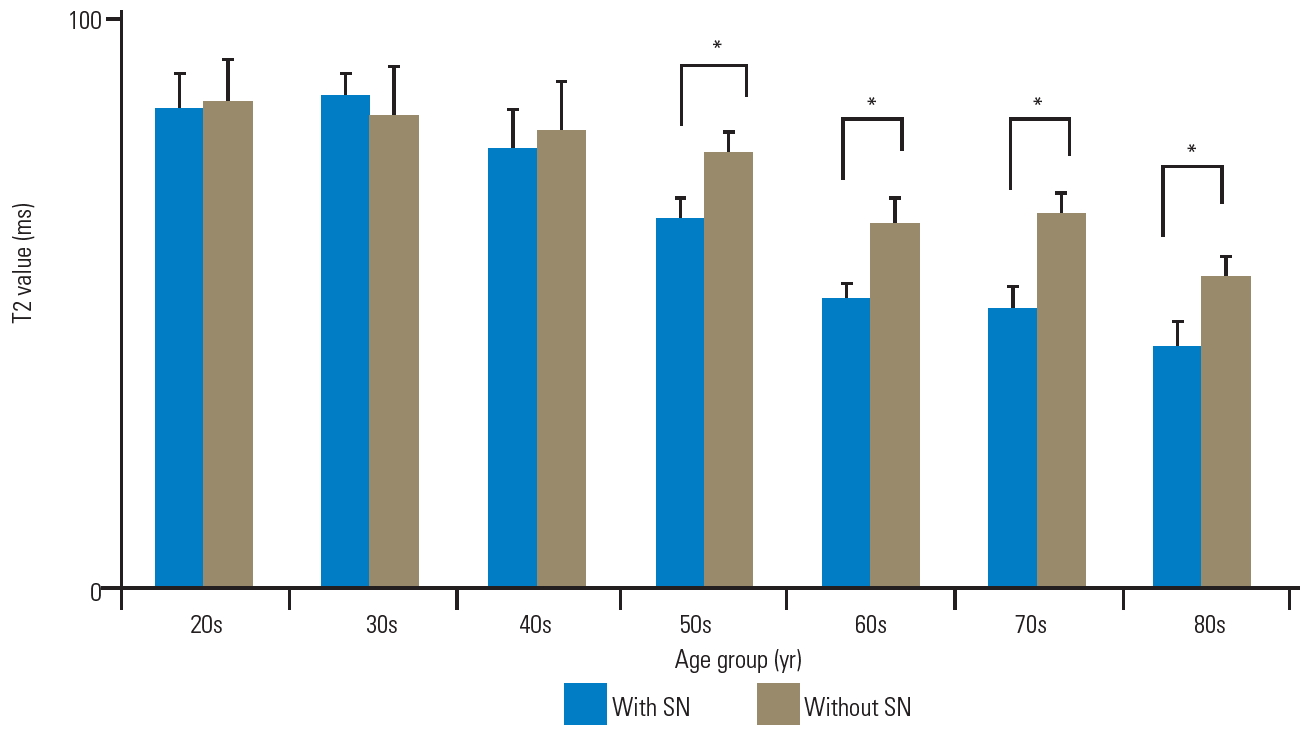
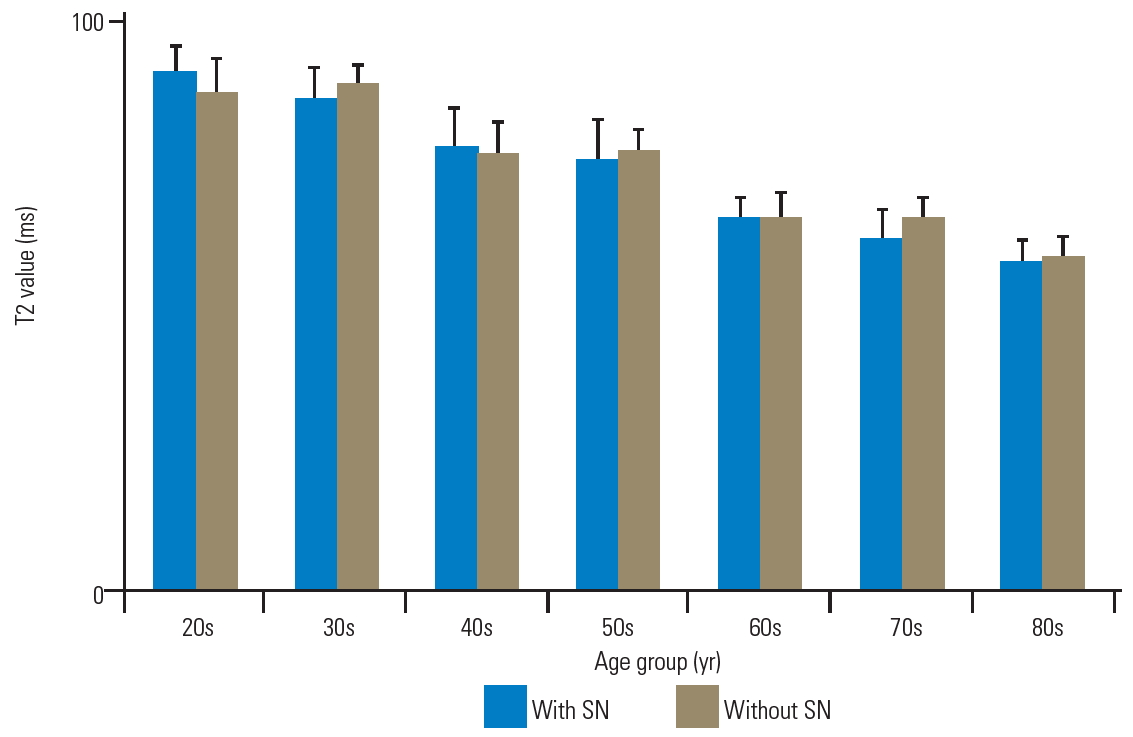
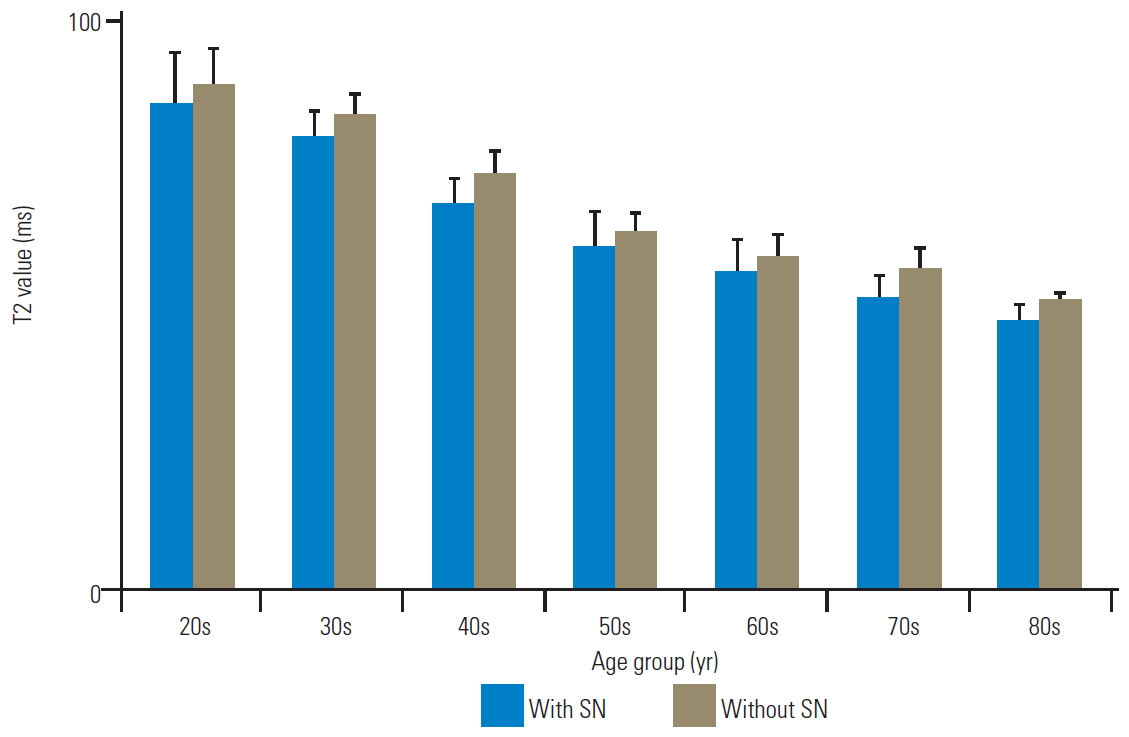
The T2 values of the anterior AF with and without SN were as follows, respectively: 84.5±6.4 ms and 85.6±7.9 ms in the 20s; 86.8±4.3 ms and 83.4±8.4 ms in the 30s; 77.6±6.5 ms and 80.8±8.6 ms in the 40s; 65.2±3.4 ms and 76.4±4.3 ms in the 50s; 50.8±2.6 ms and 64.1±4.7 ms in the 60s; 49.3±3.5 ms and 65.7±4.1 ms in the 70s; and 42.5±4.2 ms and 54.7±3.6 ms in the 80s (Fig. 5). There were no significant differences in the T2 values of anterior AF with and without SN in patients in their 20s, 30s, and 40s (p=0.75, 0.60, and 0.78, respectively). Nonetheless, the T2 values of anterior AF with SN were significantly lower than those without SN in patients in their 50s, 60s, 70s, and 80s (p<0.01). Furthermore, the T2 values of the NP with and without SN were as follows, respectively: 94.7±5.0 ms and 90.8±6.9 ms in the 20s; 90.0±6.3 ms and 92.5±4.1 ms in the 30s; 80.8±7.5 ms and 80.1±5.8 ms in the 40s; 78.5±8.1 ms and 80.3±4.3 ms in the 50s; 67.8±3.8 ms and 68.3±4.5 ms in the 60s; 64.8±5.1 ms and 68.0±3.8 ms in the 70s; and 60.0±4.2 ms and 60.8±3.9 ms in the 80s (Fig. 6). There were no significant differences in the T2 values of NP as per the age decade (p=0.68, 0.65, 0.82, 0.70, 0.81, 0.61, and 0.72, respectively). Moreover, the T2 values of the posterior AF with and without SN were as follows, respectively: 86.1±9.6 ms and 89.7±6.1 ms in the 20s; 80.3±4.6 ms and 84.1±4.1 ms in the 30s, 68.1±5.2 ms and 73.9±3.8 ms in the 40s; 60.9±6.5 ms and 63.2±3.7 ms in the 50s; 56.2±5.9 ms and 59.1±4.0 ms in the 60s; 51.9±4.0 ms and 57.0±3.9 ms in the 70s; and 47.6±3.2 ms and 51.6±1.3 ms in the 80s (Fig. 7). There were no significant differences in the T2 values of posterior AF as per the age decade (p=0.71, 0.61, 0.42, 0.67, 0.74, 0.46, and 0.50, respectively).
Discussion
In this study, a total of 30.5% of the subjects presented with SNs, with prevalence (70.3%) in the upper 2 lumbar levels (L1/2 and L2/3). This finding was consistent with that of the previous reports, which showed that SNs were more commonly located in the thoracolumbar region [6,16,17]. This result could be attributed to the higher mechanical stresses at the transition zone between the thoracic and lumbar spine. It has also been reported that compressive loading on the posterior facet ligamentous complex of the lumbar spine increased with a rise in lordotic posture [18] and that the average loading on the facet joints of the three lowest lumbar segments was higher than that of the two upper segments [19]. Therefore, with the load sharing between the IVD and the paired facets, one would postulate that the relative compressive forces loaded onto the IVD should decrease caudally owing to the increase in lumbar lordosis. This effect, in turn, may account for the lower compressive forces loaded onto the endplate, which results in less SN presence on the lower lumbar segments. Moreover, a recent skeletal study, which examined endplate strength with the indentation loading test, found that there were remarkable differences between the lumbar segments in both the superior and inferior endplates and that the mechanical strength tended to increase caudally. This suggested that the endplates of the upper lumbar segments were weaker than those of the lower lumbar segments [20]. In addition, these findings indicate the importance of endplate strength in SN etiology. Furthermore, SN occurrence was reported because of such factor as traumatic history during childhood, genetic involvement [18,21], and so on. The effect of cumulative minor injuries, such as compressive axial loading, might be an underlying mechanism that could result in endplate damage and eventually SN development. Moreover, it was noted that SNs were strongly determined genetically with heritability as high as 72% and 80% over the thoracic and lumbar spine, respectively, in a study with twin subjects [18]. Therefore, we considered that the percent prevalence of SN did not increase with older age.
We also elucidated the association between IVDD and SN in CLBP with quantitative MRI and found that the T2 values of the lumbar discs nearly decreased with age and T2 values of anterior AF in subjects with SN ≥50 years were remarkably lower than those without SN. Several studies have revealed an association between SN and IVDD [6,16,18,22,23]. A cadaveric study reported that the pressure in the IVD could be reduced by 25%±27% with minor endplate damage [24]. Similarly, endplate fracture produced an immediate effect by remarkable reduction of the IVD pressure to 37% in cadaveric human lumbar discs [25]. We considered that SN converted stresses and loads against IVD and shared a common pathway with anterior AF degeneration. Moreover, this study found that the presence of SN is not a risk factor for CLBP itself; however, it is an indicator of IVDD of anterior AF. There were agreements on the lack of association between SN and CLBP, including the relation between SN and IVDD in past reports [16,18,26]. An interesting finding of this study was the identification of the part of IVDD, that is, anterior AF, quantitatively relative to SN.
Previously, we evaluated the extent of IVDD and compared this with the T2 values in groups with degenerative spondylolisthesis (DS) and no spondylolisthesis. We found that the T2 values decreased in the anterior AF of IVD in the DS group [27]. In this regard, characterization of the relationship between degeneration in the anterior AF and SN may result in an accurate noninvasive evaluation and subsequent treatment and surgical planning, which would be especially useful when fusion surgery is needed. Our study also suggested the possibility of early diagnosis of SN degeneration and expected prediction of adjacent segmental disease after posterior spinal fusion [28,29].
This study has certain limitations. First, the cross-sectional study design limited the results regarding time-course of the association between SN and IVDD. Longitudinal studies would be necessary for detailed analysis. Second, we did not evaluate the SN characteristics, such as location, diameter, and volume. Third, the number of subjects with SN was too small to confirm or refute an association, and there were no control cases. We should analyze the cases without LBP and with SN and investigate on their treatment in the future.
In summary, there were no remarkable age decade- or gender-based differences in the prevalence rate of SNs. Furthermore, SNs were prevalent in the upper 2 lumbar levels (L1/2 and L2/3). The presence of SNs is not itself a risk factor for CLBP; however, it indicates IVDD of the anterior AF in subjects with SN who are ≥50 years old.