


Introduction
Determining the average spinopelvic sagittal alignment value according to age is important in judging abnormalities of the spinal sagittal curvature. Many studies have reported the importance of spinopelvic sagittal alignment [1]. Banno et al. [2] have reported that knowledge of age-related normal spinal parameters is essential for understanding adult spinal deformities. Moreover, Gutman et al. [3] have reported that the global spinal value plays an important role in surgical planning and in attempting to minimize the incidence of complications, such as adjacent segment disease, sagittal imbalance, and implant failure. Shimokawa et al. [4] have also reported on the relationship between sagittal parament and quality of life.
So far, spinopelvic sagittal alignment has been evaluated using standing lateral radiography, which is a simple, inexpensive, and easy method. However, each image must be taken separately to measure the spinopelvic alignment and combined with other images. This process can cause distortion of the radiography images, which increases the risk of size measurement error of structures [5].
According to a study, the average radiation dose was 0.68 mrad for EOS-Fast, 0.73 mrad for computed tomography (CT) scanogram, and 29.01 mrad for conventional radiography [6]. Moreover, the EOS test had a lower radiation dose than CT or conventional radiography. In another study, EOS photography had the advantage of having a lower irradiation volume by at least 3–9 times for each body part than conventional radiography [7]. Many studies on the measurement of spinopelvic sagittal alignment using whole-spine standing lateral radiography have been conducted [8–10]. However, we found only few studies that measured spinopelvic sagittal alignment using the EOS imaging system. Thus, we examined spinopelvic sagittal alignment in asymptomatic young adults using the EOS imaging system and determined the differences in the measurement values among the imaging modalities.
Materials and Methods
This prospective study was approved by the Institutional Review Board of Konyang University Hospital (IRB no., 2017-02-007-009).
1. Subjects
We visited each department in Konyang University in November 2016. We explained the research topic and EOS imaging system to the students and persuaded them to participate in the study. All students provided their consent and voluntarily participated in this study. The conditions applied were as follows.
The inclusion criteria were as follows [1]: absence of spinal disease or deformity [2]; no history of hip, pelvic, or lower limb disorders [3]; and no history of spinal, pelvic, or lower limb surgeries. Students with a history of low back pain for a minimum of 3 consecutive months were excluded from the study. Moreover, we obtained information regarding age, sex, height, and weight.
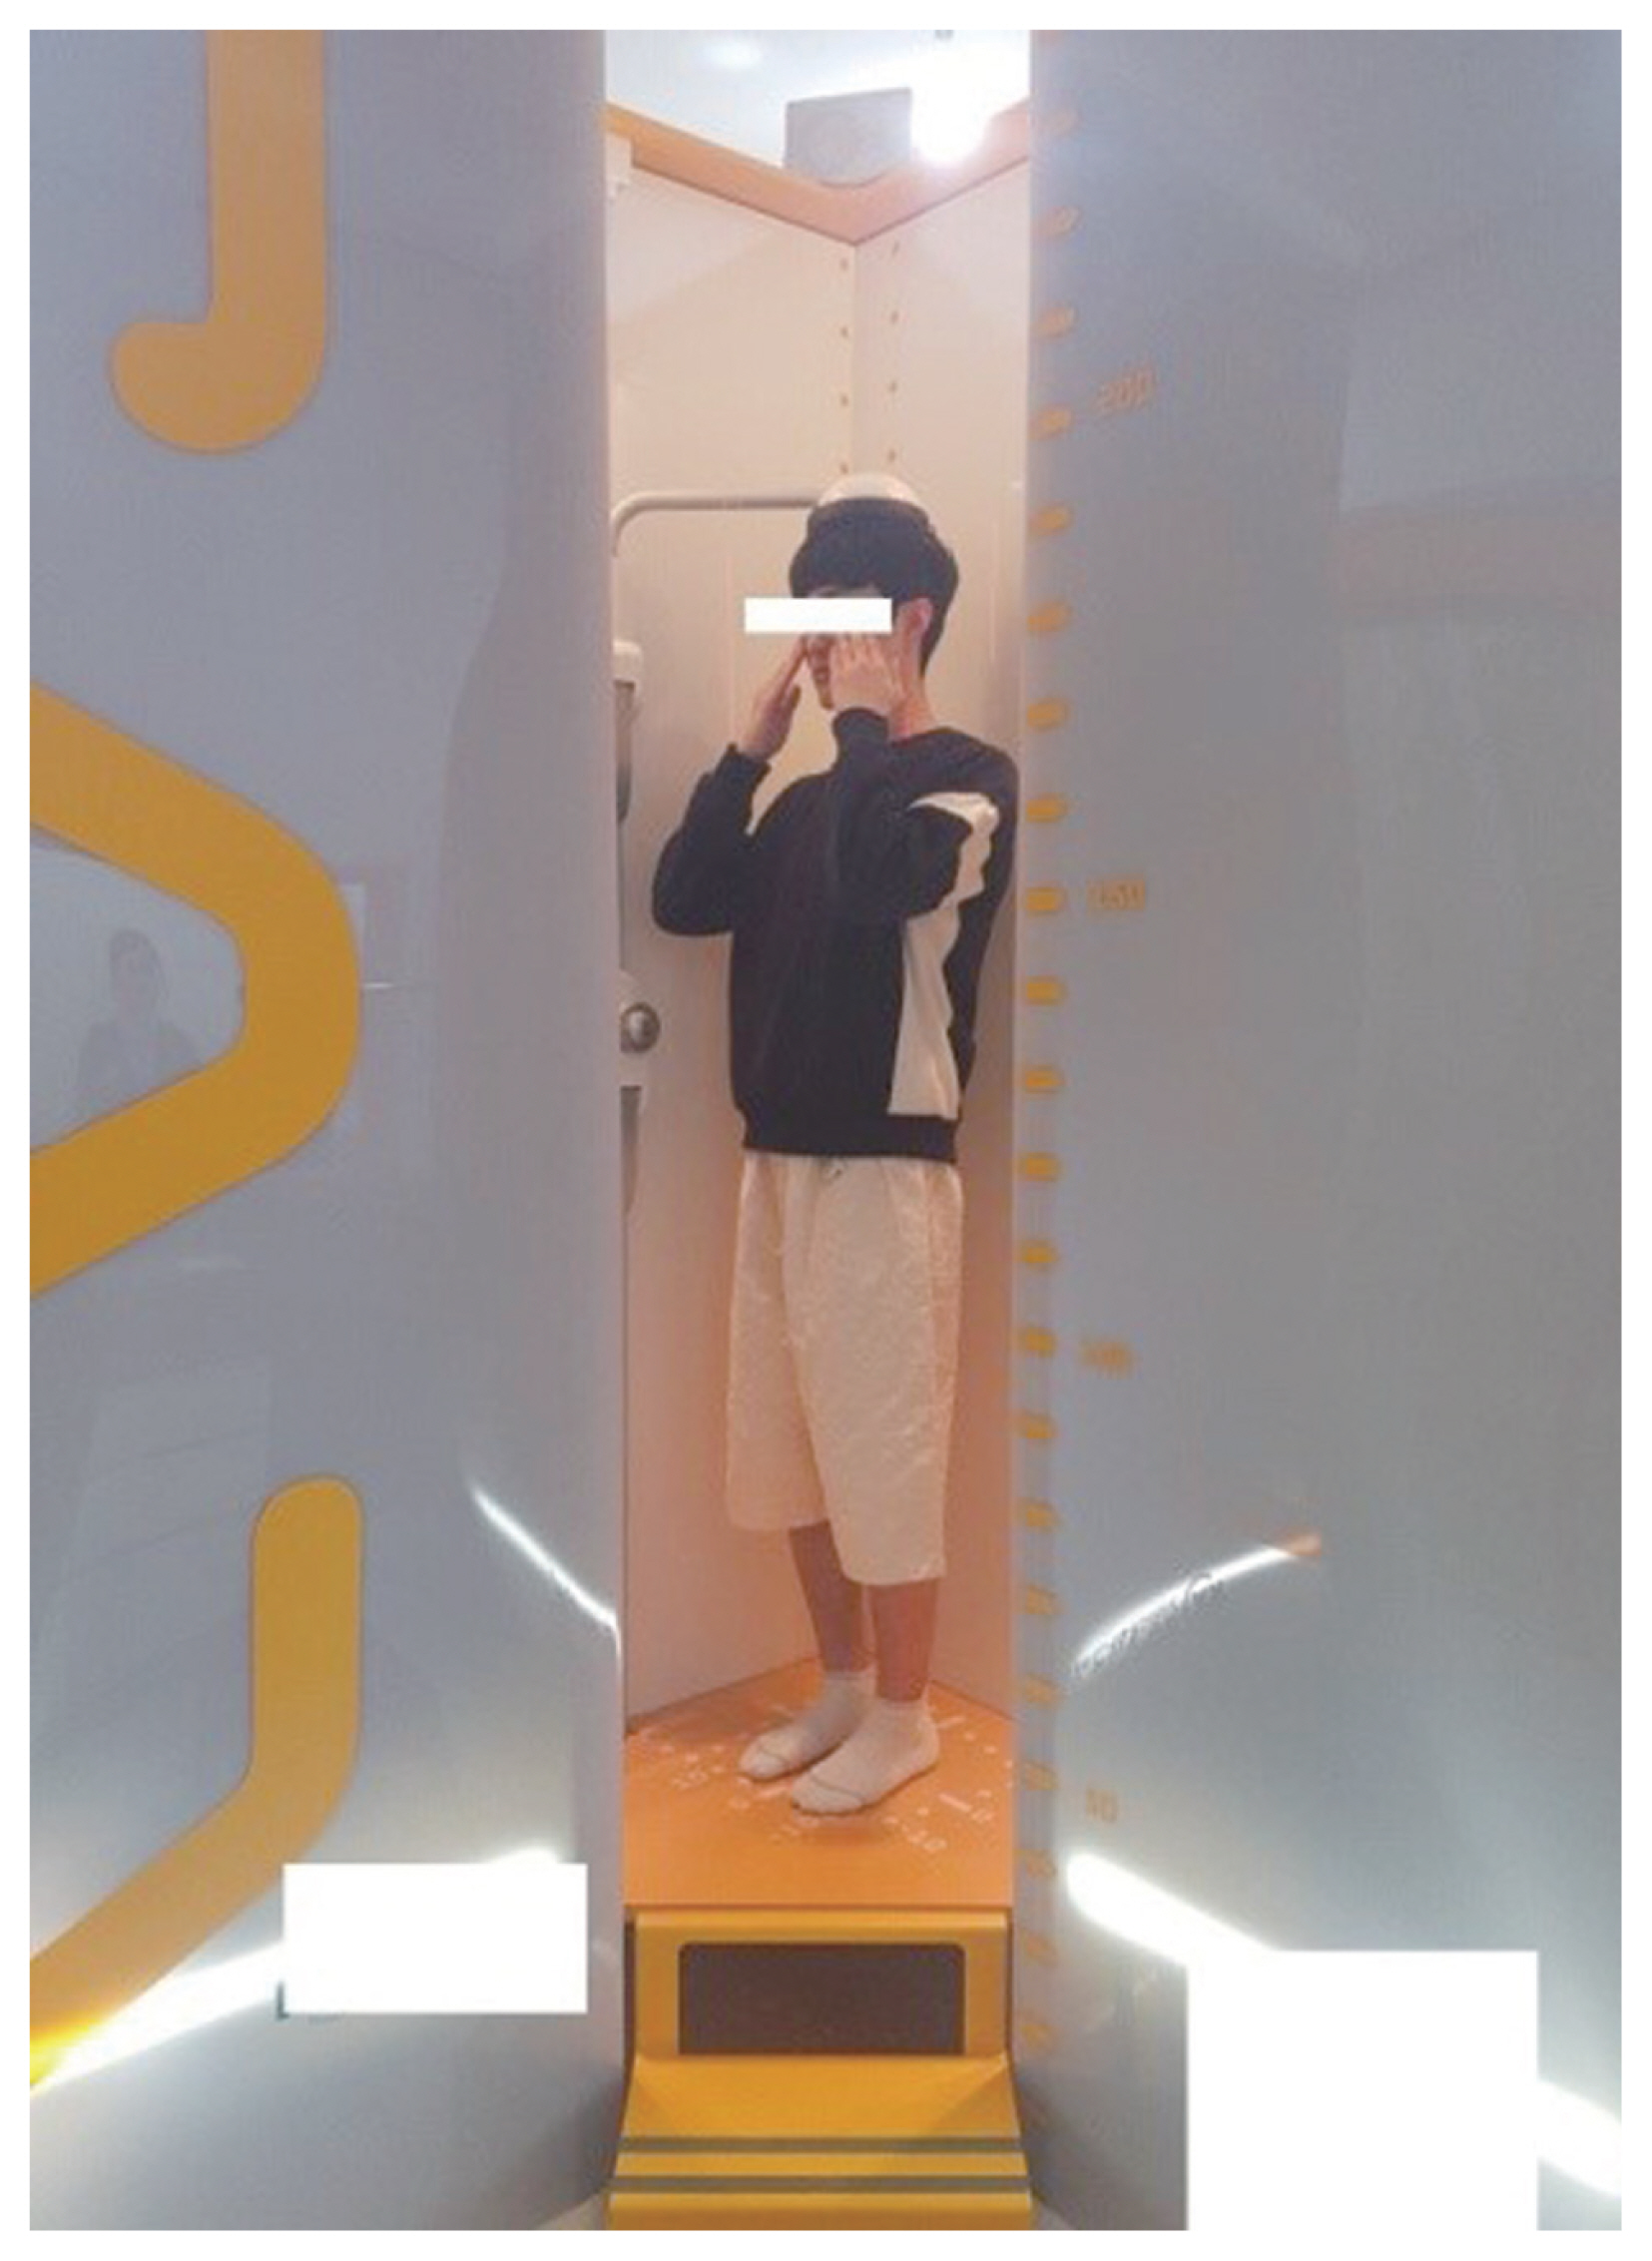
The subjects were instructed to stand comfortably on both feet, with the knees extended and fingertips covering both eyes during the examination using the EOS imaging system (Fig. 1). While filming EOS, we decided on the posture as above, considering the posture in which the subjects could be comfortable while the vertebral body is not obscured [11,12].
2. EOS system
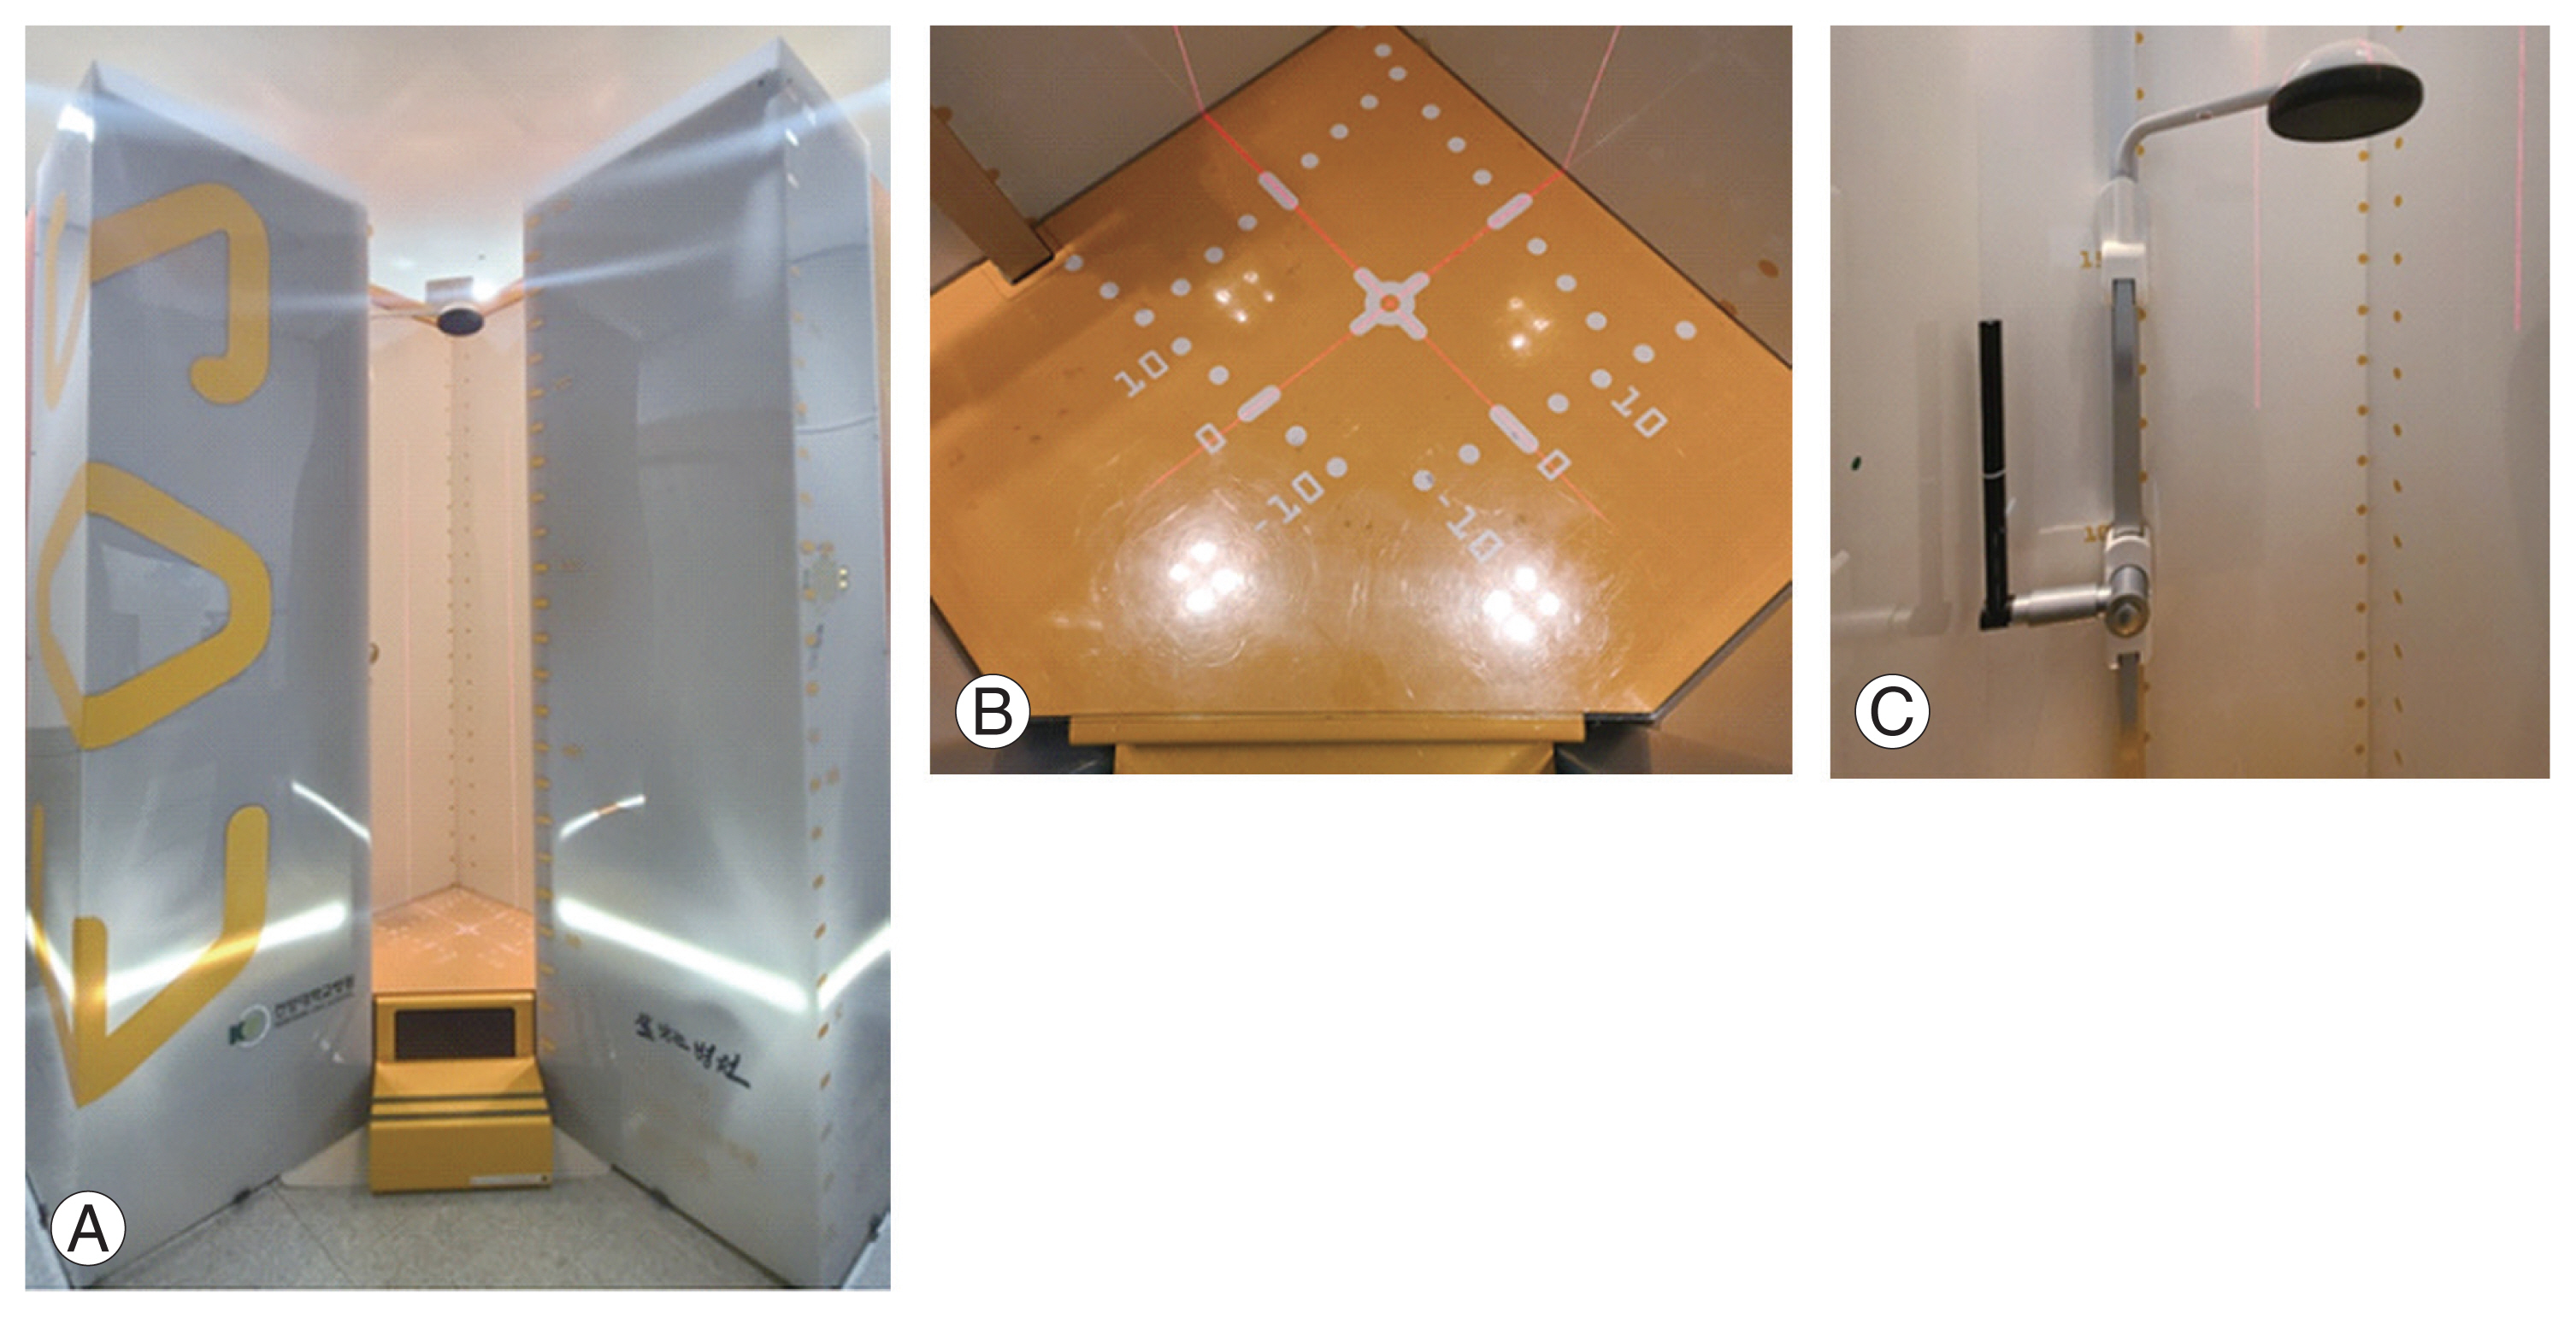
The EOS system shown in Fig. 2 is a new slot-scanning radiological device that allows the acquisition of two radiographic images simultaneously. It is composed of two X-ray resources, shaped as fan beams through collimation slits. The sources are coupled with linear detectors built using the micromesh gaseous structure technology [13].
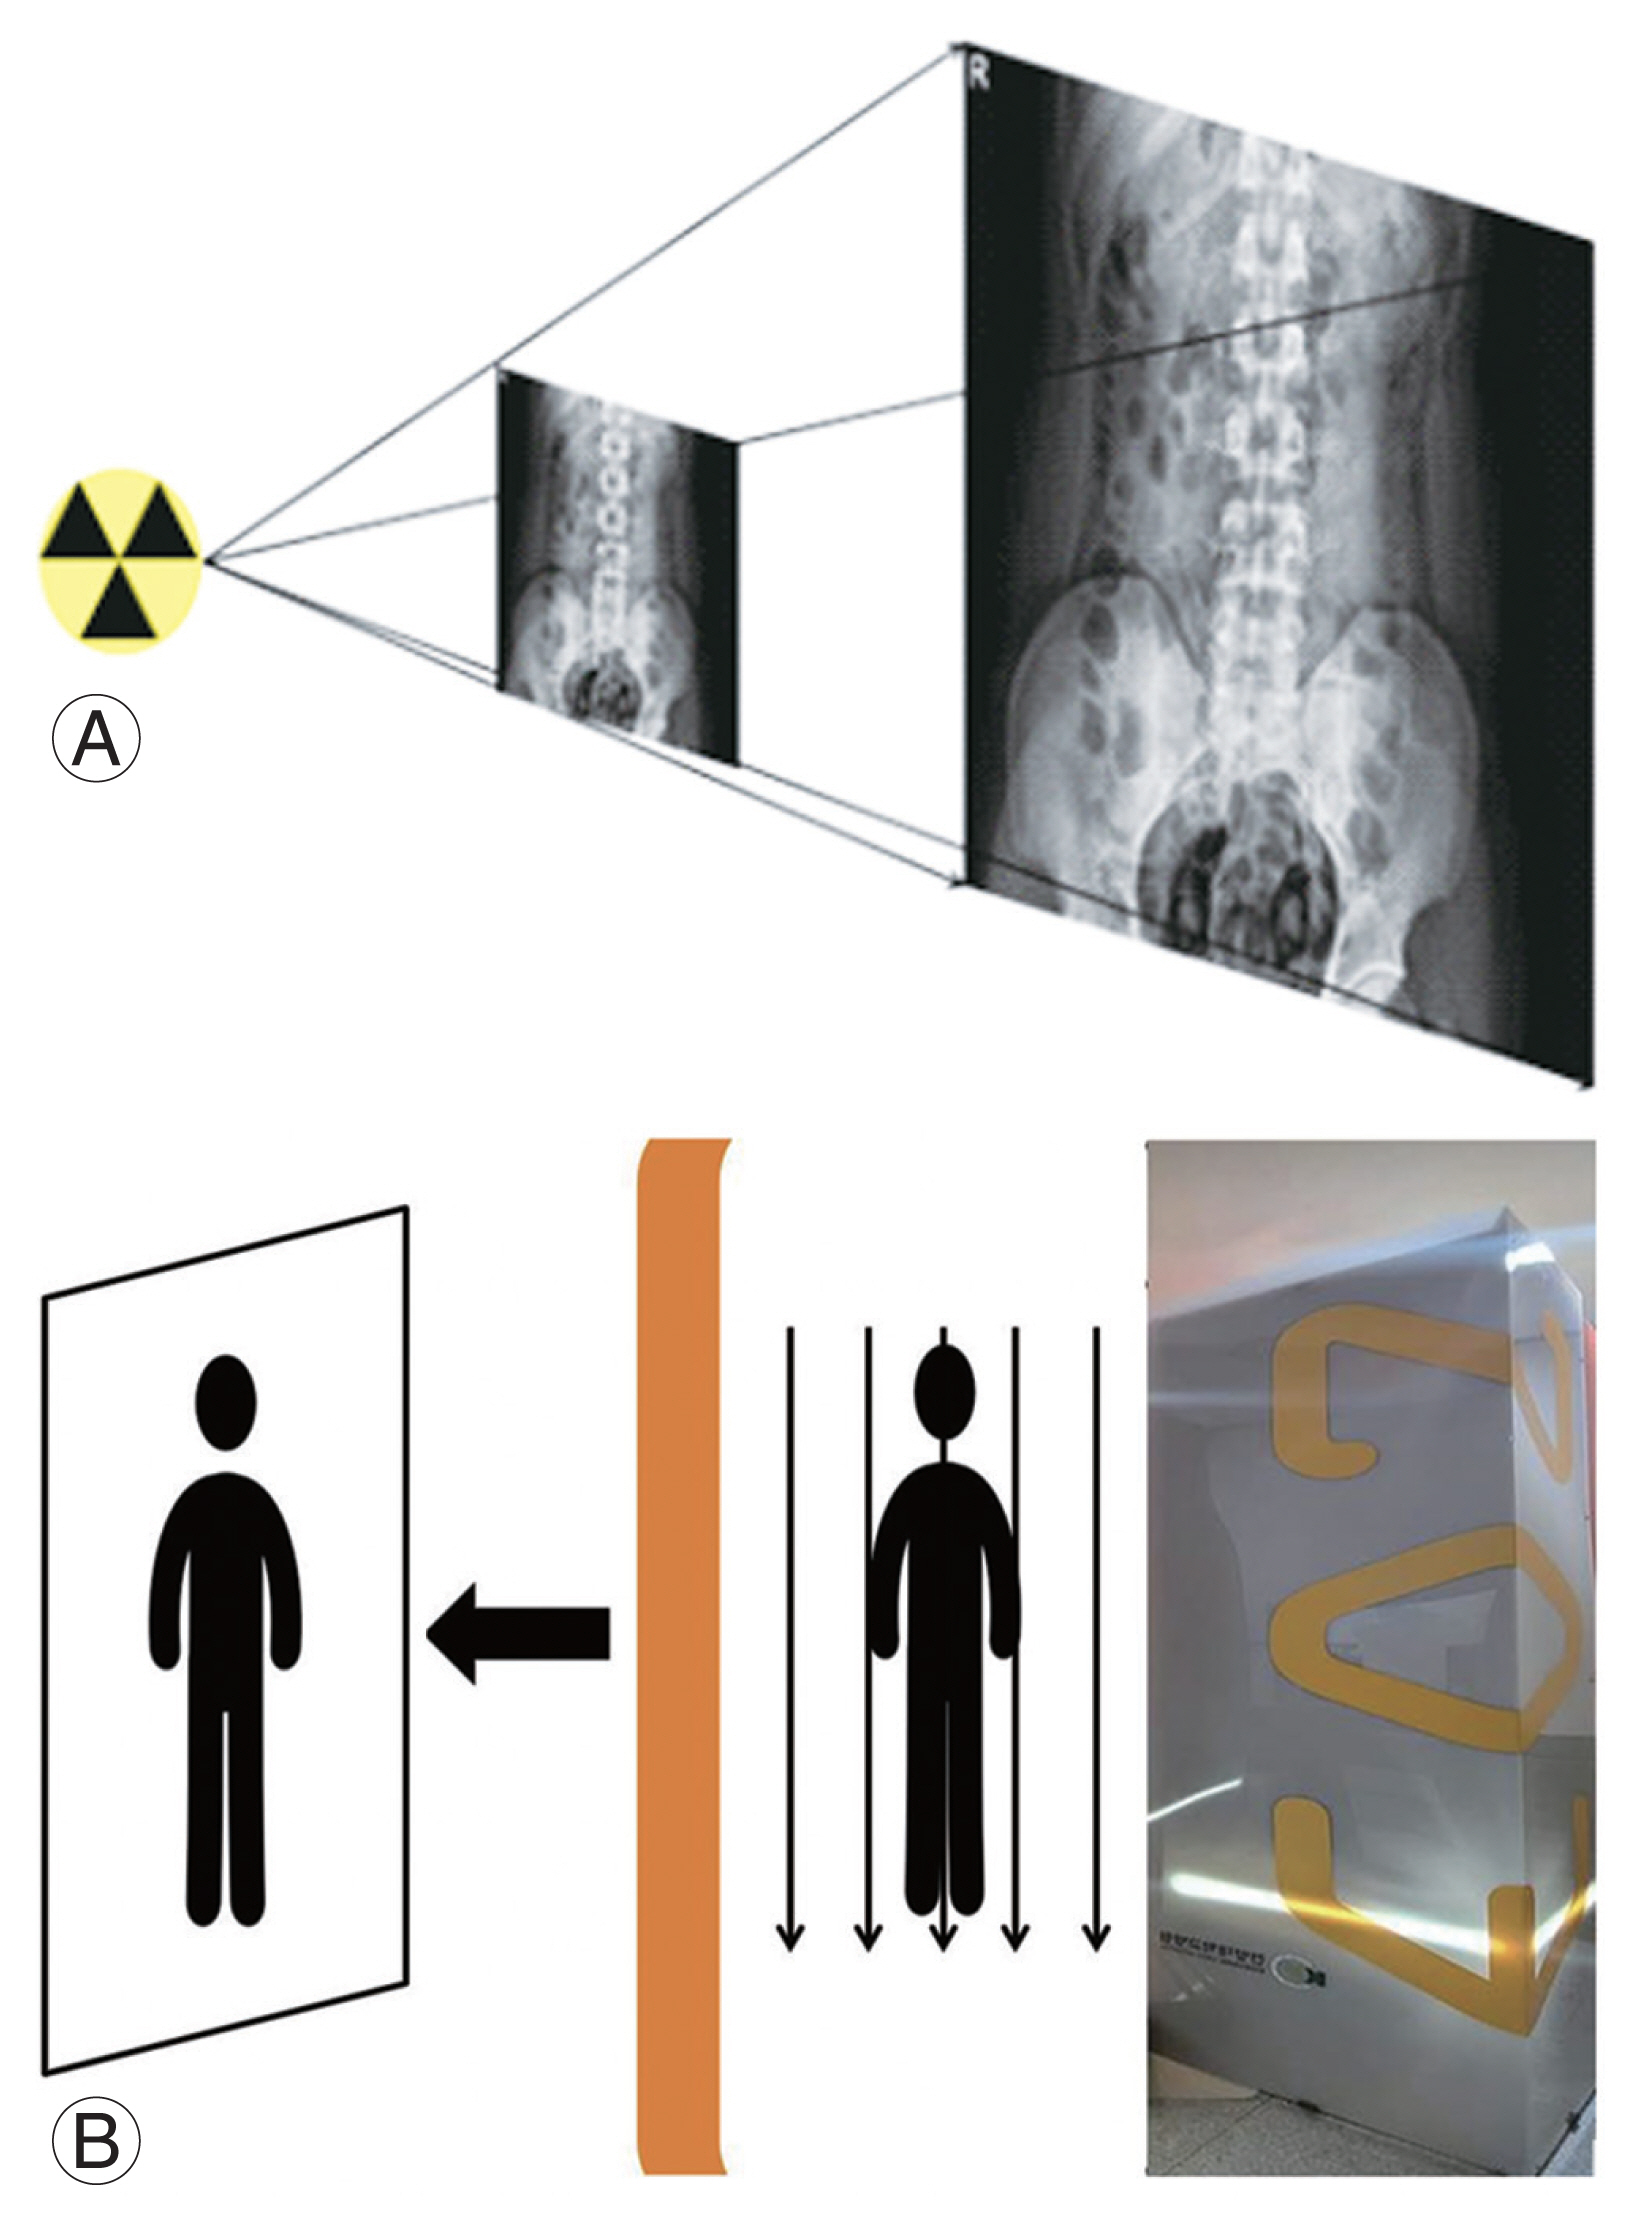
The distance between the sources and detectors is 1.3 m, with the patient standing at approximately 1 m of both sources. The two source-detector pairs are positioned orthogonally, so the patient’s face and profile images are generated line-by-line while the entire system is vertically translated. Moreover, the system could activate only one source for single-view image acquisition. The user determines the starting and final heights of the vertical scan. This way, irradiation to body parts outside the region of interest is minimized. For spinal examination, the scan time lasts approximately 8–15 seconds, depending on the patient’s height. Patients are instructed to hold their breath while touching both fingers on the cheek during the scan. As images are taken simultaneously, no patient movement is recorded between each radiograph. This characteristic benefits techniques, such as the three-dimensional reconstruction of bony structures from two radiographic views, because their accuracy depends strongly on the spatial correspondence of the structures from one view to the other (Fig. 3) [14,15].
3. Measurement parameters
We took standing anteroposterior (AP) and lateral (LAT) images, including the cervical, thoracic, lumbar, and hip joints, and created images using the EOS imaging system (EOS imaging, Paris, France). Digital images were stored in the institutional Picture Archiving and Communication System (PACS) network (Marosis v5.4.10.68; INFINITT Healthcare Co. Ltd., Seoul, Korea). Conventional curve measurements were manually performed on digital anteroposterior and lateral EOS two-dimensional images, using standard PACS workstation software tools (sterEOS; Biospace Med, Paris, France).
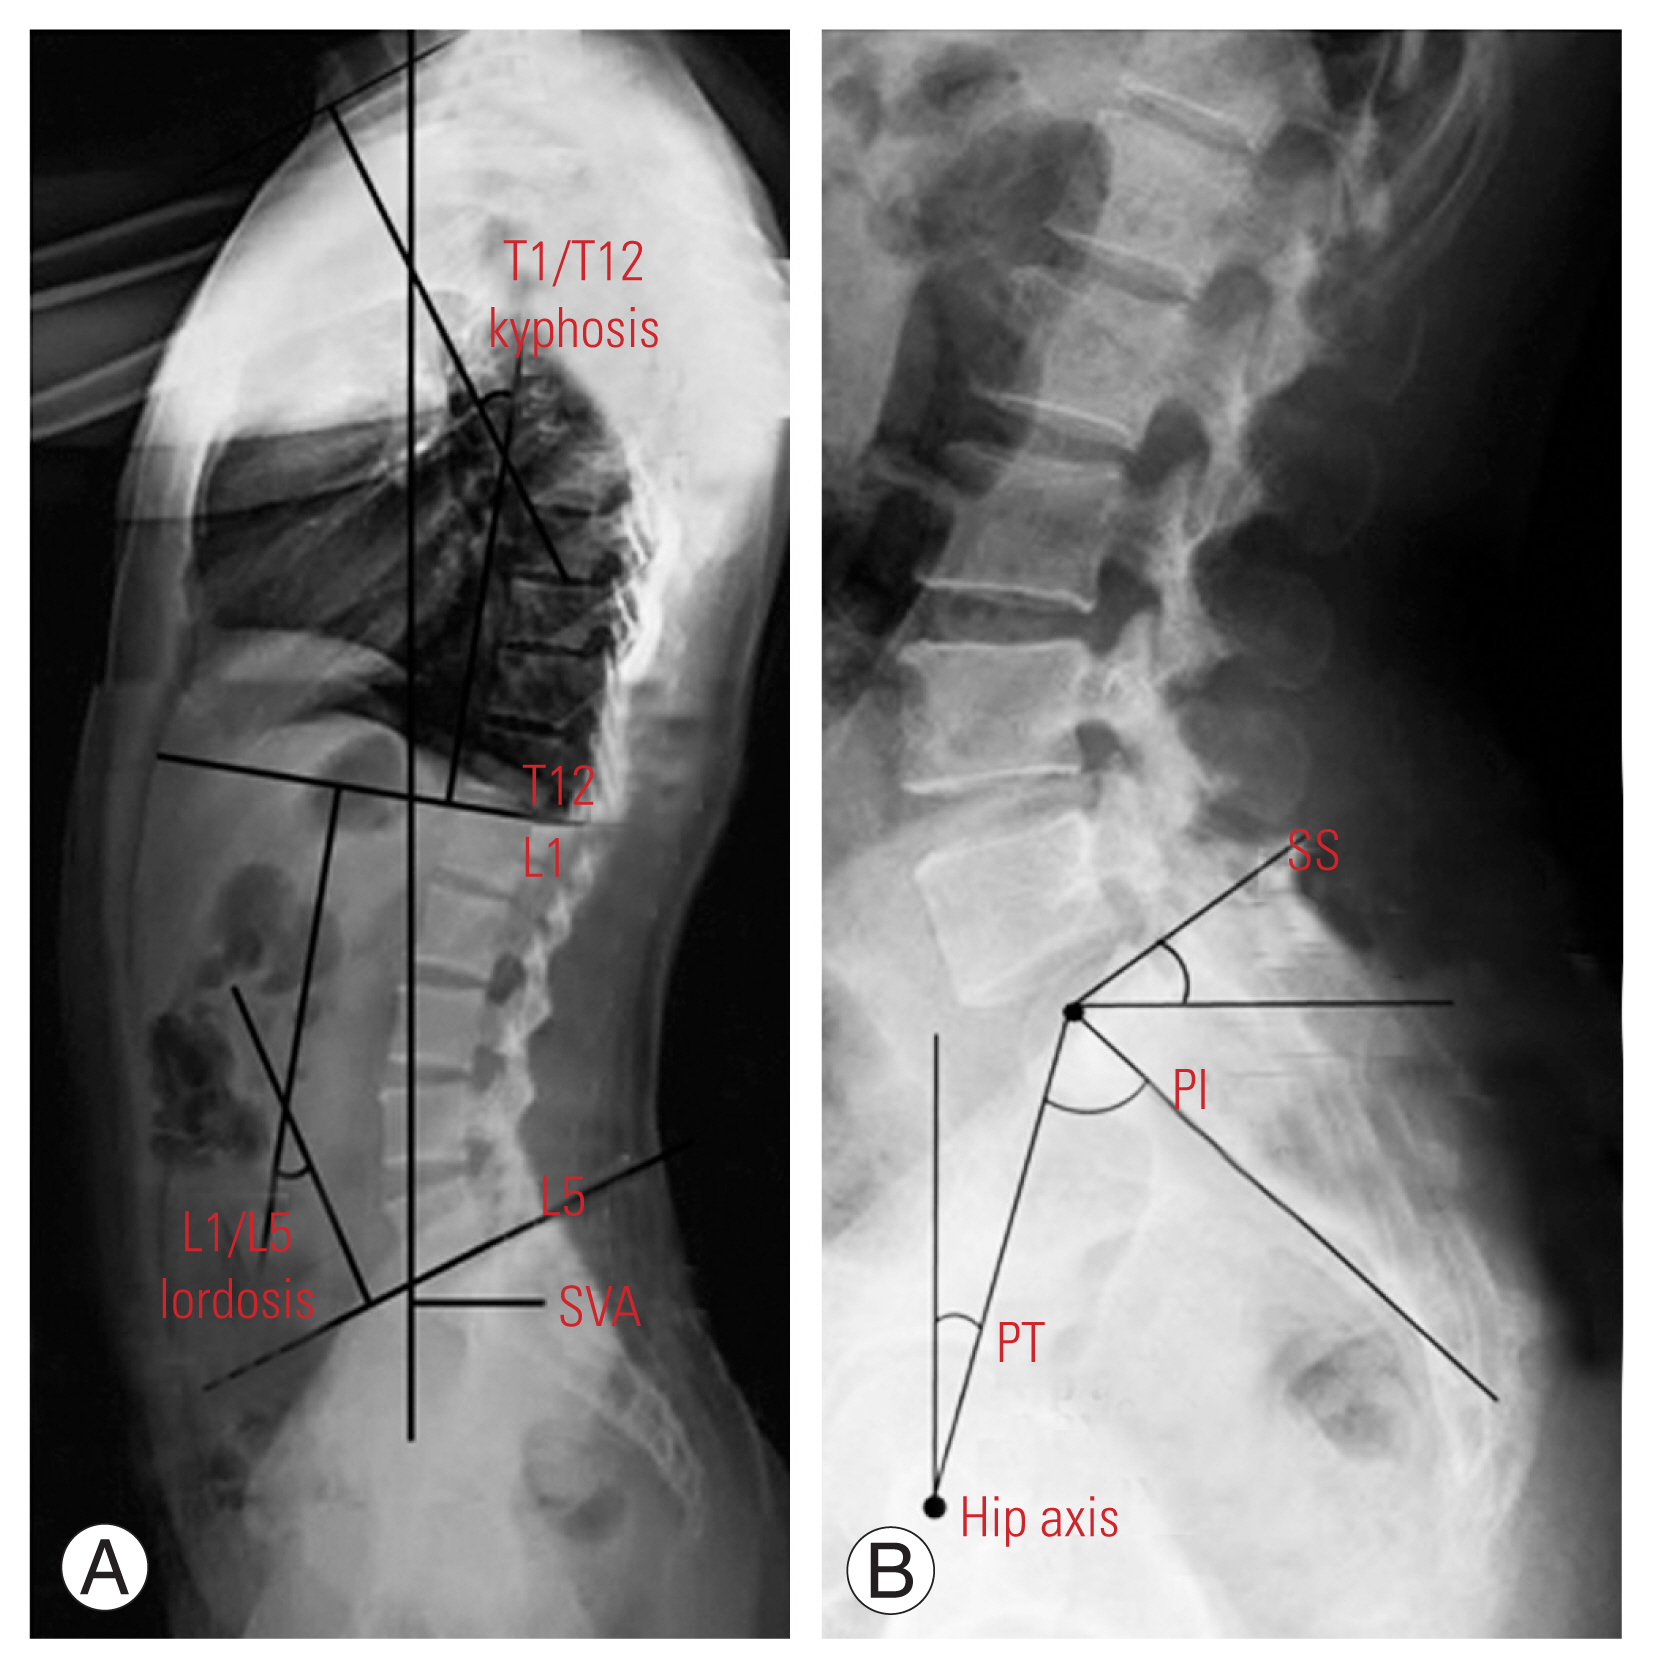
Pelvic parameters were measured using the pelvic incidence (PI), sacral slope (SS), and pelvic tilt (PT). Sagittal balance was measured using the sagittal vertical axis (SVA), T1/T12 kyphosis, and L1/L5 lordosis. PI was defined as the angle between a line drawn from the center of the hip axis to the center of the superior endplate of S1 and perpendicular to the endplate [16]. SS was defined as the angle formed between the superior endplate of S1 and horizontal plane from the ground. PT was defined as the angle between the vertical plane from the ground and a straight line connecting the center of the superior endplate of S1 to the centers of the femoral heads.
SVA was defined as the distance between the vertical axis passing through the center of C7 vertebral body and posterior edge of the sacral plate. SVA is positive when the vertical axis passing through C7 is anterior to the posterior edge of the sacral plate. T1/T12 kyphosis and L1/L5 lordosis were defined as the angles between the superior endplate of the upper vertebral body and the lower endplate of the lower vertebral body (Fig. 4).
4. Statistical analysis
We analyzed the mean value and standard deviation of the parameters of males and females separately using Student t-test (i.e., PI, SS, PT, SVA, T1/T12 kyphosis, and L1/L5 lordosis). Moreover, we analyzed the correlations of the radiological parameters, sex, and body mass index (BMI) using Pearson’s correlation coefficient as follows: 0.00–0.20, poor; 0.21–0.40, fair; 0.41–0.60, moderate; 0.61–0.80, good; and 0.81–1.00, excellent. All p-values of less than 0.05 were used to denote statistical significance. All statistical analyses were performed using IBM SPSS ver. 20.0 (IBM Corp., Armonk, NY, USA).
Results
Ninety-two participants were enrolled in this study, including 65 women and 27 men, all of whom were Korean. The mean age of the subjects was 21.5 years. The mean BMI was 21.5±2.83 kg/m2 (range, 16–32 kg/m2). The mean spinopelvic parameter values of the cohort were 47.18°±9.15° for PI, 11.17°±6.22° for PT, 36.03°±6.91° for SS, −10.15±20.98 mm for SVA, 46.64°±10.52° for L1/S1 lordosis, and 37.37°±8.54° for T1/T12 kyphosis (Table 1).
The mean spinopelvic parameter values in males were 48.22°±9.20° for PI, 8.74°±5.50° for PT, 39.44°±8.13° for SS, −5.59±20.32 mm for SVA, 49.63°±9.43° for L1/S1 lordosis, and 36.11°±6.69° for T1/T12 kyphosis. Meanwhile, those in females were 46.75°±9.17° for PI, 12.18°±6.27° for PT, and 34.62°±5.84° for SS, −12.05±21.11 mm for SVA, 45.40°±10.76° for L1/S1 lordosis, and 37.89°±9.20° for T1/T12 kyphosis (Table 2).
All parameters measured were enough to attain a normal distribution. The parameters in males showed a normal distribution in the Kolmogorov-Smirnov test (p>0.05). In Student t-test, SS (R=0.002, p<0.05), SPT (R=0.015, p<0.05), and BMI (R=0.047, p<0.05) were significantly different between the sexes.
Pearson’s correlation coefficients between L1/S1 lordosis and SS (R=0.616, p<0.001), PI and SS (R=0.737, p<0.001), and PI and SPT (R=0.659, p<0.001) were all significant (Table 3). Sex had no significant correlation with other variables (Table 4). The correlation between BMI and SVA (R=0.214, R=0.04; p<0.05) was significant in the Pearson correlation analysis (Tables 5, 6).
Discussion
Many researchers have evaluated spinopelvic sagittal alignment owing to its importance in treating spinal diseases and the overall spinal health. Zhu et al. [17] have examined sagittal alignment in Chinese populations, and Sangondimath et al. [18] have examined spinal and sagittal alignment of the pelvis in asymptomatic Indian individuals. The normal values of the sagittal parameters in Chinese populations could be significantly influenced by age, weight, and sex. Chinese populations showed significantly smaller PI and SS than Caucasian populations. Lee et al. [1] have evaluated sagittal alignment in a Korean young adult population. The patterns of sagittal alignment showed individual differences and can be classified into three types with significantly different sagittal parameters. Le Huec and Hasegawa [19] have concluded that spinopelvic parameters were comparable between Japanese and Caucasian subjects. The differences in some parameters (i.e., L5–S1 lumbar lordosis, L1–L5 lumbar lordosis, and T4–T12 kyphosis), such as PI, PT, and SS, could be explained by the different habits (e.g., squatting) between Caucasian and Japanese individuals. Unlike other studies, we measured the spinopelvic sagittal values using the EOS imaging system. The EOS shooting method is different from that of ordinary radiography. Thus, we thought that the data obtained would be different from those reported in other studies. However, an insignificant difference was found between the results of this study and those of studies by Lee et al. [1] (47.8°±9.3° for PI, 11.5°±5.3° for PT, and 36.3°±7.8° for SS), Zhu et al. [17] (44.6°±11.2° for PI, 11.2°±7.8° for PT, and 32.5°±6.5° for SS), and Le Huec and Hasegawa [19] (52.0°±10.5° for PI, 11.6°±7.0° for PT, and 40.2°±7.7° for SS). We think that the differences between the values obtained using the EOS imaging system and those obtained using radiography were small. Therefore, a direct comparative study is needed (Table 7).
In this study, SS and PT showed statistically significant differences between sexes. The mean SS was 39.44°±8.13° in males and 34.62°±5.84° in females, and PT was 8.74°±5.50° in males and 12.18°±6.27° in females. However, Lee et al. [1] and Zhu et al. [17] have reported no significant difference in size according to sex (SS: 37.3°±7.1° and 34.4°±8.6° and PT: 11.4°±5.4° and 11.6°±5.1° in males and females, respectively, according to Lee et al. [1]). Moreover, Janssen et al. [20] did not find any significant differences in SS and PT when comparing asymptomatic adult females with males. This study differs greatly from other studies in terms of the number of cases. Thus, the SS and PT values seemed to differ according to sex. Owing to the significant differences in the number of cases between men and women, we think that our results would be different from those of other studies. Therefore, the numbers of men and women should be equalized.
In the Pearson correlation analysis, correlations were found between PI and SS (R=0.737, p<0.001), PI and PT (R=0.659, p<0.001), and L1/S1 lordosis and SS (R=0.616, p<0.001). Before discussing the correlation results, we must understand the concepts of PI, PT, and SS. Each measurement method is described in the measurement parameters. PI represents the shape of the pelvis and has a constant value (mean, 55°), and PT represents the position and degree of rotation of the pelvis. SS refers to the slope of the sacral bone, and SS is a factor reflecting the position of the sagittal lumbar spine, proportional to the PI. The sum of PT and SS is PI, and the formula “PI=PT+SS” has been established [21–24]. Moreover, in this study, since the R-value of PI and SS was lower than that of PI and PT, we assumed that PT acts as a determinant more than SS. Jiang et al. [25] have examined PT and PI in 55 patients with sagittal imbalance and found that the patients had significantly smaller PT and PI values than the normal group. Some studies have indicated that patients’ symptoms also improved when the pelvic alignment in the sagittal plane improved after surgery for degenerative spinal disease [26–28]. As such, pelvic parameters are closely related to each other, and if one parameter is too large, it can be an exacerbating factor of lower lumbar spine and hip joint diseases. Thus, whenever performing spinal surgery, pelvic sagittal balance should always be considered.
This study has several limitations. First, the number of cases was small, which made it difficult for us to claim that our results represent the actual situation in young adults, and more data are needed to improve the reliability of our statistical results. Second, because the subjects were recruited from one region and university at one timepoint, the results might be biased to one side. Third, discussing the comparison of the results is difficult because the data were not directly compared with those from other studies and were compared only between each other. Fourth, EOS images were taken not only in the extended knee position but also in various knee angles. If the parameters for these various knee angles were measured and used in the analysis, we could have discovered other ways to maximize the use of the EOS imaging system.