

Introduction
Diffusion tensor imaging (DTI) is a relatively new magnetic resonance imaging (MRI) technique capable of depicting structural details of the brain and spinal cord white matter. It can assist visualization of white matter tracts in vivo and quantify anisotropy [1]. DTI is computed by tensor analysis, which is a multilinear vector parameter that enables determination of the restricted anisotropic diffusion of water molecules in the structures of living organisms such as white matter nerve fibers [2].
DTI results are quantified by two primary parameters: the apparent diffusion coefficient (ADC) value, which refers to the overall diffusivity of the tissue irrespective of directional dependence, and the fractional anisotropy (FA) value, which reflects the directional dependence of the diffusion process and is expressed as a relative number ranging from 0 to 1 that increases in relation to the anisotropic diffusion within the tissue being evaluated.
Mamata et al. [3] reported that in nerve fiber impairment, the medullary sheath is destroyed and water molecules exhibit increased diffusion in the direction in which they are normally restricted (i.e., diffusion anisotropy is lost); thus, ADC increases and FA decreases. The spinal cord white matter consists of nerve fiber bundles aligned regularly from head to tail. Water molecules diffuse along the component axons resulting in high anisotropic diffusion within the spinal cord white matter, thus facilitating the usefulness of DTI in spinal cord evaluation.
Some reports have suggested the usefulness of DTI parameters for examining the cervical spinal cord [145], but little has been reported on normal values of these parameters. For standard implementation of DTI as a examination method for the cervical spinal cord, it is important to study these normal values in more detail.
The aim of this study was to investigate the accuracy of normal values of DTI parameters and determine their usefulness for definitive diagnoses in patients with cervical myelopathy. We also determined if DTI could be used to objectively evaluate function in compressive cervical disease. As a first step, we calculated normal values of DTI parameters in healthy subjects.
Materials and Methods
This study was approved by the Institutional Review Board of Yamaguchi University Hospital and adhered to the tenets of the Declaration of Helsinki.
1. Subjects
A total of 31 healthy adults (13 men, 18 women; age, 23-87 years; mean age, 46.0±18.8 years) participated in this study. Informed consent was obtained prior to the MRI procedure. Ethics approval was obtained from the local Human Research Ethics Board. All subjects who submitted written informed consent met the exclusion criteria for MRI and exhibited no symptoms of myelopathy or radiculopathy. Subjects were divided into two groups on the basis of age-those >40 years old (n=16) and those ≤40 years old (n=15)-and sex (men, n=13; women, n=18). The paired t-test was used to identify significant differences between groups. Statistical significance was established at p<0.05.
2. Imaging procedures
A 3-T MR scanner (Philips Achieva, Philips Medical System, Eindhoven, The Netherlands) equipped with a 16-channel neurovascular coil was used to perform all examinations from 2010 to 2013. The protocol included conventional sequences to evaluate the spine and spinal cord morphology including T1 and T2. DTI data were acquired by using SE-type Single-Shot EPI sequences. The following scanning parameters were used: TE, 69 ms; TR, 9,079 ms; number of slices, 30; interslice gap, 0 mm; band width, 1,711.8 Hz/pixel; voxel size, 1.79×1.42×4.00 mm; acquisition matrix, 112×140; and number of excitation, 4. Images were acquired with b values of 0 and 700 s/mm2. The DTI parameters, ADC and FA, were measured on axial sections of several cervical levels (C1/2-C6/7).
As shown in Fig. 1, both ADC and FA images were taken, and intraspinal ADC and FA values were measured between each vertebra from the C1/2 to C6/7 level using an axial image that gave stable values. Because DTI is incapable of capturing an image of multiple stacks simultaneously, individual slices were generated at the C4/5 level (a preferred site) as a reference (Fig. 1A). The region of interest was identified manually in the spinal axial view but did not involve the spinal edge to achieve stable values (Fig. 1B-E).
Results
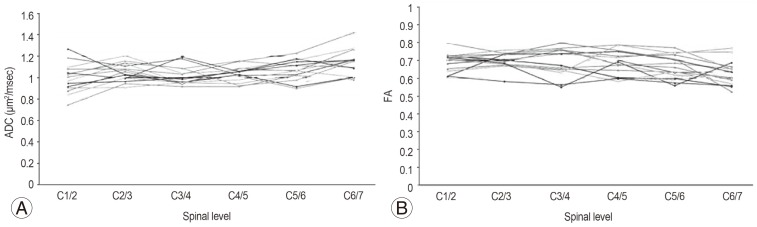
ADC and FA values were most stable on axial sections. Fig. 2 showed the trends of ADC and FA values, respectively, in the 31 healthy subjects. The average ADC value was 1.06±0.09×10⁻³ mm2/sec, and the average FA value was 0.68±0.05.
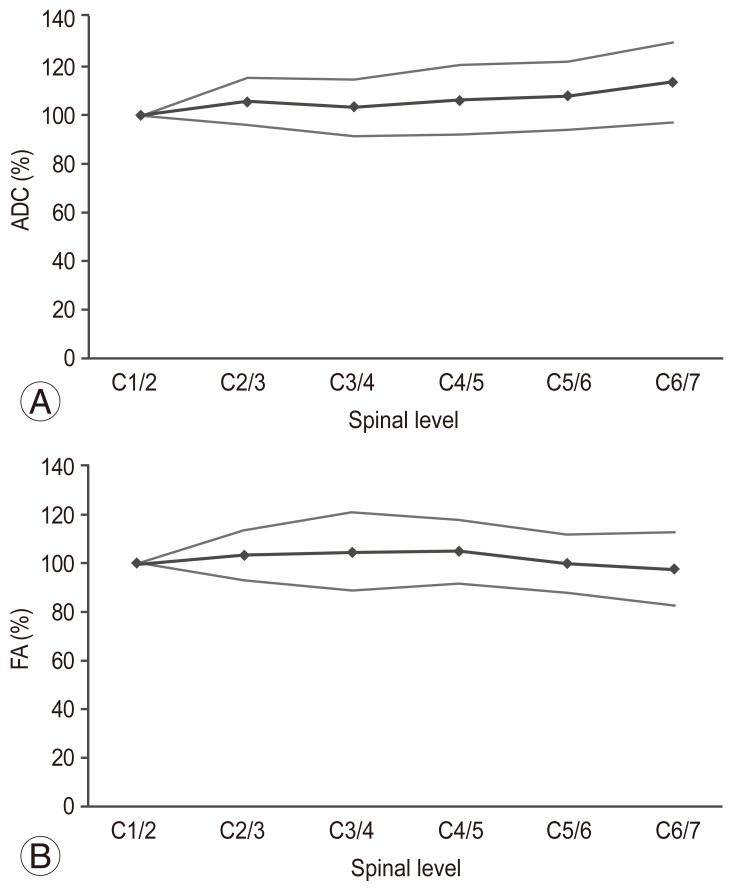
The trend of average ADC values and their standard deviations in the healthy subjects were shown in Fig. 3A. In general, stable values were obtained, but they tended to increase towards the lower cervical levels. As shown in Fig. 3B, a generally stable average FA value was obtained.
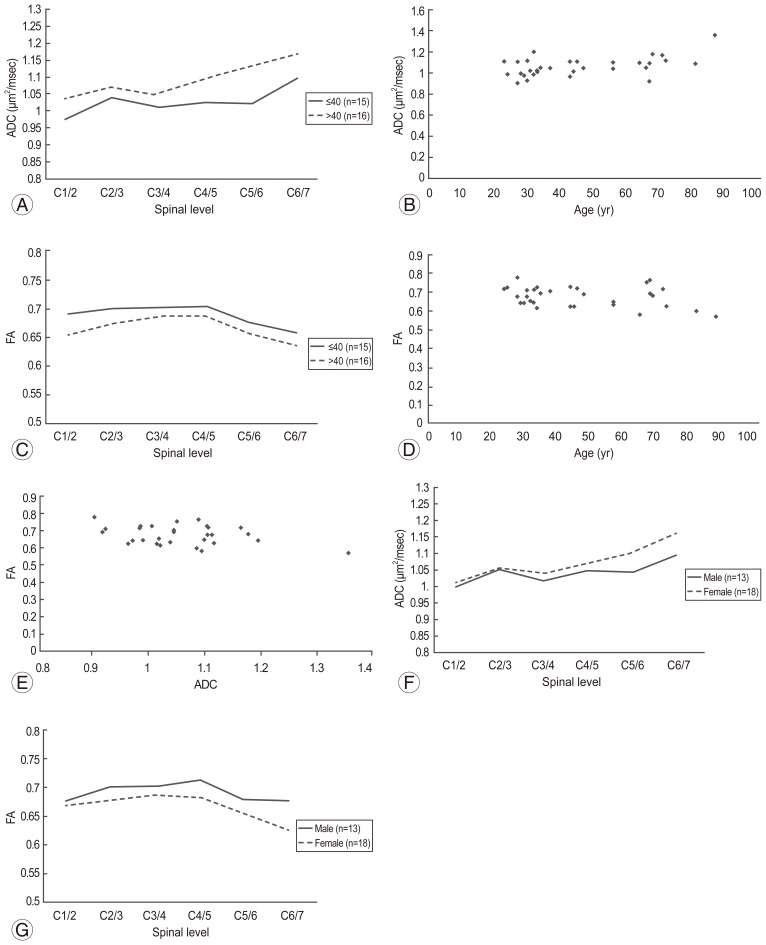
Next, we compared normal ADC and FA values according to age. ADC values were significantly higher in the subjects >40 years of age than in those ≤40 years (p=0.04) (Fig. 4A). Spearman rank correlation coefficient test showed that ADC was positively correlated with age (p=0.02) (Fig. 4B).
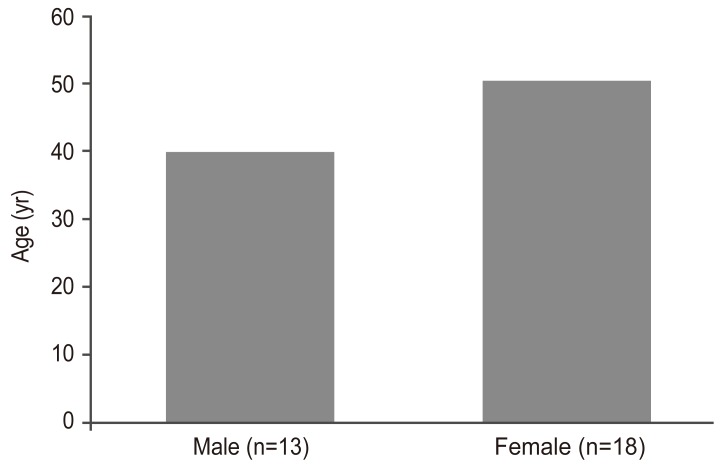
There was no significant difference in FA values among the age groups (p=0.07) (Fig. 4C). Spearman rank correlation coefficient test showed that there was a weak negative correlation between FA and age, but it was not statistically significant (p=0.14) (Fig. 4D). Pearson correlation coefficient test showed that there was a weak negative correlation between ADC and FA values. However, the correlation was not statistically significant (p=0.07) (Fig. 4E). Moreover, although the ADC value tended to be higher in women, there was no significant difference in ADC values between men and women (p=0.24) (Fig. 4F). There was no significant difference in FA values between the two groups (p=0.051) (Fig. 4G); in addition, there was no significant difference in age between the 2 sexes (Fig. 5).
Discussion
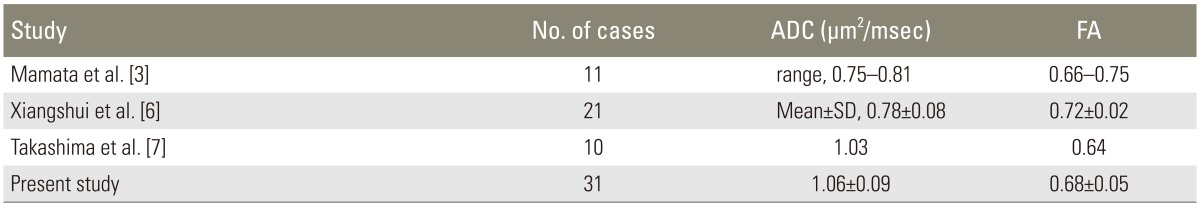
Although some previous studies have compared parameters before and after surgery for compressive cervical disease using DTI [145], few have reported on normal values. Despite the influence of the imaging environment and individual differences on average ADC or FA values in healthy subjects [35], we obtained equivalent and stable normal values, as reported previously (Table 1) [367].
Mamata et al. [3] reported that in healthy subjects, ADC increased with age, whereas FA tended to decrease. In this study, as in previous reports, ADC was significantly higher in subjects >40 years of age; however, there was no significant difference in FA, and no difference between ADC and FA was found between men and women. It is expected that new trends will emerge as the number of cases increase.
Facon et al. [5] reported that a precise measurement is difficult to obtain because the value is affected by age, the measurement site, the imaging device, and the imaging method, even in a healthy spine. The relatively stable and reproducible values obtained in our study cases differed slightly from those previously reported, possibly due to the influence of these factors. To correct for individual differences, it is necessary to make comparisons with normal levels described in previous reports [8].
There are several reports on the usefulness of DTI. For example, Mamata et al. [3] reported that an increase in ADC and decrease in FA indicate the earliest stage of cervical spine disease; and Facon et al. [5] reported that a change in FA is extremely useful in detecting a spinal abnormality in the acute stage. Sei et al. [8] reported that FA and ADC correlated with several items included in the Japanese Orthopedic Association Cervical Myelopathy Evaluation Questionnaire, which suggested that these items can be used to quantify the severity of cervical spinal disease, whereas Wada et al. [1] reported that maintenance of the FA value before surgery may be an indicator of a good surgical outcome. Thus, DTI appears to be useful for the initial assessment of compressive cervical spinal disease or determining whether surgery is indicated. In addition, DTI can be used to quantify and evaluate the severity of cervical spondylotic myelopathy (CSM).
The normal ADC and FA values obtained in this study were stable and reproducible on axial views of several cervical levels and were easy to compare with abnormal values. Therefore, our findings should further contribute to the establishment of normal values. Further, the results of this study indicated that it is important to consider age and sex as DTI parameters and further suggested that measurements between each vertebral level are useful for diagnosis of impairment levels. We also found that comparing parameter values with normal levels contributed to a more accurate diagnosis of CSM. Future studies are required to confirm these results in larger numbers of healthy subjects and patients.
Conclusions
In this study, normal values of DTI parameters were identified in healthy subjects and were both reproducible and stable, which suggested that this method could be useful for patient assessment. Among the study participants, a significant difference was found only in the comparison of ADC by age; thus, it is important to consider age when evaluating cervical myelopathy. For diagnosis of impaired spinal levels, it is also important to consider the difference between the obtained and normal values at several levels.