


Introduction
In an aging society, the increase in incidence of osteoporotic vertebral fractures has become a social problem [1]. After osteoporotic vertebral fractures, collapse is frequently observed in patients receiving conservative therapy [2]. In the worst case, vertebral collapse causes nonunion and sustained severe pain [3]. Therefore, to achieve satisfactory results after osteoporotic vertebral fractures, prevention of collapse is important.
Some previous studies reported factors that affect collapse after osteoporotic vertebral fractures. The high-quality study by Muratore et al. [4] reported that the shape and level of fracture are both relevant to vertebral collapse. Additionally, vertebral collapse is also affected by age [5], thoracolumbar spine level [6], fracture type [7], swelled-front fracture [8], bow-shaped fracture [8], and projecting types of fractures [8]. Moreover, comorbidities, such as cardiac disease and stroke, increase the risk of collapse after vertebral fracture [9]. However, most of these factors cannot be controlled by rehabilitation, which can change physical functions and activities of daily living (ADL), but whether physical functions and ADL affect collapse after osteoporotic vertebral fracture is unknown.
Therefore, this study aimed to reveal physical functions and comorbidity affecting collapse in patients with osteoporotic vertebral fracture, and we hypothesized that not only comorbidity but also physical functions affect vertebral collapse after osteoporotic vertebral fracture.
Materials and Methods
1. Study design
The ethics committee of the Saiseikai Kure Hospital, where participants were recruited, approved this prospective cohort study on patients with vertebral fracture (approval no., 127). This study was conducted in accordance with STROBE (Strengthening the Reporting of Observational Studies in Epidemiology) statement. After provision of a detailed description of the protocol, written informed consent was obtained from all patients. To protect patient confidentiality, identifying information, including patient name, date of birth, and address, was not collected. The study was conducted in accordance with the Declaration of Helsinki.
2. Setting
The study setting was a hospital. Between March 2018 and October 2019, recruitment, follow-up, and data collection were performed. The potential participants were recruited by therapists in the rehabilitation department.
3. Patients
All patients were Japanese and met the following inclusion criteria: (1) osteoporotic vertebral fracture (grade ≥1 in the semiquantitative [SQ] method) treated with conservative therapy, (2) ability to walk independently before fracture, and (3) absence of another or second vertebral fracture during hospitalization. Patients were excluded based on the following criteria: (1) complications during hospitalization and (2) severe dementia (defined as a Revised Hasegawa’s Dementia Scale [HDS-R] score ≤9). HDS-R scores of 21–30, 15–20, 10–14, and ≤9 indicated normal, dementia doubt, light to moderate dementia, and advanced dementia, respectively [10].
Based on the presence or absence of vertebral collapse progression between admission and ≥4 weeks after admission, patients were divided into two groups: if progression of collapse was detected, patients were assigned to the collapsed group, and if progression of collapse was not detected, patients were assigned to the non-collapsed group. In the comparison of computed tomography (CT) or X-ray images obtained at admission and ≥4 weeks after admission, vertebral collapse was determined. The definitions of collapse were as follows: in the case of X-ray, grade assessed by the SQ method increased by at least 1; in the case of CT, collapse was determined by the physician.
4. Intervention
Rehabilitation programs were determined by the therapists according to orders from physicians and were started the next day after admission. Until a corset was made, interventions were performed on the bed on prevention of disuse syndrome. After completion of the corset (>2 weeks), patients performed rehabilitation programs in the rehabilitation room [11]. Rehabilitation programs included functional exercises (neuromuscular facilitation, joint range of motion, and muscle strengthening exercises), ADL exercise, and psychological support for patients and their families. Basically, the frequency and duration of intervention were 5 days per week and 30 minutes to 1 hour per day, respectively. These interventions were implemented until discharge. Discharge from the hospital was set to be the patient’s original life, approximately 2 months after hospitalization. Nonsteroidal anti-inflammatory drugs were habitually used for pain control.
5. Variables
The following basic information was collected: age, sex, body mass index (BMI), duration of bed rest after admission, presence or absence of assistance needed to walk independently in the hospital, dwelling place (home or institution), length of hospital stay, and cognitive function assessed by HDS-R.
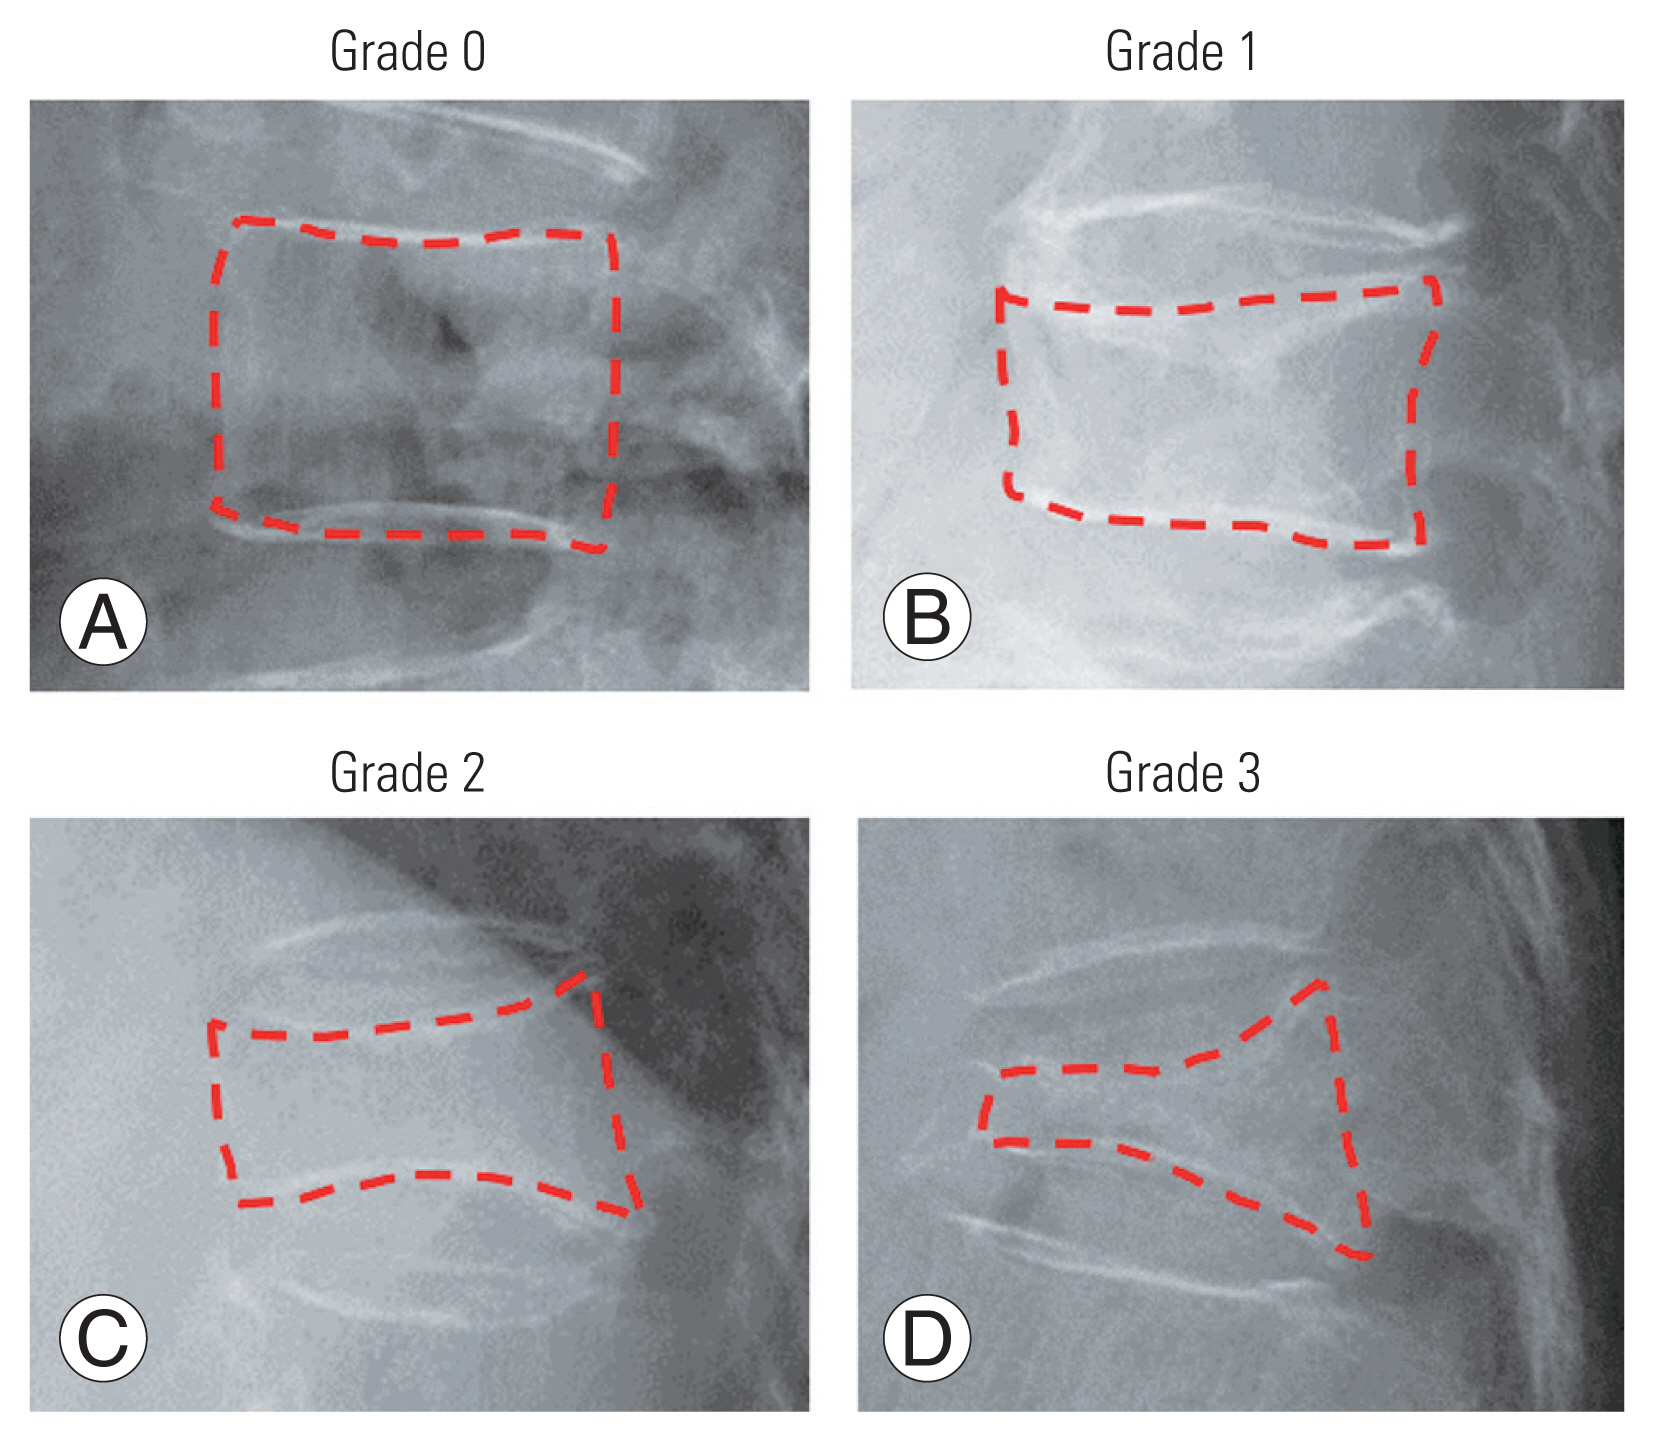
Medical information was as follows: vertebral fracture information (location of fracture, number of fractures, thoracolumbar spine fracture, magnetic resonance imaging [MRI] intensity ratio, degree of fracture, vertebral fractures with posterior wall, presence or absence of neurologic symptoms), previous medical history (chronic obstructive pulmonary disease [COPD], cardiovascular disease, cerebrovascular disease, cancer, hypertension, diabetes, kidney failure, and vertebral fracture), presence or absence of pharmacotherapy (parathyroid hormone, anti-receptor activator of nuclear factor-κB (NF-κB) ligand antibody, bisphosphonate, and selective estrogen receptor modulator), bone metabolism marker (total P1NP, 25-hydroxy vitamin D [25(OH) vitamin D], tartrate-resistant acid phosphatase 5b [TRACP-5b]), and Geriatric Nutritional Risk Index (GNRI). The location of fracture was recorded with detailed spinal fracture sites. The number of fractures was recorded for one or two vertebrae. MRI intensity ratio was calculated as follows: intensity change height/vertebral body height×100 [12]. To determine the degree of vertebral fracture, the SQ method was used, which assesses the degree of vertebral fracture based on visual inspection without measurement of vertebral heights [13]. The grading was as follows (Fig. 1): normal (grade 0); mild deformity (grade 1: 20%–25% reduction in anterior, middle, and/or posterior height and 10%–20% reduction in area); moderate deformity (grade 2: 25%–40% reduction in height and 20%–40% reduction in area); and severe deformity (grade 3: ≥40% reduction in height and area). Grade ≥1 was considered “fractured”, and grade 0 was considered “not fractured”. Previous studies reported that both validity and reliability of the SQ method that assessed the degree of osteoporotic vertebral fracture were high [14,15]. Medical history was recorded if patients had diseases requiring hospital treatments (outpatient or inpatient). Moreover, medical history that was significantly associated with vertebral collapse was investigated in more detail.
Physical functions included pain assessed by Pain Catastrophizing Scale (PCS), Central Sensitization Inventory (CSI), Visual Analog Scale (VAS), knee extension muscle strength, and movement control during one leg standing. We hypothesized that physical functions are related to vertebral collapse. Therefore, pain, muscle strength, and balance ability are assessed as universal physical functions. Pain-related catastrophizing was assessed using the Japanese version of PCS [16], comprised of 13 items describing different thoughts and feelings associated with pain. Patients answered questions according to the following five categories: 0, not at all; 1, slight degree; 2, moderate degree; 3, great degree; and 4, all the time. The total score was used for the analyses. Higher PCS scores indicate greater pain catastrophizing. Central sensitization was assessed using the Japanese version of the CSI [17], which comprised of two parts: A and B. Part A is a questionnaire including 25 self-reported items, and patients answer questions according to the following five categories: 0, never; 1, rarely; 2, sometimes; 3, often; and 4, always. Part B determines characteristic diagnosis history and was not used in this study. Higher scores indicate more severe CS. Pain intensities during rest and activity were assessed by 100-mm VAS. No pain was scored 0.
Isometric knee extension muscle strength was measured using a handheld dynamometer (HHD; Sakai Medical Corp., Tokyo, Japan) [18]. Patients sat on a chair and kept their trunk straight and perpendicular using both hands on the bench beside the body. An HHD sensor was fixed to the anterior lower leg using a traction belt placed between the level of the lateral malleolus of the lower leg and the main pillar behind the chair. Using the HHD, isometric knee muscle extension strength was measured for 5 seconds at a flexion angle of 90°, and care was taken to keep the traction belt parallel to the floor. The measurements were repeated 3 times with intervals of at least 30 seconds between measurements. The corrected muscle strength was obtained using the following equation: muscle strength measured by HHD×lower leg length (nearly to the moment arm)/body weight. Lower leg length was measured as the distance between the lateral epicondyle of the femur and lateral malleolus, with the measurement the leg being optional.
Movement control during one leg standing was assessed according to the criteria described by Lenzlinger-Asprion et al. [19]. The reliability of these criteria had been confirmed by a previous study [20]. Criteria 1: The hip joint should remain stable in rotation, abduction, and extension. The pelvis and upper body should not move from their initial position. Criteria 2: The vertical axis of the leg should remain straight, and varus or valgus should not develop. The patella should be directed to the third metatarsal. Criteria 3: If intermittent support by the hand against the wall or contralateral foot on the floor was necessary, the component was considered incorrect. If additional support was needed throughout the entire exercise, the component was valued as >1 incorrect component. Evaluation was conducted using a 3-point Likert scale: 2 points, correct; 1 point, almost correct; and 0 point, incorrect/false. The leg measurement was optional.
Quality of life was assessed as a psychological function using the questionnaire for quality of life of elderly subjects with osteoporosis (EOQOL), which includes 49 questions [21]. The subdirectories of the EOQOL include pain, ADL, movement, physiological activity, duty, recreation, and well-being. Each question was scored as follows: 5 points, very good; 4 points, good; 3 points, usually; 2 points, bad; and 1 point, very bad. A higher score on the EOQOL was better.
Activity was defined as ADL and walking ability, and these were assessed using the Barthel Index (BI) [22]. BI assesses ADL performance (i.e., feeding oneself, bathing, dressing, grooming, and ability to move) on a scale from 0 to 100 (0, very dependent; 100, independent). Walking ability was scored 0–15 points at intervals of 5 points, where 0 points represent the worst and 15 points represent the best.
Basic medical information was assessed at hospital admission and discharge. Pain (PCS, CSI, VAS) was measured at hospital admission and 4 weeks after admission. Muscle strength and movement control during one leg standing were assessed 4 weeks after admission. ADL and walking ability were assessed before fractures and 4 weeks after admission.
6. Bias
To reduce the measurement bias, the author (T.U.) was not involved in participant enrollment or data collection. Patients were informed of the purpose of the study but not the hypothesis. To reduce selection bias, outcomes were selected based on previous studies.
7. Statistical analysis
First, characteristic data were compared using Mann-Whitney U-test, t-test, and chi-square test, as appropriate. Next, univariable logistic regression analysis was performed to explore the predictors of vertebral collapse at >4 weeks after admission. Finally, hierarchical logistic regression analysis was performed to explore the predictors of vertebral collapse at >4 weeks after admission. Further, hierarchical logistic regression analysis was conducted to explore the association between the desired outcome of vertebral collapse at >4 weeks after admission (scored 1) and vertebral non-collapse at >4 weeks after admission (scored 0). Hierarchical logistic regression analysis used two models: model 1, admission model using basic medical information and physical function at admission; model 2, prediction model using a data set of basic medical information and physical function at 4 weeks. Initially, age, sex, and BMI were forcibly input as confounding factors in block 1. Thereafter, other independent variables were input using a variable increasing method in block 2. The threshold of correlation coefficient between independent factors was set to 0.8, and a high correlation with the dependent variable was selected to account for multicollinearity. To comprehensively examine the extracted variables, the logit transformed value of the p-value obtained from the regression analysis was defined as the score. The score was provided as a summary of the effects of the extracted independent variables in the form of a linear expression, and this score can appropriately correspond to the probability value by inverse transformation of the logit transformed value. The score can be used to appropriately estimate the mutual association (tradeoff) between each extracted independent variable considering the main effect leading to collapse at ≥4 weeks. Further, to predict vertebral collapse at >4 weeks after admission, prior probability was calculated based on Bayes’ theorem to calculate the posterior probability for the score. All statistical analyses were conducted using IBM SPSS ver. 22.0 for Macintosh (IBM Corp., Armonk, NY, USA), and the significance level was set at a p-value <0.05.
8. Sample size
Study size was calculated using MedCalc statistical software ver. 19.2 (MedCalc Software, Ostend, Belgium). The area under the receiver operating characteristic curve (AUROC) could distinguish between nonpredictive (AUROC <0.5), less predictive (0.5< AUROC <0.7), moderately predictive (0.7< AUROC <0.9), highly predictive (0.9< AUROC <1), and perfect prediction (AUROC=1) [23]. In this study, an AUROC value of 0.7 was set as criteria to indicate the superiority of statistical discrimination. As for the ratio between the two groups, Kanchiku et al. [7] reported that 57% of elderly Japanese patients with osteoporotic vertebral fractures (average age, 79 years) had collapse after admission. Based on this finding, we assumed that the ratio of the negative to positive patients (i.e., those with collapse at ≥4 weeks after admission) was 1 (50%) to 1 (50%). The alpha value was set at 0.05, and power was set at 0.8. The hypothesized AUROC and null hypothesis AUROC were set at 0.75 (indicating moderate power) and 0.5 (indicating no discriminating power), respectively. Consequently, 19 patients were required in the positive group and 19 in the negative group, with a total of 38 patients.
Results
Fig. 2 shows the flowchart of the measurement of patient characteristics. Of 70 patients, 24 were excluded from the analysis, in whom 13 patients developed complications during admission and 11 patients had severe dementia. Finally, 46 patients (nine men, 37 women) with a mean age of 81.5±9.4 years were included in this study (Table 1). The variables, which had significant difference between the two groups, were degree of fracture at admission, presence or absence of cardiovascular disease, walking independence before admission, degree of fracture at ≥4 weeks, and one leg standing movement control at 4 weeks. Regarding cardiovascular disease, three, three, and two patients had ischemic heart disease, heart failure, and atrial fibrillation, respectively. Patients were divided into the collapsed (n=22) and non-collapsed (n=24) groups based on the presence or absence of vertebral collapse. (Please see Methods section.)
Univariable logistic regression analysis was conducted to evaluate factors affecting collapse at ≥4 weeks after hospital admission. The results of the univariable logistic regression analysis revealed that cardiovascular disease (p<0.05) and movement control during one leg standing at 4 weeks (p<0.05) were significant predictors of vertebral collapse at ≥4 weeks after admission (Table 2). The odds ratios were 10.73 and 3.61, respectively.
Hierarchical logistic regression analysis for model 1 was used to determine factors affecting collapse at ≥4 weeks after hospital admission. The final independent variables were age, sex, BMI, HDS-R, vertebral fracture information (number of fractures, thoracolumbar spine fracture, MRI intensity ratio, vertebral fractures with posterior wall, and presence or absence of neurologic symptoms), previous medical history (COPD, cardiovascular disease, cerebrovascular disease, cancer, hypertension, diabetes, kidney failure, and vertebral fracture), presence or absence of pre-pharmacotherapy, bone metabolism marker (total P1NP, 25(OH) vitamin D, and TRACP-5b), GNRI, PCS, CSI, VAS during rest and activity at admission, and ADL and walking independence before admission.
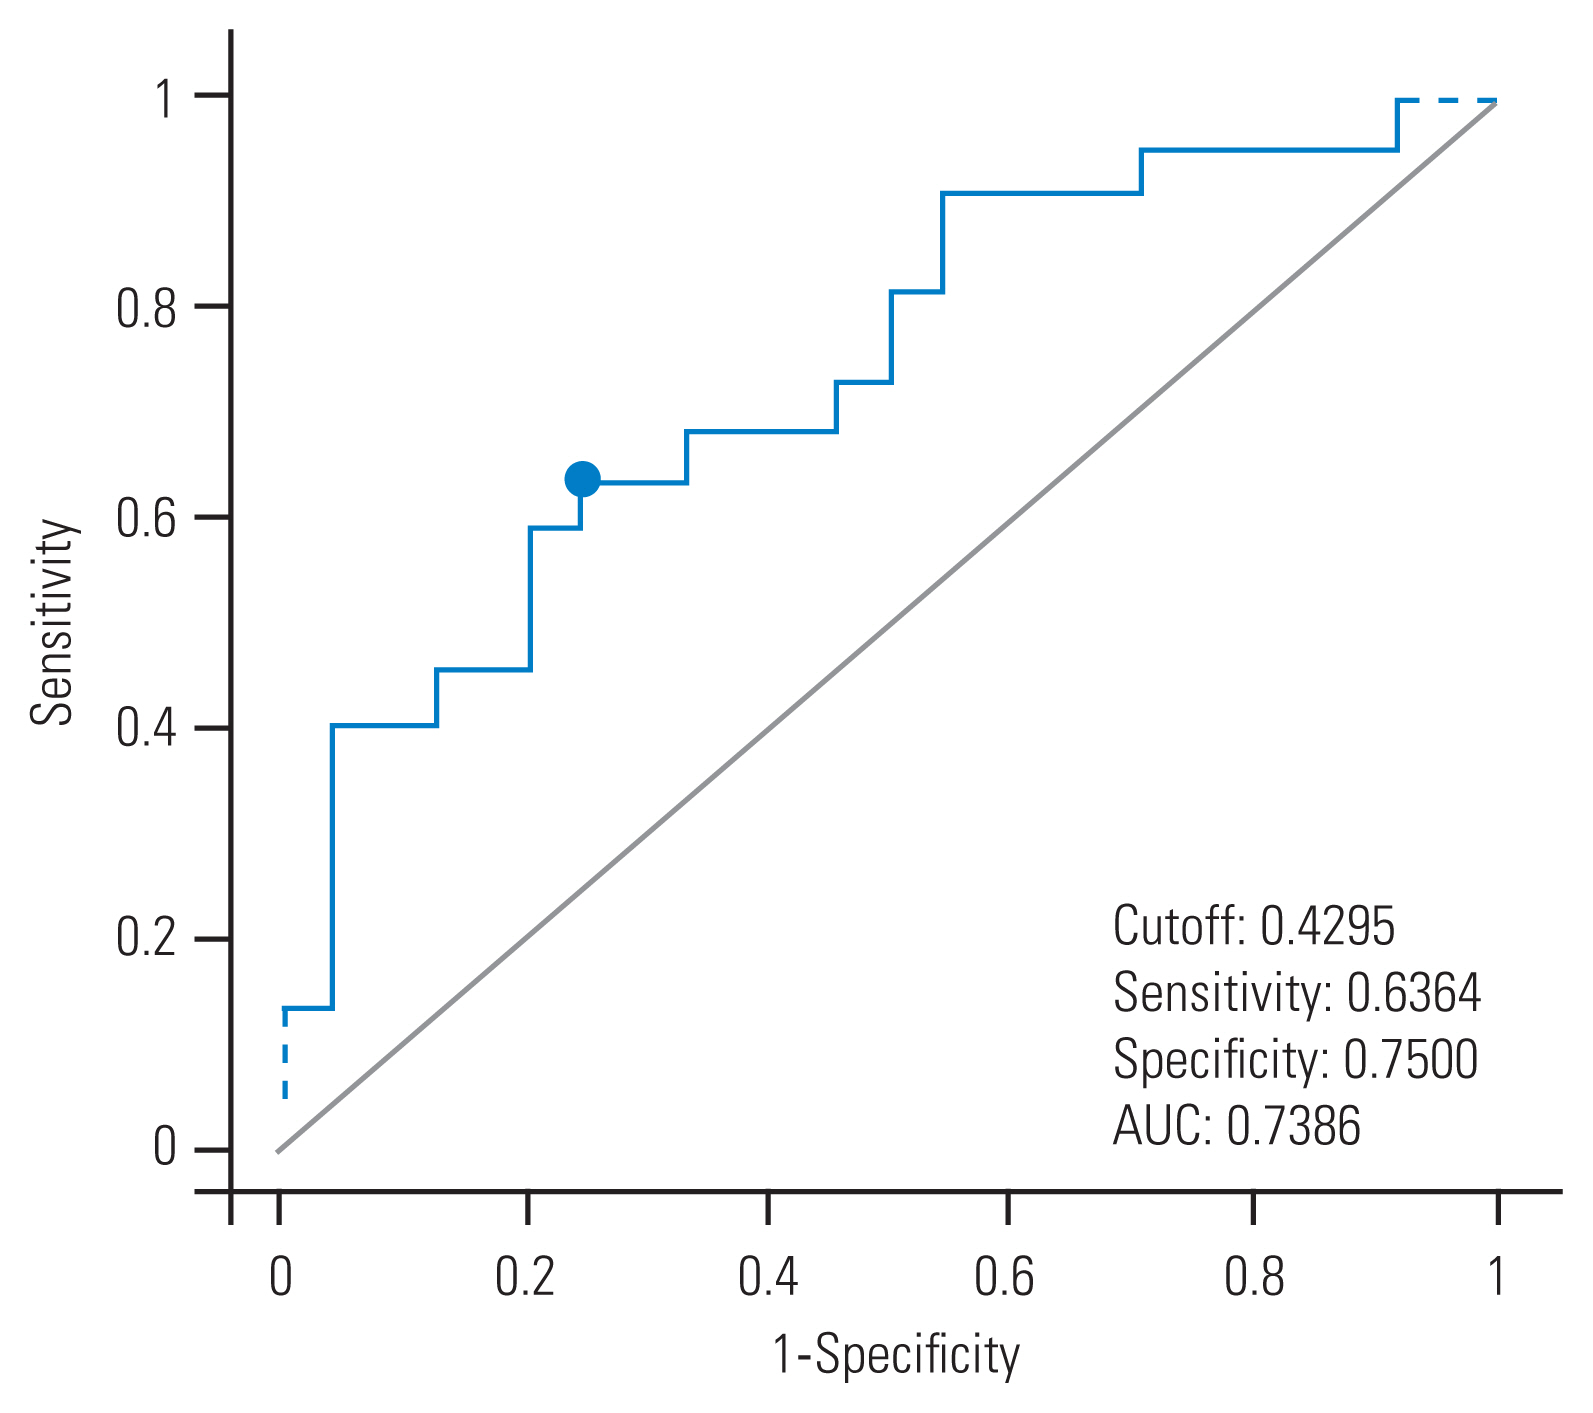
The results of the hierarchical logistic regression analysis revealed that cardiovascular disease (p<0.05) was a significant predictor of vertebral collapse at ≥4 weeks after admission (Table 3). The odds ratio (95% confidence interval [95% CI]) was 12.27 (1.28–117.91). The diagnostic performance of the predictive score for vertebral collapse at >4 weeks after admission is shown in Table 4. The prior probability of vertebral collapse at >4 weeks after admission was 47.8%. The results of the receiver operating characteristic (ROC) analysis revealed that the cutoff score was 0.42 points (Fig. 3), and the sensitivity, specificity, and likelihood ratio were 0.63, 0.75, and 2.54, respectively. The posterior probability was 70.0%.
Hierarchical logistic regression analysis for model 2 was used to determine factors affecting collapse at ≥4 weeks after hospital admission. The final independent variables were age, sex, BMI, duration of bed rest after admission, presence or absence of hospital walking independence, length of hospital stay, HDS-R, vertebral fracture information (number of fractures, thoracolumbar spine fracture, MRI intensity ratio, vertebral fractures with posterior wall, and presence or absence of neurologic symptoms), previous medical history (COPD, cardiovascular disease, cerebrovascular disease, cancer, hypertension, diabetes, kidney failure, and vertebral fracture), presence or absence of pre-pharmacotherapy, bone metabolism marker (total P1NP, 25(OH) vitamin D, TRACP-5b), GNRI, PCS, CSI, VAS during rest, and activity, knee extension strength, movement control during one leg standing, QOL, ADL, and walking independence at ≥4 weeks.
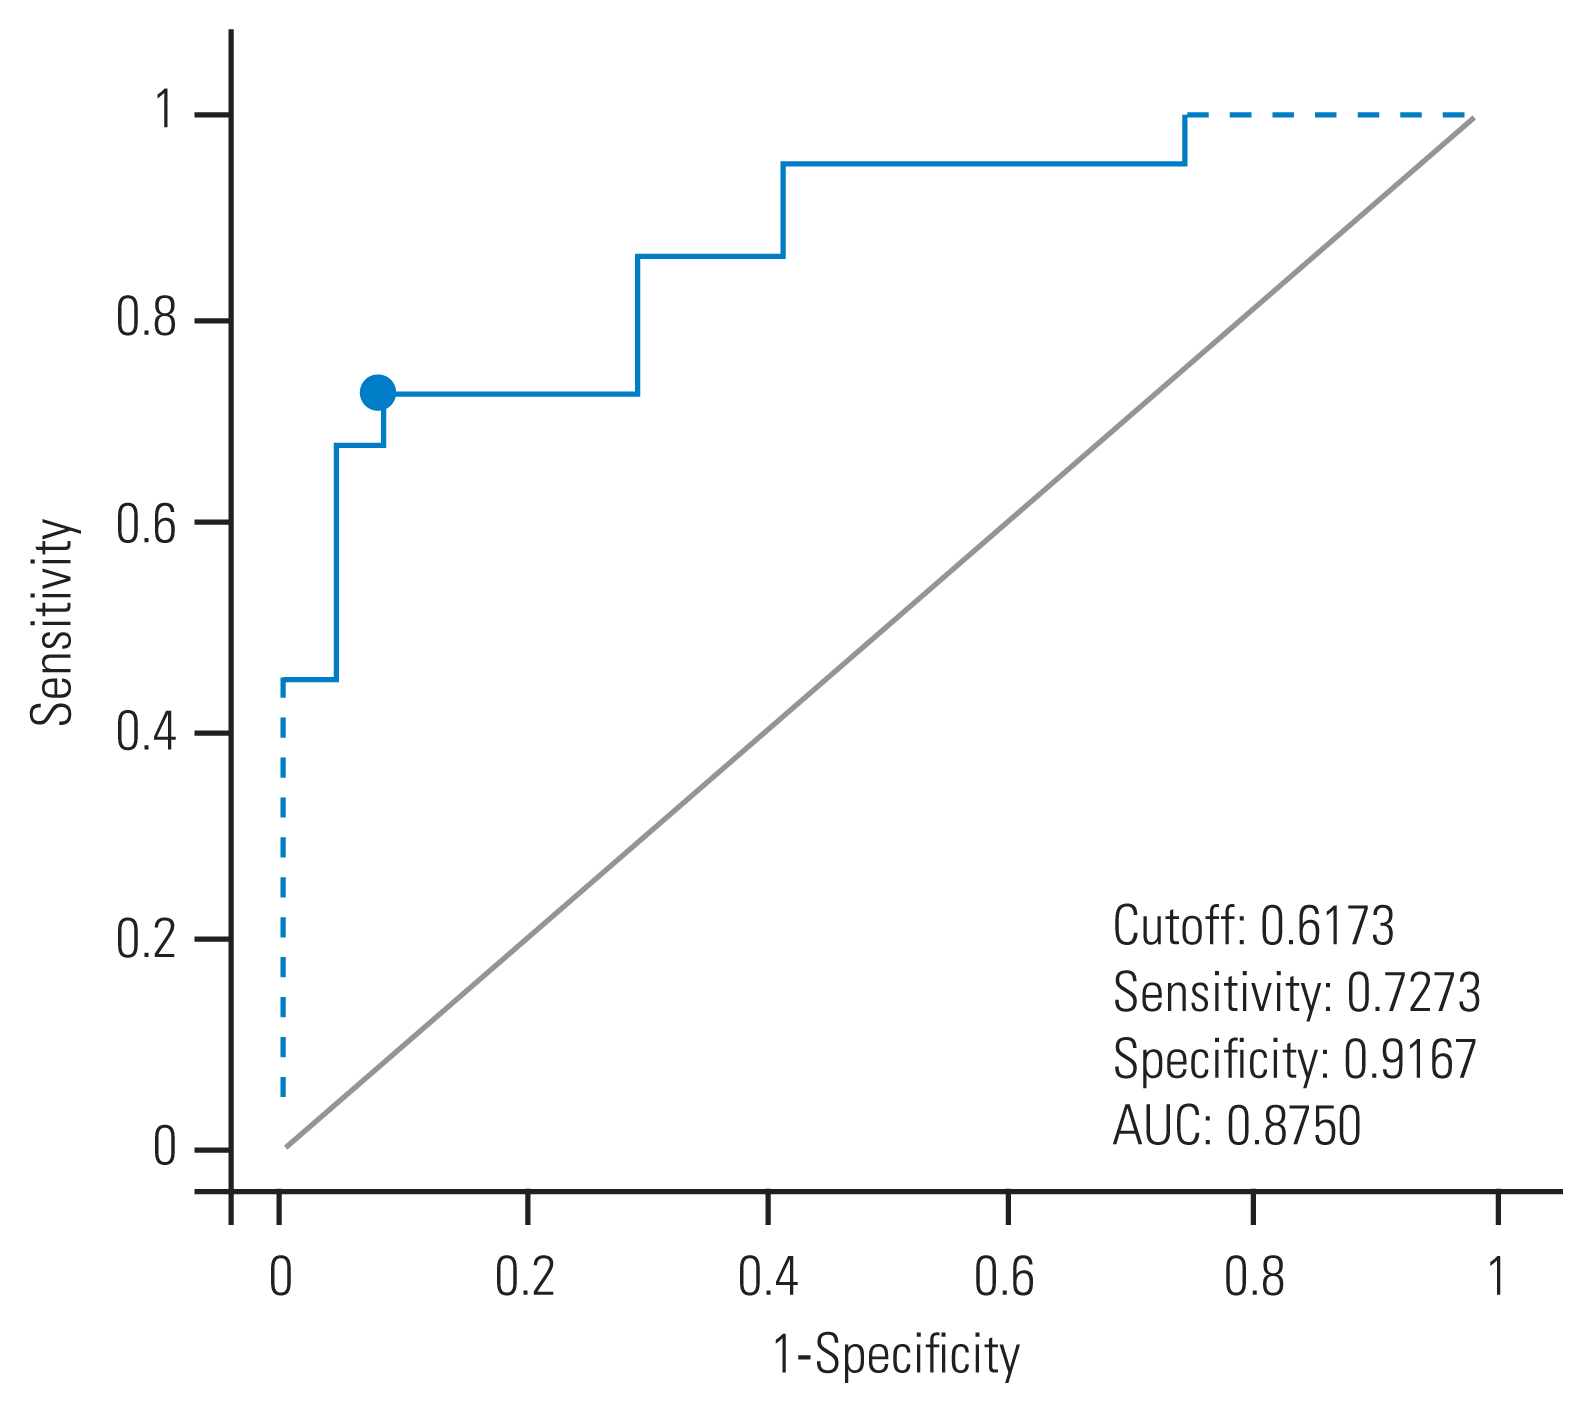
Hierarchical logistic regression analysis revealed that significant predictors of vertebral collapse at >4 weeks after admission were cardiovascular disease (p<0.05), movement control during one leg standing at 4 weeks (p<0.05), and PCS score at 4 weeks (p<0.05) (Table 3). The odds ratios (95% CI) were 34.57 (2.53–471.74) in cardiovascular disease, 7.25 (1.36–38.71) in movement control during one leg admission, and 1.11 (1.01–1.21) in PCS score at 4 weeks. The diagnostic performance of the predictive score for vertebral collapse at >4 weeks after admission is shown in Table 4. The prior probability of vertebral collapse at ≥4 weeks after admission was 47.8%. The results of the ROC analysis revealed that the cutoff score was 0.61 points (Fig. 4), and the sensitivity, specificity, and likelihood ratio were 0.68, 0.91, and 8.18, respectively. The posterior probability was 88.0%.
Discussion
Preexisting cardiovascular disease was the significant influencing factor common in both models 1 and 2. There are no studies investigating the relationship between vertebral collapse and cardiac disease. However, recently, there were several studies [8,24] on the relationship between osteoporosis and cardiac disease. Ischemic heart disease is caused by atherosclerosis, which is characterized by the deposition of calcium in the tunica media of blood vessels (called calcification). Persy and D’Haese [24] reported that calcification of the vessel wall occasionally causes a decrease in mineral bone density and abnormalities in bone metabolism. This phenomenon was called “calcification paradox”. Of eight patients who had cardiac disease, three patients had ischemic heart disease. Conversely, osteoporosis may cause cardiovascular disease via increased release of calcium and phosphorus from the bone due to bone resorption. Both osteocytes and osteoblasts have endocrine function that can induce arteriosclerosis and changes in carbohydrate metabolism via secretion of osteocalcin and fibroblast growth factor 23 [25]. In fact, previous studies have reported significant association between osteoporosis or low bone density and incidence of atherosclerosis, vascular calcification, and atherosclerotic disease [26]. Our results suggest a close relationship between cardiovascular disease and vertebral collapse, although a causal relationship between these was unknown. Thus, collapse at ≥4 weeks after admission in patients with osteoporotic vertebral fractures requires presence or absence of cardiac disease. However, the 95% CI for the presence of cardiovascular disease was large. The reason for this may be attributable to the use of Woolf’s formula for calculating 95% CI and the fact that only one patient had cardiovascular disease among those without vertebral collapse at ≥4 weeks after admission.
One of the significant influencing factors in model 2 was good movement control during one leg standing at ≥4 weeks after admission. Interestingly, a relationship between vertebral collapse and movement control during one leg standing has not been previously reported. Furthermore, the difference in stimulation to the spine depending on movement control is also unknown. A difference in bone stimulation during one leg standing between participants with good movement control and those with poor movement control was reported in precious studies, although these studies focused on the femur; the bone in participants with good movement control was more evenly loaded than those with poor movement control [27]. Based on these findings, we speculate that the fractured vertebral bodies in patients with good movement control might receive higher stimulation, which induces collapse, than those in patients with poor movement control.
PCS score at ≥4 weeks after admission was also a significant influencing factor in model 2, and the relationship between vertebral collapse and PCS score has also not been previously reported. Pain catastrophizing is conceptualized as a negative cognitive–affective response to anticipated or actual pain [28]. Patients with vertebral collapse might have more long-lasting pain than patients with no vertebral collapse. In fact, although there is no statistically significant difference, in our study, the VAS during rest at ≥4 weeks after admission was slightly higher in the collapsed group (0.9±2.3) than in the non-collapsed group (0.4±1.0). Previous studies have shown that long-lasting pain increases PCS score [29]; therefore, vertebral collapse might induce higher PCS scores via long-lasting pain.
This study has four limitations. First, we could not completely examine all factors that are considered to contribute to collapse in patients with osteoporotic vertebral fracture. Iwata et al. [30] reported that bone mineral density, sagittal balance parameters, and spinopelvic alignment assessments mainly affect vertebral collapse. Further studies, which examine other factors including physical functions, are needed to elucidate the mechanisms of collapse. Second, the point is the method of judging vertebral collapse. There are two methods to assess vertebral collapse: SQ and quantitative methods. In this study, we used the SQ method. While the quantitative method can detect minor fracture, the SQ method can classify fracture severity [14]. Although the high reliability of the SQ method was confirmed by previous studies [15], our study might be missing minor fractures. To evaluate the collapse in more detail, further studies using the quantitative method will be desirable. Third, rehabilitation programs were determined according to the physicians’ order and were different among patients. Whether differences in rehabilitation program affect vertebral collapse is unknown. Lastly, cardiovascular disease extracted as a risk factor in the logistic regression analysis of this study had large CI for the odds ratio. The reason for this is attributable to the small sample size. The influence of cardiovascular disease was unclear from a clinical viewpoint although it was statistically significant. The sample size should be increased, and further analysis, such as propensity score matching, should be conducted in the future.
Conclusions
This study examined factors that affect collapse at ≥4 weeks after admission in patients with osteoporotic vertebral fractures. In model 1, the significant influencing factors for vertebral collapse at >4 weeks after admission was cardiovascular disease. In model 2, the significant influencing factors affecting vertebral collapse at >4 weeks after admission were cardiovascular disease, one leg standing movement control at 4 weeks, and PCS at 4 weeks. Our results indicate that physical functions and comorbidity affect collapse at ≥4 weeks after admission in patients with osteoporotic vertebral fractures.