


Introduction
Anterior cervical discectomy and fusion (ACDF) is the most commonly performed surgical procedure for degenerative cervical spine disorders. It has seen an increased application over the past decade [1,2]. The popularity of the procedure derives from its low complication rate, reliable outcome, and short postoperative recovery [3,4]. ACDF was originally designed to use autologous bone grafts for arthrodesis. The technique has demonstrated high fusion rates and few immunological complications [5,6]. However, the need for a second surgical site and the possibility of long-term pain, infection, or bleeding at the graft site has led to the development of alternative implant materials [7,8]. Most ACDF surgeries currently use a structural allograft (SA) or biomechanical intervertebral cage (BC) for the cervical fusion [9ŌĆō11], which is critical to the long-term success of the operation.
Allograft substitutes include cortical, cancellous, and composite cadaveric bone, whereas synthetic cages are usually made from carbon-fiber reinforced polymers, most commonly polyetheretherketone (PEEK) [10]. While favorable outcomes have been independently reported for SA and BC ACDF procedures [12,13], comparative analyses have been limited to a handful of retrospective, single-center, national database studies [14ŌĆō17]. The findings from these investigations have been mixed, with several groups associating the use of synthetic cages with higher rates of revision surgery [14,16ŌĆō18] and others supporting the converse claim [15]. The studies were further limited by small sample sizes, short-term postoperative outcomes, and procedures with single-level fusion. Given the widespread application of ACDF to correct degenerative cervical spine disorders, understanding the costs, complications, and postoperative risks of different procedural implant materials is imperative. In the present study, the largest published cohort of patients who underwent ACDF was analyzed to better characterize the postoperative complication, readmission, and reoperation rates, as well as the economic impact, of ACDF using BC and SA implants.
Materials and Methods
1. Data source
Records on adult patients who underwent an ACDF procedure from 2007 to 2016 were retrieved from the Thomson Reuters MarketScan Commercial Claims and Encounters Database (Truven Health Analytics Inc., Ann Arbor, MI, USA). The Commercial Claims database is a national registry that captures person-specific clinical utilization, expenditures, and enrollments across inpatient, outpatient, and prescription drug services. Separate claims by the same patient are linked through individual-specific enrollment identification numbers, allowing an individual patient to be tracked over time. Diagnostic and procedural data are given as International Classification of Diseases 9th (ICD-9) or 10th version (ICD-10) and Current Procedural Terminology (CPT) codes. The database encompasses patient records from all 50 states of the United States of America. All costs reported here are in US dollars (US$).
2. Inclusion criteria
Patients who underwent an ACDF procedure using either an SA or BC implant were identified via the CPT and ICD-9/10 codes listed in Supplement 1. The SA or BC code had to be listed as the primary procedure code for the admission to avoid capturing patients who might have been admitted for another principal concern. Any patient with posterior arthrodesis was excluded to disregard patients whose ACDF may have been part of a staged procedure. All patients with a history of fracture or those who received both BC and SA implants were also excluded. Patients aged <18 years at the time of surgery were also excluded. Additionally, patients with a history of ossification or another deformity of the posterior longitudinal ligament in the cervical region were excluded. Finally, patients with diagnostic codes consistent with trauma, tumor, infection, or other emergent status were excluded to ensure only elective procedures were included. For patients who underwent surgical revision, the index ACDF was identified and isolated. The top 10 principal admitting diagnoses for BC and SA cases are listed in Supplements 2 and 3.
3. Variables and outcomes
Patient demographic information was collected, including age, sex, comorbidity status, and history of diabetes, congestive heart failure, cardiac arrhythmia, myocardial infarction (MI), osteoporosis, liver disease, peptic ulcer disease, obesity, and tobacco use. Operative characteristics, such as the use of bone morphogenic protein (BMP) or anterior cervical plating and the number of fused levels, were noted. The Charlson comorbidity index (CCI) score of each patient was calculated using their full comorbidity history. Selected comorbidities are presented in Table 1.
One outcome of this study was the difference in postoperative complication rates within 90 days of the index ACDF surgery between allograft and cage procedures. The complications recorded included posthemorrhagic anemia (PHA), delirium, dysrhythmia, surgical site hematoma, wound dehiscence or surgical site infection, deep vein thrombosis, MI, stroke, dural tear, and dysphagia. Complications related to the pulmonary system were also assessed, specifically, respiratory failure, pulmonary embolism, pneumonia, acute respiratory distress syndrome, acute pulmonary edema, and respiratory insufficiency.
Short-term outcomes, specifically, the length of stay after the index ACDF surgery, postoperative readmissions, and complications, as well as inpatient costs, were also considered and compared between cage and allograft procedures. The costs for the first admission were noted and delineated according to total hospital payments, total payments to the principal physician, and total inpatient costs. Long-term outcomes, such as the reoperation rates at 1 and 2 years after the index ACDF surgery, were also evaluated.
4. Patient groups, propensity-score matching, and statistical analysis
The included patients were divided into the BC and SA cohorts. Patients with missing data were excluded from further analysis.
To minimize the effect of potential confounding on the direct comparison of patients with and without BC, propensity-score matching (PSM) was performed. A greedy nearest-neighbor algorithm without replacement was employed to match the patient cohorts at a 1:1 SA-to-BC ratio using a 0.01 caliper. Patient demographics (age, sex, year of operation, and geographic region) and comorbidities, including CCI and operative factors (BMP, anterior cervical plating, allograft use, and number of fused levels), were inputted into the algorithm to account for potential confounding relationships. Improved covariate matching was confirmed through standardized mean difference analysis. The outcome variables (length of stay, readmission, complication, reoperation, and costs) before and after PSM were recorded to demonstrate the extent the matched variables influenced baseline outcome differences. Outcomes for cases with 1- to 2-level and 3+-level fusion before and after PSM were also summarized separately.
The two-sample t-test, chi-square test, or FisherŌĆÖs exact test was used as appropriate. Information on the level of significance is provided in each table caption. Statistical analysis was conducted using R Studio ver. 1.0.153 (RStudio, Boston, MA, USA) and Stata/SE ver. 16.1 (Stata Corp., College Station, TX, USA).
Results
1. Patient cohort
A total of 110,911 patients met our inclusion criteria, of which 65,151 (58.7%) received BC and 45,760 (41.3%) received SA (Table 1). At baseline, patients who underwent BC ACDF surgeries were older (median age, 53 years; interquartile range [IQR], 46ŌĆō60 years) than those who underwent SA ACDF surgeries (median age, 52 years; IQR, 45ŌĆō59 years; p<0.001). On average, the BC cohort was predominantly female (p<0.001) and had a higher comorbidity burden than the SA cohort. The mean┬▒standard deviation CCI score for the BC group was 2.1┬▒2.2, compared with 2.0┬▒2.2 for the SA group (p<0.001). The use of BMP was low in both groups, although higher in BC surgeries (3.4% versus 1.4%, p<0.001). Conversely, the use of anterior cervical plating was higher in the SA group (97.0% versus 94.4%, p<0.001). Multilevel fusions were more common in the BC group (7.8% versus 6.4%, p<0.001), as were presenting diagnoses of myelopathy (27.5% versus 24.5%, p<0.001) and cervical stenosis (58.6% versus 56.8%, p<0.001). The southern United States saw significantly more BC operations performed than SA operations (Supplement 4) compared with other regions.
2. Cost of treatment in unmatched cohorts
The total inpatient costs varied significantly between BC and SA procedures (Table 2), with the median total cost for a BC admission at $28,896 (IQR, $21,066ŌĆō$40,509) compared with $25,302 (IQR, $18,806ŌĆō$34,363) for an SA admission (p<0.001). PhysicianŌĆÖs fees were also higher in the BC cohort, with the median fee at $5,646 (IQR, $4,200ŌĆō$7,572) compared with $4,701 (IQR, $3,558ŌĆō$6,278) for an SA admission (p<0.001). Differences in total hospital costs were also noted between the two cohorts. The average length of hospitalization after BC procedures was slightly longer than that after SA procedures (1.50 days versus 1.46 days, p<0.001).
3. Quality outcomes in unmatched cohorts
Patients who underwent BC surgeries had slightly higher reoperation rates within 90 days of the index ACDF procedure than those who underwent SA surgeries (0.9% versus 0.7%, p=0.020) (Table 2). The BC cohort further showed higher reoperation rates at 6 months (p<0.001) and 1 year (p=0.004), but the difference disappeared at 2 years (4.8% versus 4.7%, p=0.240). The BC group was also more likely to be readmitted within 30 days (2.6% versus 2.3%, p=0.001), 60 days (3.6% versus 3.3%, p=0.010), and 90 days (4.9% versus 4.4%, p=0.001) of the index ACDF procedure, although the odds ratio (OR) at 90 days only indicated a 9% relative risk reduction (OR, 0.91; 95% confidence interval [CI], 0.85ŌĆō0.96) (Table 2).
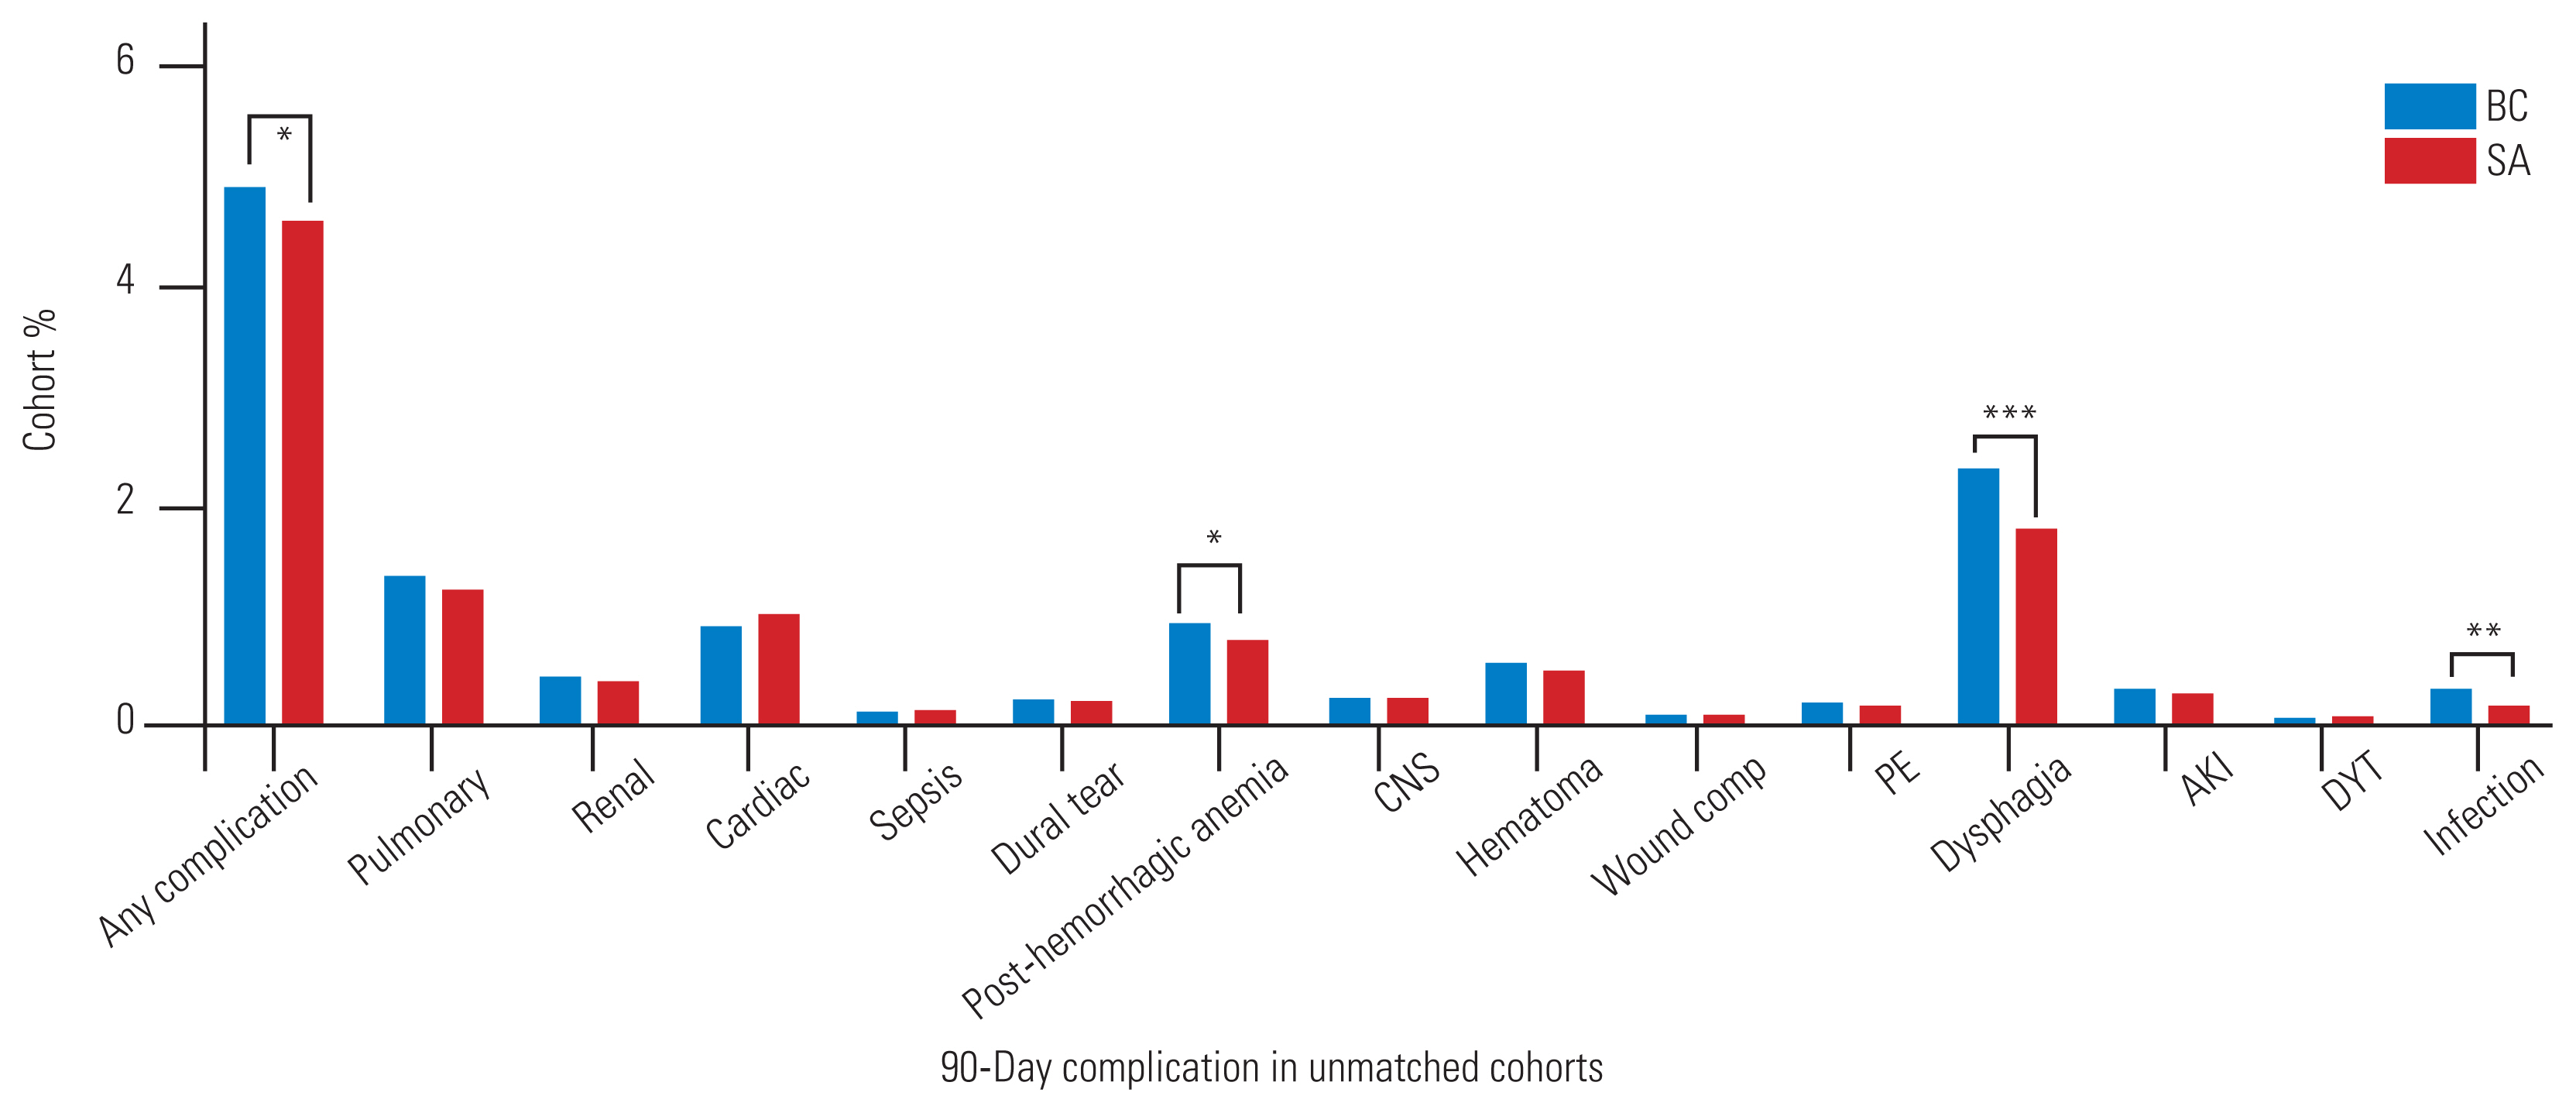
4. Complications in unmatched cohorts
While the absolute rates of postoperative complications were low in both cohorts, BC procedures were slightly more likely to develop a postoperative complication than SA procedures (4.9% versus 4.6%, p=0.022) (Fig. 1). The rates of pulmonary, renal, wound, and cardiac complications did not vary significantly between the BC and SA cohorts, nor did the rates of dural tears. However, the PHA (0.9% versus 0.8%, p=0.034), dysphagia (2.4% versus 1.8%, p<0.001), and infection (0.3% versus 0.2%, p=0.001) rates were higher among patients who underwent BC implantation.
5. Propensity score-matched analysis
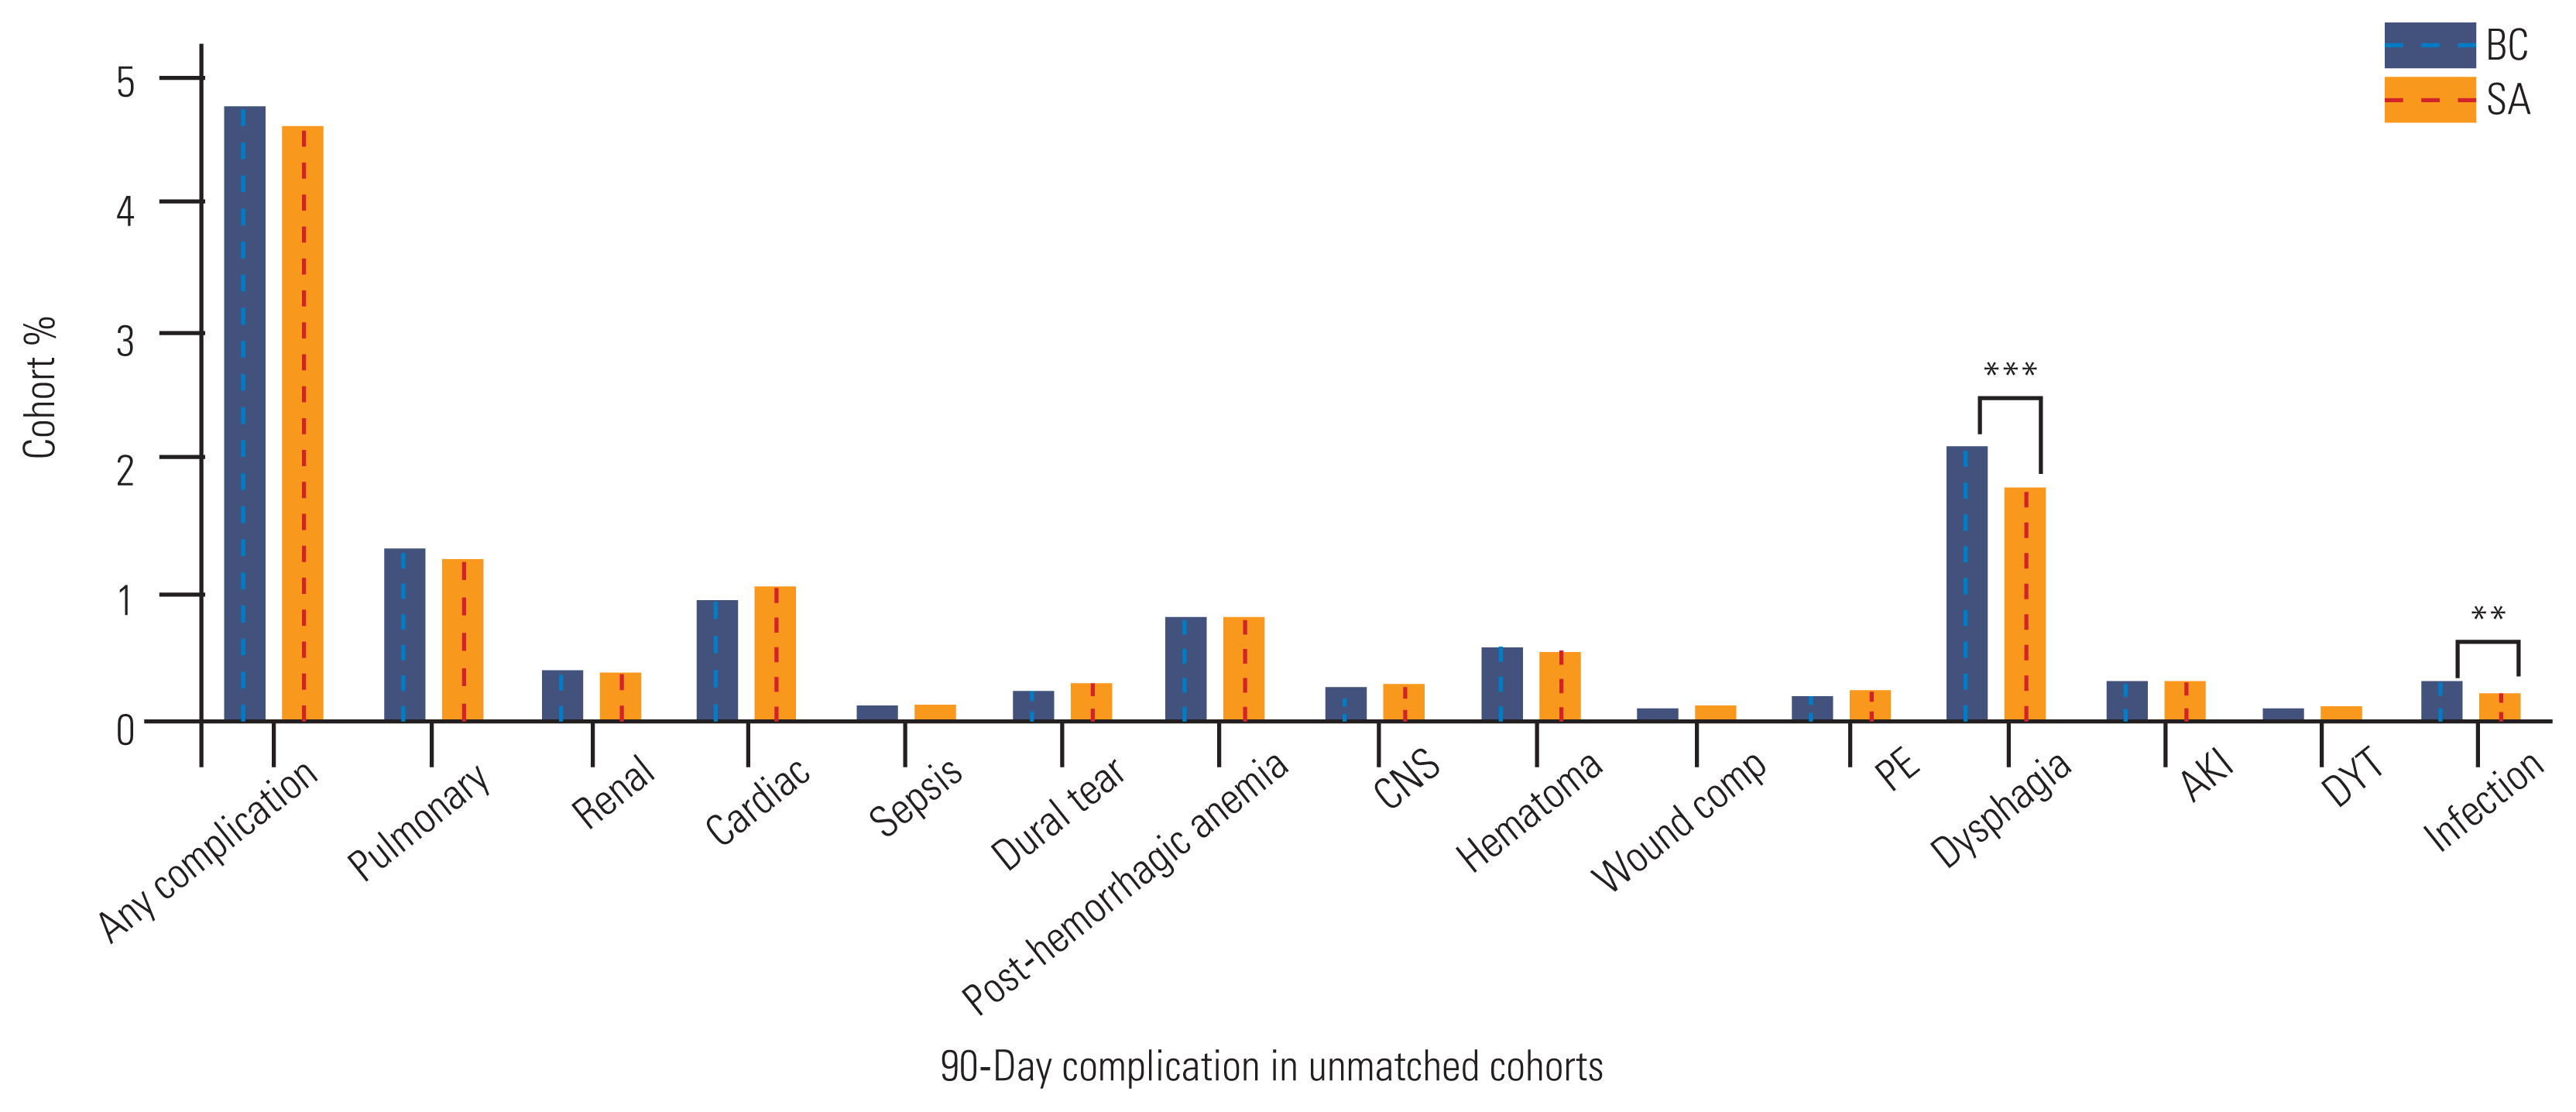
The PSM algorithm successfully matched 43,412 BC procedures to 43,412 SA procedures. Following PSM, the baseline patient demographics and comorbidities showed an improved covariate balance between the two cohorts (Table 3 and Supplements 5, 6). The mean CCI no longer varied significantly between the two cohorts (2.02 versus 2.03, p=0.586), nor did the rates of multilevel fusion (6.6% versus 6.7%, p=0.604) or myelopathy (25.3% versus 25.1%, p=0.563). After PSM, the postoperative complication rates no longer differed between patients who received BC versus those who received SA implant materials (4.8% versus 4.6%, p=0.369), although the dysphagia (2.2% versus 1.8%, p<0.001) and infection (0.3% versus 0.2%, p=0.007) rates remained higher for the BC group (Fig. 2). The differences in total inpatient costs between the two groups decreased ($27,828 versus $25,622), although this was largely due to an equilibration in total hospital costs ($18,921 versus $18,241) (Table 4). The median physicianŌĆÖs fees for BC cases remained higher ($5,636) than those for SA cases ($4,711, p<0.001). Differences in the average length of hospitalization disappeared (1.48 days versus 1.47 days, p=0.448).
As previously observed, reoperation rates were higher for BC than for SA surgeries, including at 90 days, 6 months, 1 year, and 2 years (5.0% versus 4.7%, p=0.021), although the OR did not indicate a substantial risk reduction (OR, 0.93; 95% CI, 0.87ŌĆō0.99) (Table 4). While the readmission rates at 30 days and 60 days after the index ACDF procedure did not vary significantly, a slight difference was observed at 90 days (4.8% versus 4.5%, p=0.016).
6. Cases with 1- to 2-level vs. 3+-level fusion
When patients in the unmatched dataset were stratified by the number of fused levels, the physicianŌĆÖs fees were higher for patients who received BC implants than those who received SA implants with either 1- to 2-level or 3+-level fusion (Table 5). The 90-day complication rates were slightly higher for patients who underwent BC implantation with 1- to 2-level fusion (4.7% versus 4.3%, p=0.018). However, no differences in the total complication rates were noted for patients with 3+-level arthrodesis. Readmission rates were significantly higher for BC procedures with 1- to 2-level fusion but not for those with 3+-level fusion. After performing 1:1 nearest-neighbor PSM, the differences in physicianŌĆÖs fees reemerged (Table 6), although differences were no longer observed in postoperative complications or readmission rates after 1- to 2-level or 3+-level fusion. Only the significant difference in the 2-year reoperation rates remained, with 4.6% of the BC cohort with 1- to 2-level fusion undergoing a reoperation at 2 years, compared with 4.2% of the counterpart SA cohort (p=0.024).
Discussion
ACDF is one of the most common surgical interventions for cervical spine disorders, such as radiculopathy, myelopathy, and spondylosis [19,20]. Given the widespread use of the procedure, understanding the influence of variations in the procedural materials on postoperative outcomes and inpatient costs is critical.
The present study analyzed a large national inpatient database and applied statistical matching tools to characterize and compare complication, readmission, and reoperation rates between BC and SA ACDF surgeries. At baseline, patients who received BC were mostly older and female and had a higher comorbidity burden than recipients of SA. The patients who received BC were also more likely to have myelopathy or undergo a 3+-level fusion. Clinically, this cohort had slightly longer hospitalizations and higher readmission and reoperation rates. After matching patients across demographic variables, comorbidities, and operative characteristics, the BC cohort still had slightly higher postoperative readmission and reoperation rates, but the absolute magnitude of the differences was not significant. Additionally, no significant differences were observed in the average hospitalization duration or postoperative complication rate after PSM. Notably, the total inpatient costs remained markedly higher for patients who underwent BC surgeries, with almost all of the post-PSM differences due to higher payments to the principal physician. Taken together, the results suggest that patient-specific comorbidities partially contribute to diverging postoperative ACDF outcomes. However, after adjusting for group-level differences in comorbidity burden and demographic variables, BC and SA ACDF procedures showed relatively similar clinical outcomes, with roughly equivalent postoperative complication and short-term readmission rates, as well as marginally increased 2-year reoperation and 90-day readmission rates. PhysicianŌĆÖs fees, however, remained higher for BC than SA procedures, suggesting that reduced resource utilization is possible through a relative shift in the number of SA ACDF procedures.
While the present study presents an analysis of the largest cohort of index ACDF procedures, previous studies have used similar patient populations to assess differences in outcomes among BC and SA recipients. Single-institution retrospective studies by Krause et al. [14] and Teton et al. [21] showed higher pseudoarthrosis and revision rates for PEEK implants than SA implants for both single- and multilevel ACDF. Pirkle et al. [16] used the PearlDiver national database to identify 6,130 BC and SA ACDF cases. They also found higher nonunion rates for BC interventions, although the multivariate analysis was limited to only three explanatory variables. One year later and using data from the same database, Goz et al. [15] found clinically insignificant differences in postoperative complication and revision rates. More recently, Menon et al. [17] performed PSM between BC and SA patient cohorts in a cohort of 8,103 patients who underwent ACDF registered in the TriNetX database and found no differences in the rates of revision, pseudarthrosis, surgical site infection, or dysphagia at 1 year postoperatively for ACDF procedures with single-level fusion. However, they did find higher rates of revision surgery among BC recipients with multilevel fusion and a higher risk of dysphagia among SA recipients. Finally, Marrache et al. [18] assembled a cohort of nearly 27,000 patients with ACDF registered in the MarketScan database and found no difference in 90-day complications between BC and SA procedures but noted higher 2-year reoperation rates for BC. However, this study did not perform PSM and excluded procedures with multilevel fusion from the analysis.
The present study builds upon the existing literature by assembling a much larger patient cohort, including patients with single- and multilevel arthrodesis and aged >65 years, as well as performing PSM, to better match patients across groups than traditional multivariate analysis allows. Consistent with previous studies with smaller patient cohorts, we found clinically insignificant differences in overall complication, reoperation, and readmission rates for both single- and multilevel BC than single- and multilevel SA ACDF procedures. However, we did note increased risks for dysphagia and infection, as well as higher physicianŌĆÖs fees, in the BC cohort. Our findings suggest that BC procedures involve greater physician compensation, although not necessarily improved postoperative outcomes. Notably, however, the absolute difference in physician compensationŌĆöroughly $900ŌĆöwas not dramatic for procedures with 1- to 2-level fusion but was, conversely, more significant for procedures with 3+-level fusion at roughly $1,700. This is consistent with compensation practices in US healthcare. Presently, most payors will compensate a surgeon who uses a BC on a per level basis, whereas surgeons who use SA must bill only once regardless of the number of levels fused. While the payment structure could theoretically influence the surgeonŌĆÖs preference, other considerations, including patient-specific factors or institutional preferences, are almost certainly involved. Unfortunately, the retrospective claims database used in the present study did not contain the data to resolve these questions. Further inquiries into hospital contracting, implant costs, and charges will also aid in understanding true cost differences. The increased risk of dysphagia in the BC cohort may be due to difficulties in alignment and selection of the correct cage shape, which contrasts with the flexibility offered by SA [22,23]. Recently developed transoral atlantoaxial fusion cages potentially reduce alignment difficulties associated with BC [22]. The increased risk of infection in the BC cohort could arise from differences in operative time or existing minor infections that are worsened by glycocalyx formation on BC as a non-allogenic material, although this has not been elucidated [24].
Finally, although the 2-year reoperation rate for BC procedures with 1- to 2-level fusion was higher than that in the counterpart SA ACDF procedures, the absolute difference was not significant. Nonetheless, patients who underwent BC and SA with 3+-level fusion experienced far higher postoperative complication and readmission rates, which is consistent with previous ACDF analyses [25]. Patients whose pathology requires 3+-level cervical fusion continue to represent a complex patient population for the spine surgeon, and, given the high complication and revision rates for both BC and SA procedures, must be carefully counseled on the risks of surgical intervention. For these patients, negligible differences in reoperation or readmission rates were observed between BC and SA implants.
Despite these findings, our analysis has some limitations. First, analyzing a large dataset, such as that of the MarketScan database, has an inherent level of selection bias and lacks clinical details, specifically, spinal parameters and curve types, radiographic findings, detailed physical examinations, and more detailed long-term follow-up. We conducted PSM for important baseline variables to mitigate intergroup differences as much as possible, and the large size of our patient cohorts likely reduced the biasing effect of outlier datapoints or individual coding errors. However, the limited granularity of administrative codes remained an obstacle. For example, we were unable to determine the cage material (e.g., titantium versus PEEK) used in patients who underwent BC ACDF procedures. Second, we could not assess other important clinical outcomes, including the degree of patient functional recovery, postoperative pain, and pseudoarthrosis. Future prospective studies are needed to further investigate how BC and SA ACDF procedures impact these outcomes and how cage material may influence operative success. Third, the large dataset used in the present study generated several statistically significant differences between the BC and SA cohorts. However, the absolute magnitude of these differences is negligible, and their clinical significance cannot be definitively stated. Where appropriate, we have stated our opinions on the clinical significance of our findings, but the balance between statistical importance and clinical relevance was upheld.
Conclusions
Our analysis of the largest published database cohort of adult ACDF surgeries using statistical matching tools revealed marginal differences in clinical outcomes between BC and SA ACDF interventions. The results of this study suggest that patient-specific comorbidities partially contribute to diverging postoperative ACDF outcomes. However, after adjusting for group-level differences in comorbidity burden and demographics, BC ACDF and SA procedures have relatively similar clinical outcomes with roughly equivalent postoperative complication and short-term readmission rates, as well as marginally increased 2-year reoperation and 90-day readmission rates. PhysicianŌĆÖs fees, however, remained significantly higher for BC placement procedures.