Lumbar Spine Anatomy in Supine versus Weight-Bearing Magnetic Resonance Imaging: Detecting Significant Positional Changes and Testing Reliability of Quantification
Article information

Abstract
Study Design
Testing between and within group differences and assessing reliability of measurements.
Purpose
To study and compare lumbar spine morphology in supine and weight-bearing (WB) magnetic resonance imaging (MRI).
Overview of Literature
Upright lumbar MRI may uncover anatomical changes that may escape detection when using conventional supine imaging. This study quantified anatomical dimensions of the lumbar spine in the supine and WB MRI, compared specific morphometric differences between them, and tested the intra-rater reliability of the measurements. Repeated measures analysis was used to compare within- and between-session measurements performed on the supine and WB images. Reliability and agreement were assessed by calculating intraclass correlation (ICC) coefficient.
Methods
Data from 12 adults without any history of back pain were used in this study. Sagittal T2-weighted images of the lumbar spine were acquired in the supine and WB positions twice (in two separate sessions scheduled within a week). Linear, angular dimensions, and cross-sectional areas (CSAs) were measured using proprietary software. Supine and WB data acquired from the two imaging sessions were tested for intra-rater reliability. Quantified data were normalized for each session to test the significance of differences. ICC was calculated to test the reliability of the measurements.
Results
Linear, angular, and CSA measurements demonstrated strong within-position (supine and WB) correlations (r-values, 0.75–0.97). Between-position (supine vs. WB) differences were significant for all measured dimensions (p<0.05). Between-session measurements demonstrated a strong correlation (r-values, 0.64–0.83). Calculated ICC showed strong agreement among the measurements.
Conclusions
Anatomical dimensions of the lumbar spine may demonstrate consistent and significant differences between supine and WB MRI for specific structural parameters.
Introduction
Diagnostic magnetic resonance imaging (MRI) for low back pain (LBP) may not conclusively detect structural causes associated with the pain or dysfunction [1,2]. Studies have indicated that routine MRI, acquired in the supine position, could be inadequate or inconsistent in detecting structural changes causing mechanical or “nonspecific” back pain compared with imaging acquired in a weight-bearing (WB) position [3,4]. Conventional supine MRI used to diagnose LBP and spondylolisthetic segmental instability does not involve physiological weight bearing and may miss the detection of narrowing of the spinal canal, disks, and intervertebral foramina, as a cause of back pain, which could be identified upon imaging in WB positions [5,6]. Treatment decisions for disk herniation, canal stenosis, and intervertebral foramen narrowing are made based on clinical evaluation, which is supplemented by related radiological assessment. Accordingly, the effects of WB on diagnostic imaging may warrant further investigation [7,8].
Although WB MRI is not yet a standard for the diagnostic evaluation of LBP or listhetic segmental instability, instrumented spine loading in the supine and WB (sitting and standing) positions has been documented in experimental and diagnostic imaging studies [9–13]. Because MRI acquisition usually takes longer than X-ray techniques, MRI protocols could be physically challenging for patients with concurrent back pain. In contrast, spinal soft tissues are best visualized using MRI, and WB MRI has been demonstrated to be critical in detecting structural causes of LBP that may slip detection with imaging in the supine position [9–11]. Although some studies have examined the ability of positional MRI to uncover anomalous spine anatomy in patients with symptomatic lumbar stenosis, normative data comparing supine and WB lumbar spine anatomy in healthy individuals are limited, particularly in terms of back pain literature. Additionally, although positional MRI data comparing physiological effects of spine loading in healthy individuals are limited from single-session studies, tests for intra-rater reliability and statistical comparisons between positional data from multiple sessions are not readily available in the literature [8–12]. Our study used open WB MRI for lumbar spine imaging in a cohort of healthy participants (1) to detect the specific dimensions of the spine affected by positional changes in imaging, (2) to test whether WB induced significant changes in these dimensions between the imaging positions, and (3) to evaluate the consistency of the within- and between-positional measurements for the detected dimensions.
Materials and Methods
This descriptive imaging study included a cohort of healthy participants to quantify morphometric changes in their lumbar spines induced by WB by comparing specific dimensions in supine versus WB MRI images. Additionally, we assessed the statistical significance of positional changes following WB and evaluated the consistency of our measurements using intra-rater reliability testing [13]. Imaging was performed in two separate sessions; each session involved imaging once in the WB position and once in the supine position.
1. Participant selection
In this study, 13 volunteers aged 18–60 years (mean: 38±12 years; seven females and six males) participated. The exclusion criteria were as follows: individuals who reported LBP with a ≥1 on the numeric pain rating scale, those with a history of spinal surgery, those with any orthopedic or neurological impairment, those with cancer or tumors, those with cardiopulmonary disorders, those with clinical depression, and those who were taking medications or supplements for LBP. General compatibility for MRI was assessed; subjects with a body mass index (BMI) >32 kg/m2 or those with any physical limitations that impaired their ability to stand inside an open MRI system were excluded. Visit 1 included study orientation and subject consent. Visits 2 and 3 were scheduled 1 week apart at the university MRI facility [14]. One male participant dropped out of the study for personal reasons. Because of the relatively younger age of the study participants, none of the images showed any age-related degenerative changes that may have affected the anatomical parameters measured, except for two participants, who showed some evidence of age-related degeneration at their L3–L4 and lumbosacral levels. Informed consent was obtained from all individual participants included in the study. The Institutional Review Board approved the study protocol (IRB #16-F-13), and all subjects gave written informed consent.
2. Imaging protocol
Scout images were obtained iso-centered at the L3–L4 intervertebral disks after the participants were secured in the supine position on the MRI table. The height of the footrest was adjusted and recorded in the supine position before the table was slowly rotated to 87° vertical (as specified by the machine-operating protocol to prevent fall) to the ground, as the participants eased into a WB position with their feet shoulder-width apart. The participants were comfortably secured above the knee and at the pelvis using cushioned straps to help them maintain an upright position during imaging. All images were acquired using an open-field magnet (0.25 T) G Scan Brio WB MRI (Esaote S.p.A., Genova, Italy) in an upright position. Next, the participants were placed in the supine position by tilting the table back to the horizontal plane. They laid supine and rested for 5 minutes to relax their spine before the initiation of image acquisition in the supine position. Sagittal MR images of the lumbar spine (L1–S1) were acquired in both positions using a fast spin-echo T2 sequence (TR=3,520 ms; TE=125 ms; number of acquisitions=1; matrix=288×234; FOV=320×320; oversampling=185%; slice thickness=4 mm; gap=1 mm; acquisition time=4 minutes 41 seconds). The scanning time and sequences we followed have been described in earlier studies reporting <5 minutes of scan time at each position [15]. Typically, each participant spent approximately 45 minutes per session, which included positioning, tilting, image acquisition, and resting time. The height of the standing platform, positions of the cushion straps, and the lumbar coil placements were measured for each participant to be replicated in the subsequent imaging sessions.
3. Image analysis
All Digital Imaging and Communications in Medicine images were transferred to a proprietary image analysis platform (OrthoCAD; Esaote S.p.A.). The borders of the lumbar spine, first sacral vertebral bodies, spinal canal, and vertebral foramina were manually outlined on the image slices using the software. Images were then segmented and digitized using proprietary three-dimensional (3D) segmentation software (OrthoCAD) to quantify anatomical dimensions. The first author (N.K.M.) used semiautomated segmentation and measurement tools available in the software to quantify all dimensions presented in this study (Fig. 1). Additionally, a single observer used ImageJ (National Institutes of Health, Bethesda, MD, USA; Imagej.nih.gov/ij/docs/faqs.html) to verify the linear dimensions measured in the images.
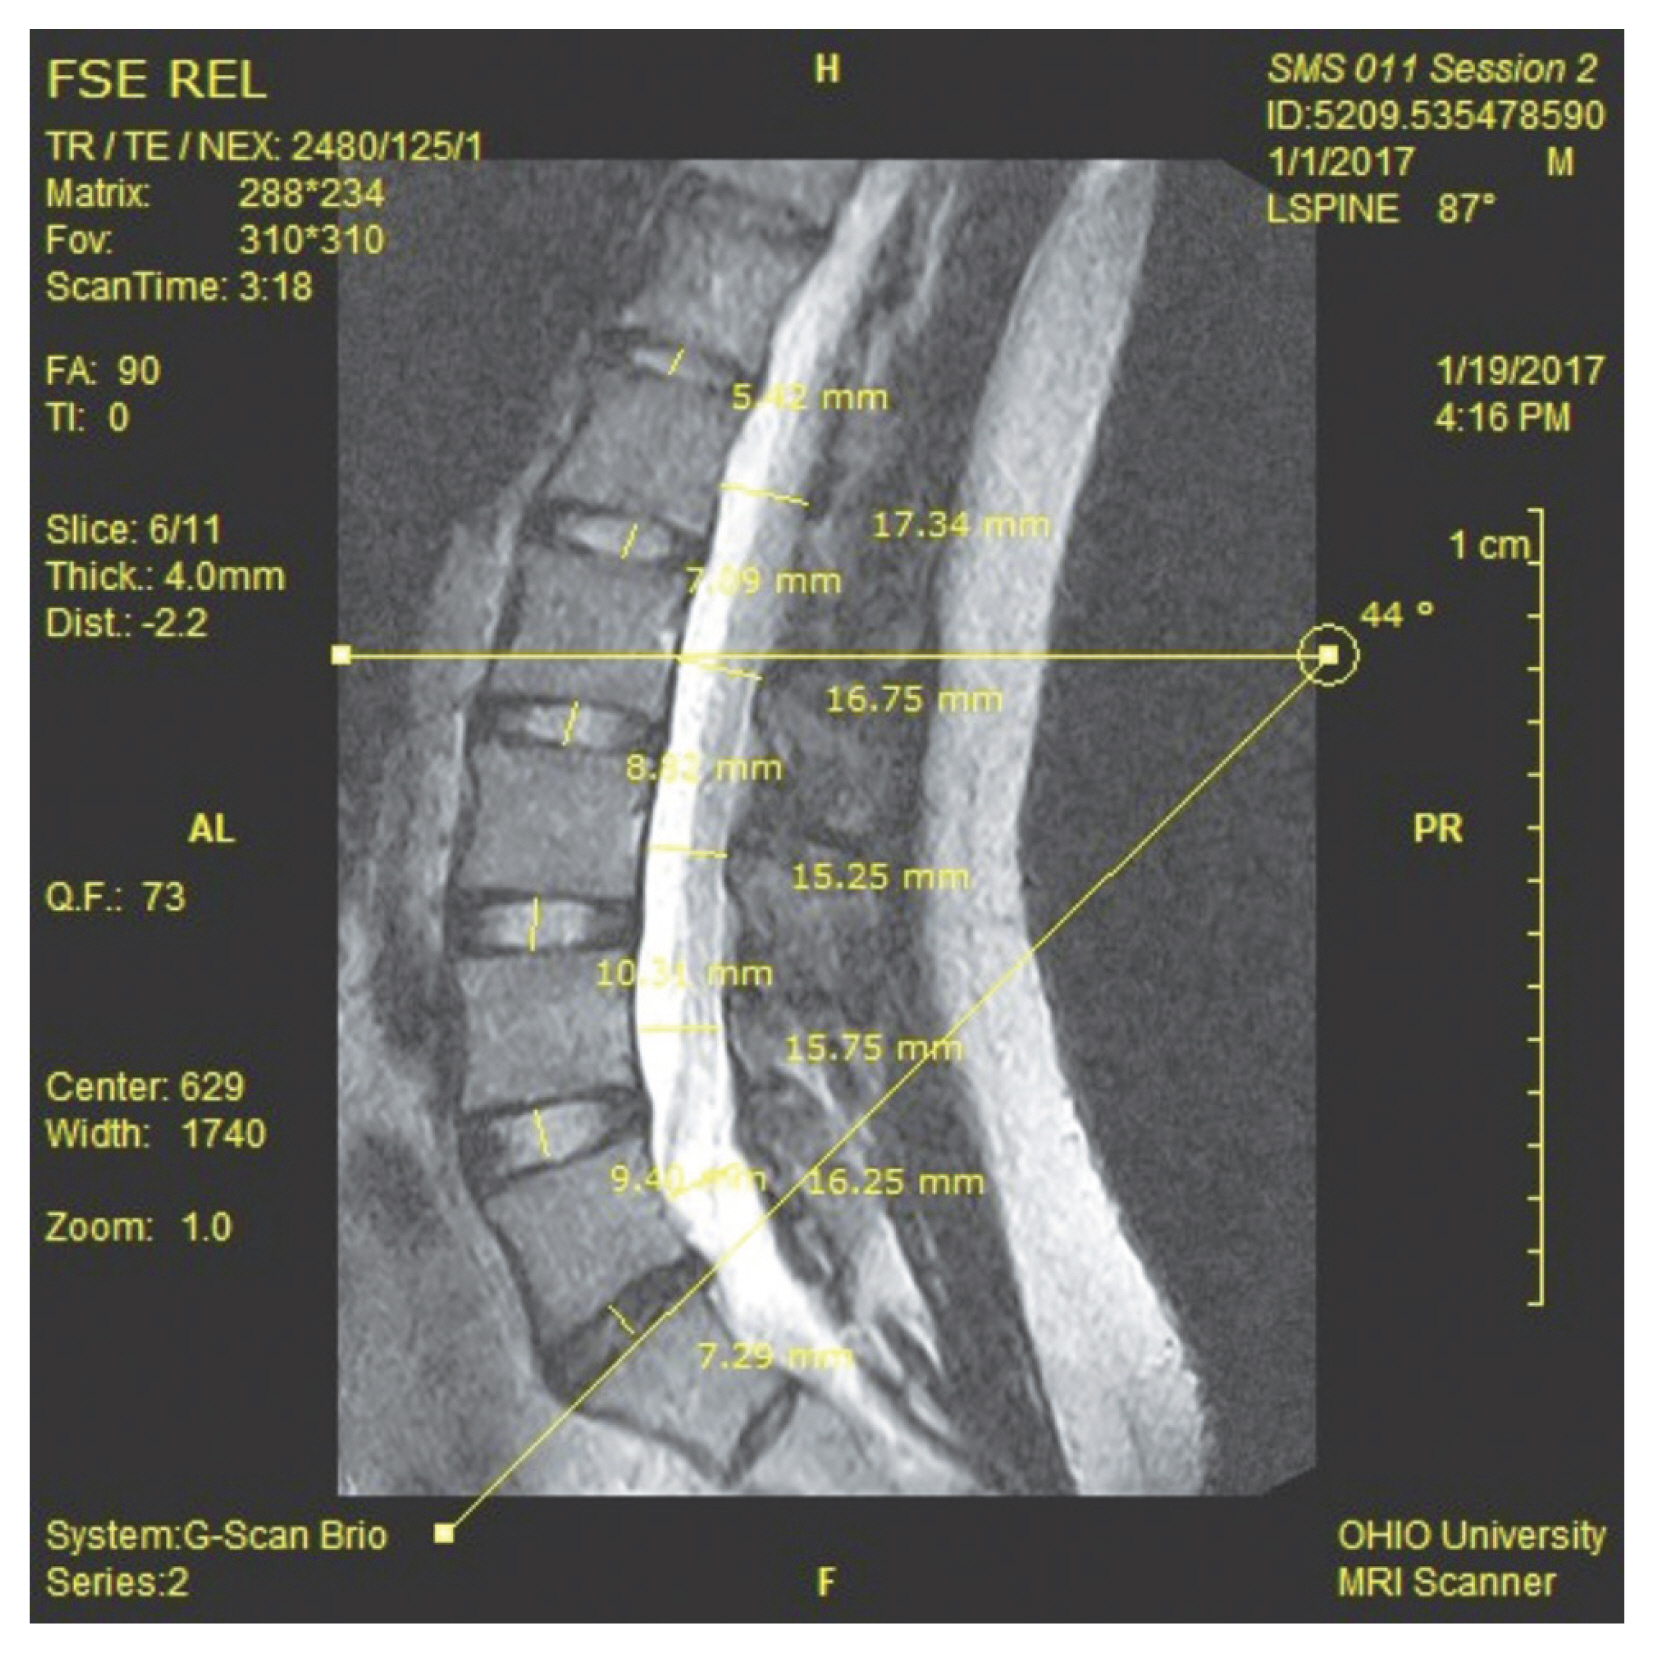
Mid-sagittal lumbar spine T2-weighted image showing the sacral angle, disc heights, and mid zonal spinal canal dimensions as demarcated by the proprietary software tool OrthoCAD.
4. Measurement variables
Linear dimensions (in millimeters) were measured as follows: Sagittal dimensions of the spinal canal were measured as the minimal available space at the vertebral junctional areas, referred to as zones (Fig. 1). Disk heights were measured in the mid-intervertebral spaces. Foraminal heights were measured at the narrowest portions along the intervertebral openings. All segmental and intersegmental angles (in degrees) were measured in the sagittal plane using the endplates superior to the concerned vertebrae. The foramen cross-sectional area (CSA) (in square millimeters) at each level was measured at the narrowest available point along image slices capturing the intervertebral foramen. Slice positions and imaging parameters in the protocol were kept consistent between the two sessions.
5. Statistical analysis
Supine and WB measurements obtained from the two sessions were tested separately for correlation using Pearson’s correlation coefficient. Within-session differences between supine and WB images were tested for statistical significance using a two-tailed paired Student t-test. Considering potential changes in magnification and minor variability associated with participant positioning within the scanner in the two imaging sessions, the differences calculated between the supine and WB images were normalized for each session. This was performed by subtracting the supine measurements from the WB measurements and then dividing that value by the WB measurement (at each level) to obtain an absolute value for the dimension: [(Supine-WB)/WB]. Correlations between normalized differences between the two sessions were determined using Pearson’s correlation coefficient. Additionally, factorial repeated measured analysis of variance (ANOVA) (without replication; 2 positions×2 sessions), followed by multiple post-hoc comparisons (Tukey’s test), was performed to determine the statistical significance of differences in each dimension across images between both positions and both imaging sessions. The intra-rater reliability of the measurements was evaluated by computing the intraclass correlation coefficients (ICC) of all measurement variables for the two sessions and two scanning positions (IBM SPSS Statistics for Windows, ver. 24.0; IBM Corp., Armonk, NY, USA).
Results
1. Linear dimensions
1) Spinal canal dimensions
Zones increased with WB (Fig. 2). Our findings showed that this increase was proportional to the initial dimensions measured across each zone in the supine position. We observed a strong correlation and intra-rater reliability for measurements acquired in the supine and WB positions (r=0.89 and 0.96, respectively) (Table 1). Furthermore, between-session normalized differences at the five zones were strongly correlated, indicating consistency in detecting supine versus WB changes (r=0.83). Additionally, differences in sagittal dimensions between the supine and WB positions were statistically significant in both sessions (F [3,59]=6.61; p<0.01). The spinal canal dimensions showed an increase at all levels from the supine position to the WB position. The change percentages observed were as follows: L1–L2=11.35%, L2–L3=10.18%, L3–L4=3.21%, L4–L5=8.93%, and L5–S1=12.56%.
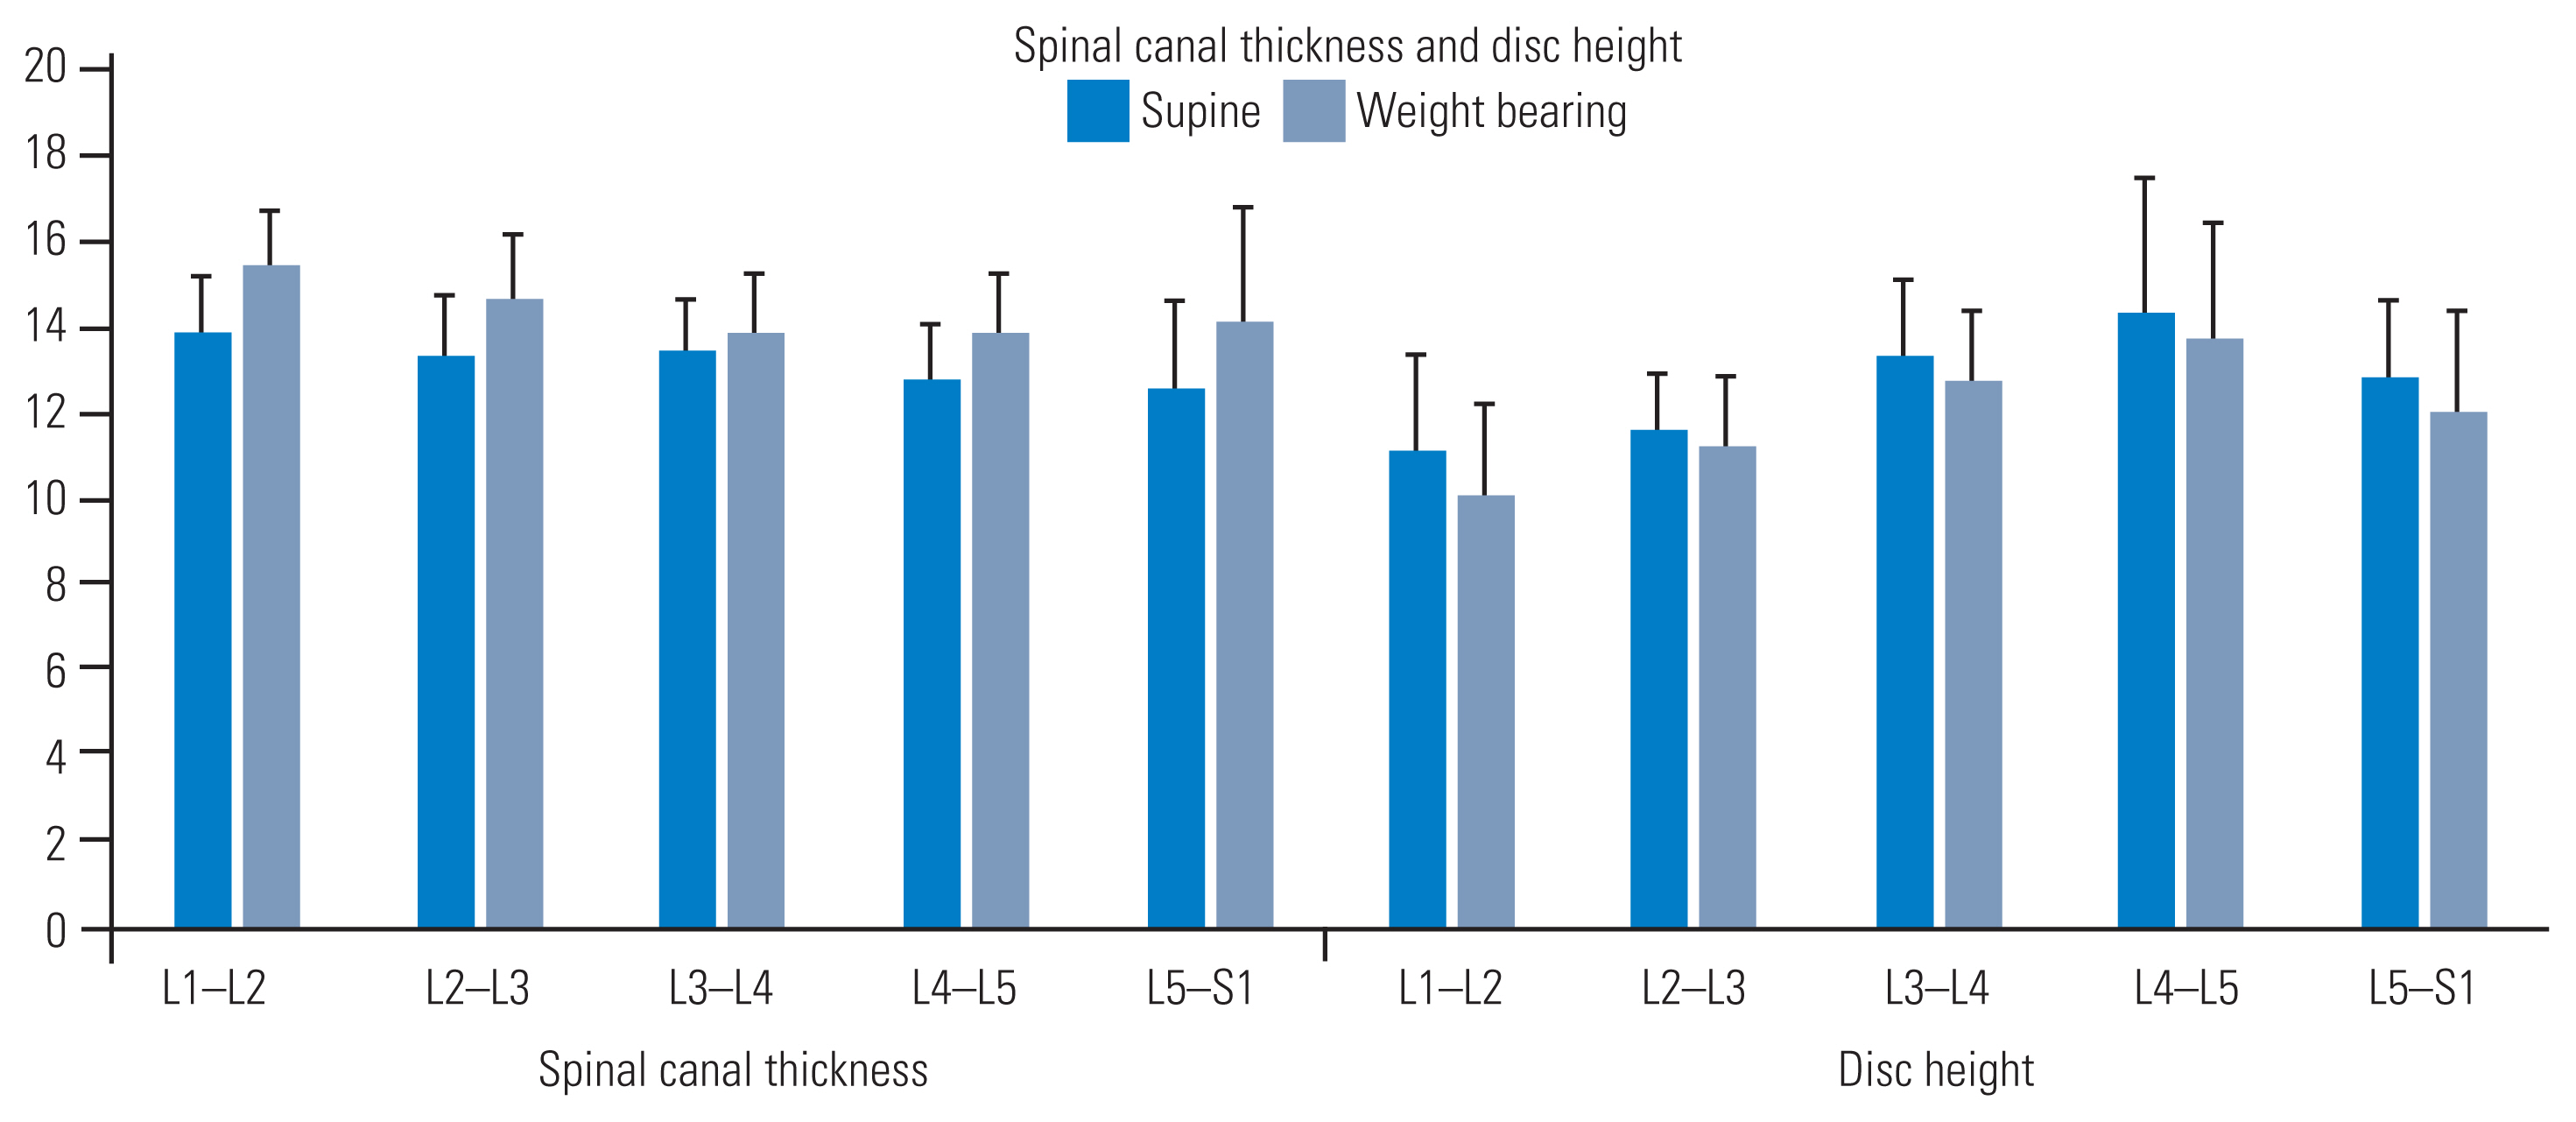
Spinal canal dimensions and disc heights (in millimeters) measured by supine and weight-bearing imaging. All parameters returned significant values when comparing the two imaging positions (p<0.05).
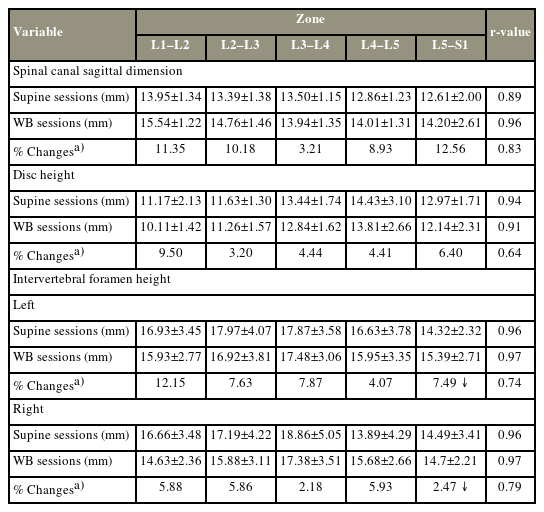
Descriptive statistics of linear dimensions measured in images acquired with supine and WB positions in two separate sessions
2) Disk heights
Disk heights (mm) were reduced with WB (Fig. 2). Decreases in this dimension corresponded proportionally to the initial heights at each level in the supine position [15]. We detected a strong correlation and intra-rater reliability in the measurements acquired in the supine and WB positions (r=0.94 and 0.91, respectively) (Table 1). A moderate correlation was detected in the between-session normalized differences in disk heights at all five intervertebral levels, indicating consistency in detecting supine versus WB changes (r=0.64). Differences in disk heights between the supine and WB positions were statistically significant for both sessions (F [3,59]=23.34; p<0.01). The disk heights decreased at all levels from the supine position to the WB position. The change percentages observed were as follows: L1–L2=9.50%, L2–L3=3.20%, L3–L4=4.44%, L4–L5=4.41%, and L5–S1=6.40%.
3) Foraminal heights
Foraminal heights (mm) were bilaterally reduced with WB, except at the L5–S1 junctions, where the foramina appeared to slightly enlarge. Analysis revealed a strong correlation and intra-rater reliability in the measurements acquired in the supine and WB positions bilaterally (r=0.96 and 0.97, respectively) (Table 1). The between-session normalized differences in foraminal heights were strongly correlated at all five intervertebral levels, indicating consistency in detecting supine versus WB changes (right: r=0.79; left: r=0.74). The differences in foraminal heights between the supine and WB positions were statistically significant in both sessions (F [3,59]=20.75; p<0.01). The intra-rater reliability of the measurements was ≥75% for each session and each scan position. All foraminal heights showed an increase at all levels, on both sides, from the supine position to the WB position, except for L5–S1, which showed a decrease bilaterally. The change percentages observed on both sides were as follows: right: L1–L2=12.15%, L2–L3=7.63%, L3–L4=7.87%, L4–L5=4.07%, and L5–S1=7.49%; left: L1–L2=5.88%, L2–L3=5.86%, L3–L4=2.18%, L4–L5=5.93%, and L5–S1=1.47%.
2. Angular dimensions: segmental angles
Segmental angles increased with WB. In our findings, the angles increased caudally and were proportionate to the magnitude of the baseline angles measured in the supine position. However, the lumbosacral angle was reduced with WB (21.96°±4.55° versus 20.79°±4.99°). Among the intersegmental angles, the lordosis (L1–S1), sacral (horizontal–S1), lumbar (L1–L5), and lower lordosis (L3–L5) angles were the largest to the smallest in the supine position (Fig. 3). These angles increased with WB, with the highest increase observed in the lumbar angle (L1–L5) and the lowest increase observed in the sacral angle (horizontal–S1) while standing. The measurements acquired in the supine and WB positions exhibited a strong correlation and intra-rater reliability (r=0.91 and 0.97, respectively) (Tables 2, 3). A moderately strong correlation was detected for normalized differences in between-session segmental angular data, indicating consistency in detecting supine versus WB alterations (r=0.74). Angular parameters were significantly different between the supine and WB positions in both sessions (F [3,59]=72.16; p<0.01). The intra-rater reliability of the measurements was ≥75% for each session and each scan position. All angular dimensions decreased at all levels from the supine position to the WB position, except for the L5–S1 intervertebral segmental angle, which increased. The change percentages observed were as follows: intervertebral segmental angles: L1–L2=57.50%, L2–L3=41.60%, L3–L4=54.14%, L4–L5=20.32%, L5–S1=6.45%; L3–L5 angle=23.86%; L1–L5 angle=39.29%; sacral angle horizontal–S1=6.07%; and L1–S1 angle=18.18%.
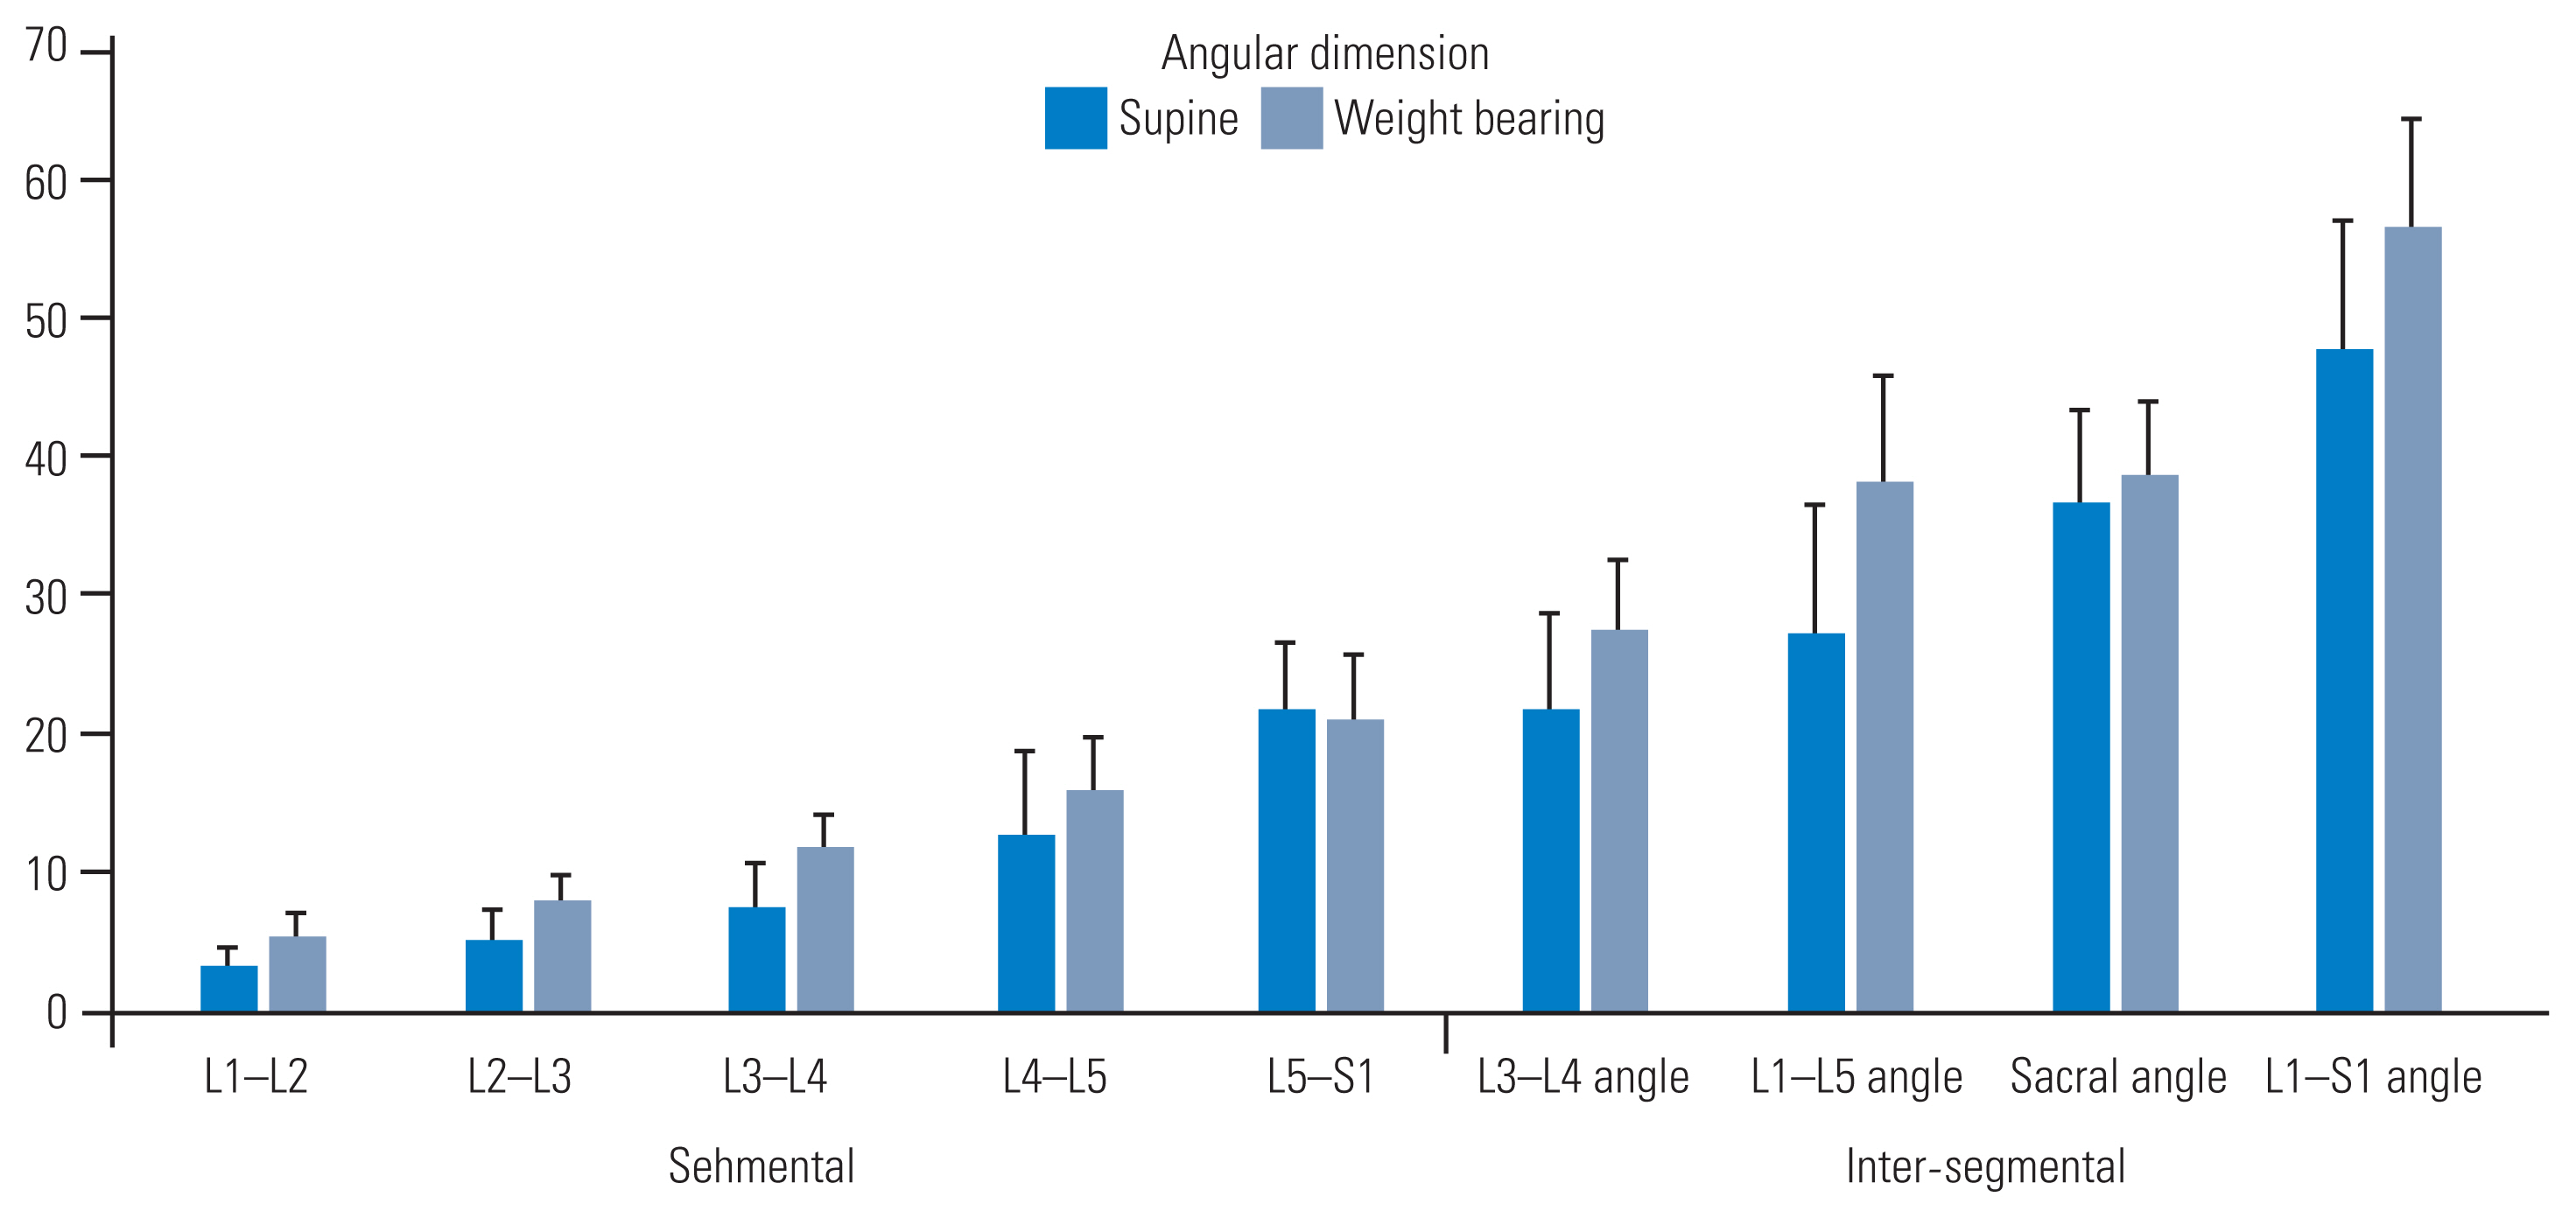
Segmental and inter-segmental angles (in degrees) measured by supine and weight-bearing imaging. All parameters returned significant values when comparing the two imaging positions (p<0.05).

Descriptive statistics of angular dimensions measured in images acquired in supine and WB positions in two separate sessions

Descriptive statistics of angular dimensions measured in images acquired in supine and WB positions in two separate sessions
3. Intervertebral foraminal CSA
Foraminal CSAs (mm2) decreased with WB, except at the lumbosacral junction (L5–S1), which consistently increased bilaterally (left: 124.85±16.16 versus 125.20±13.22; right: 114.35±129.32 versus 122.26±13.22, respectively) (Fig. 4). Increased CSA was also noted at the mid-lumbar level (L3–L4) on the right side. A strong correlation and intra-rater reliability were observed in the CSAs acquired in the supine and WB positions (left: r=0.87 and 0.97; right: r=0.92 and 0.97, respectively) (Table 4). Furthermore, a strong correlation between the normalized differences from the two sessions was detected at all five levels, indicating consistency in measuring changes induced by WB (left: r=0.68; right: r=0.74). Foraminal CSAs significantly differed between the supine and WB positions in both sessions (F [3,59]=5.59; p<0.01). The intra-rater reliability of the measurements was ≥75% for each session and each scan position. The ICC showed high values of agreement for all dimensions (measured by sessions and scanning positions) calculated as inter-rater reliability using absolute agreement and a two-way random model (Table 5). All intervertebral foraminal CSAs increased at all levels, on both sides, from the supine position to the WB position, except for the L5–S1 level, which decreased bilaterally. The change percentages observed on both sides were as follows: right: L1–L2=8.13%, L2–L3=4.76%, L3–L4=4.38%, L4–L5=5.90%, L5–S1=0.28%; left: L1–L2=5.86%, L2–L3=2.10%, L3–L4=2.16%, L4–L5=1.24%, and L5–S1=6.92%.
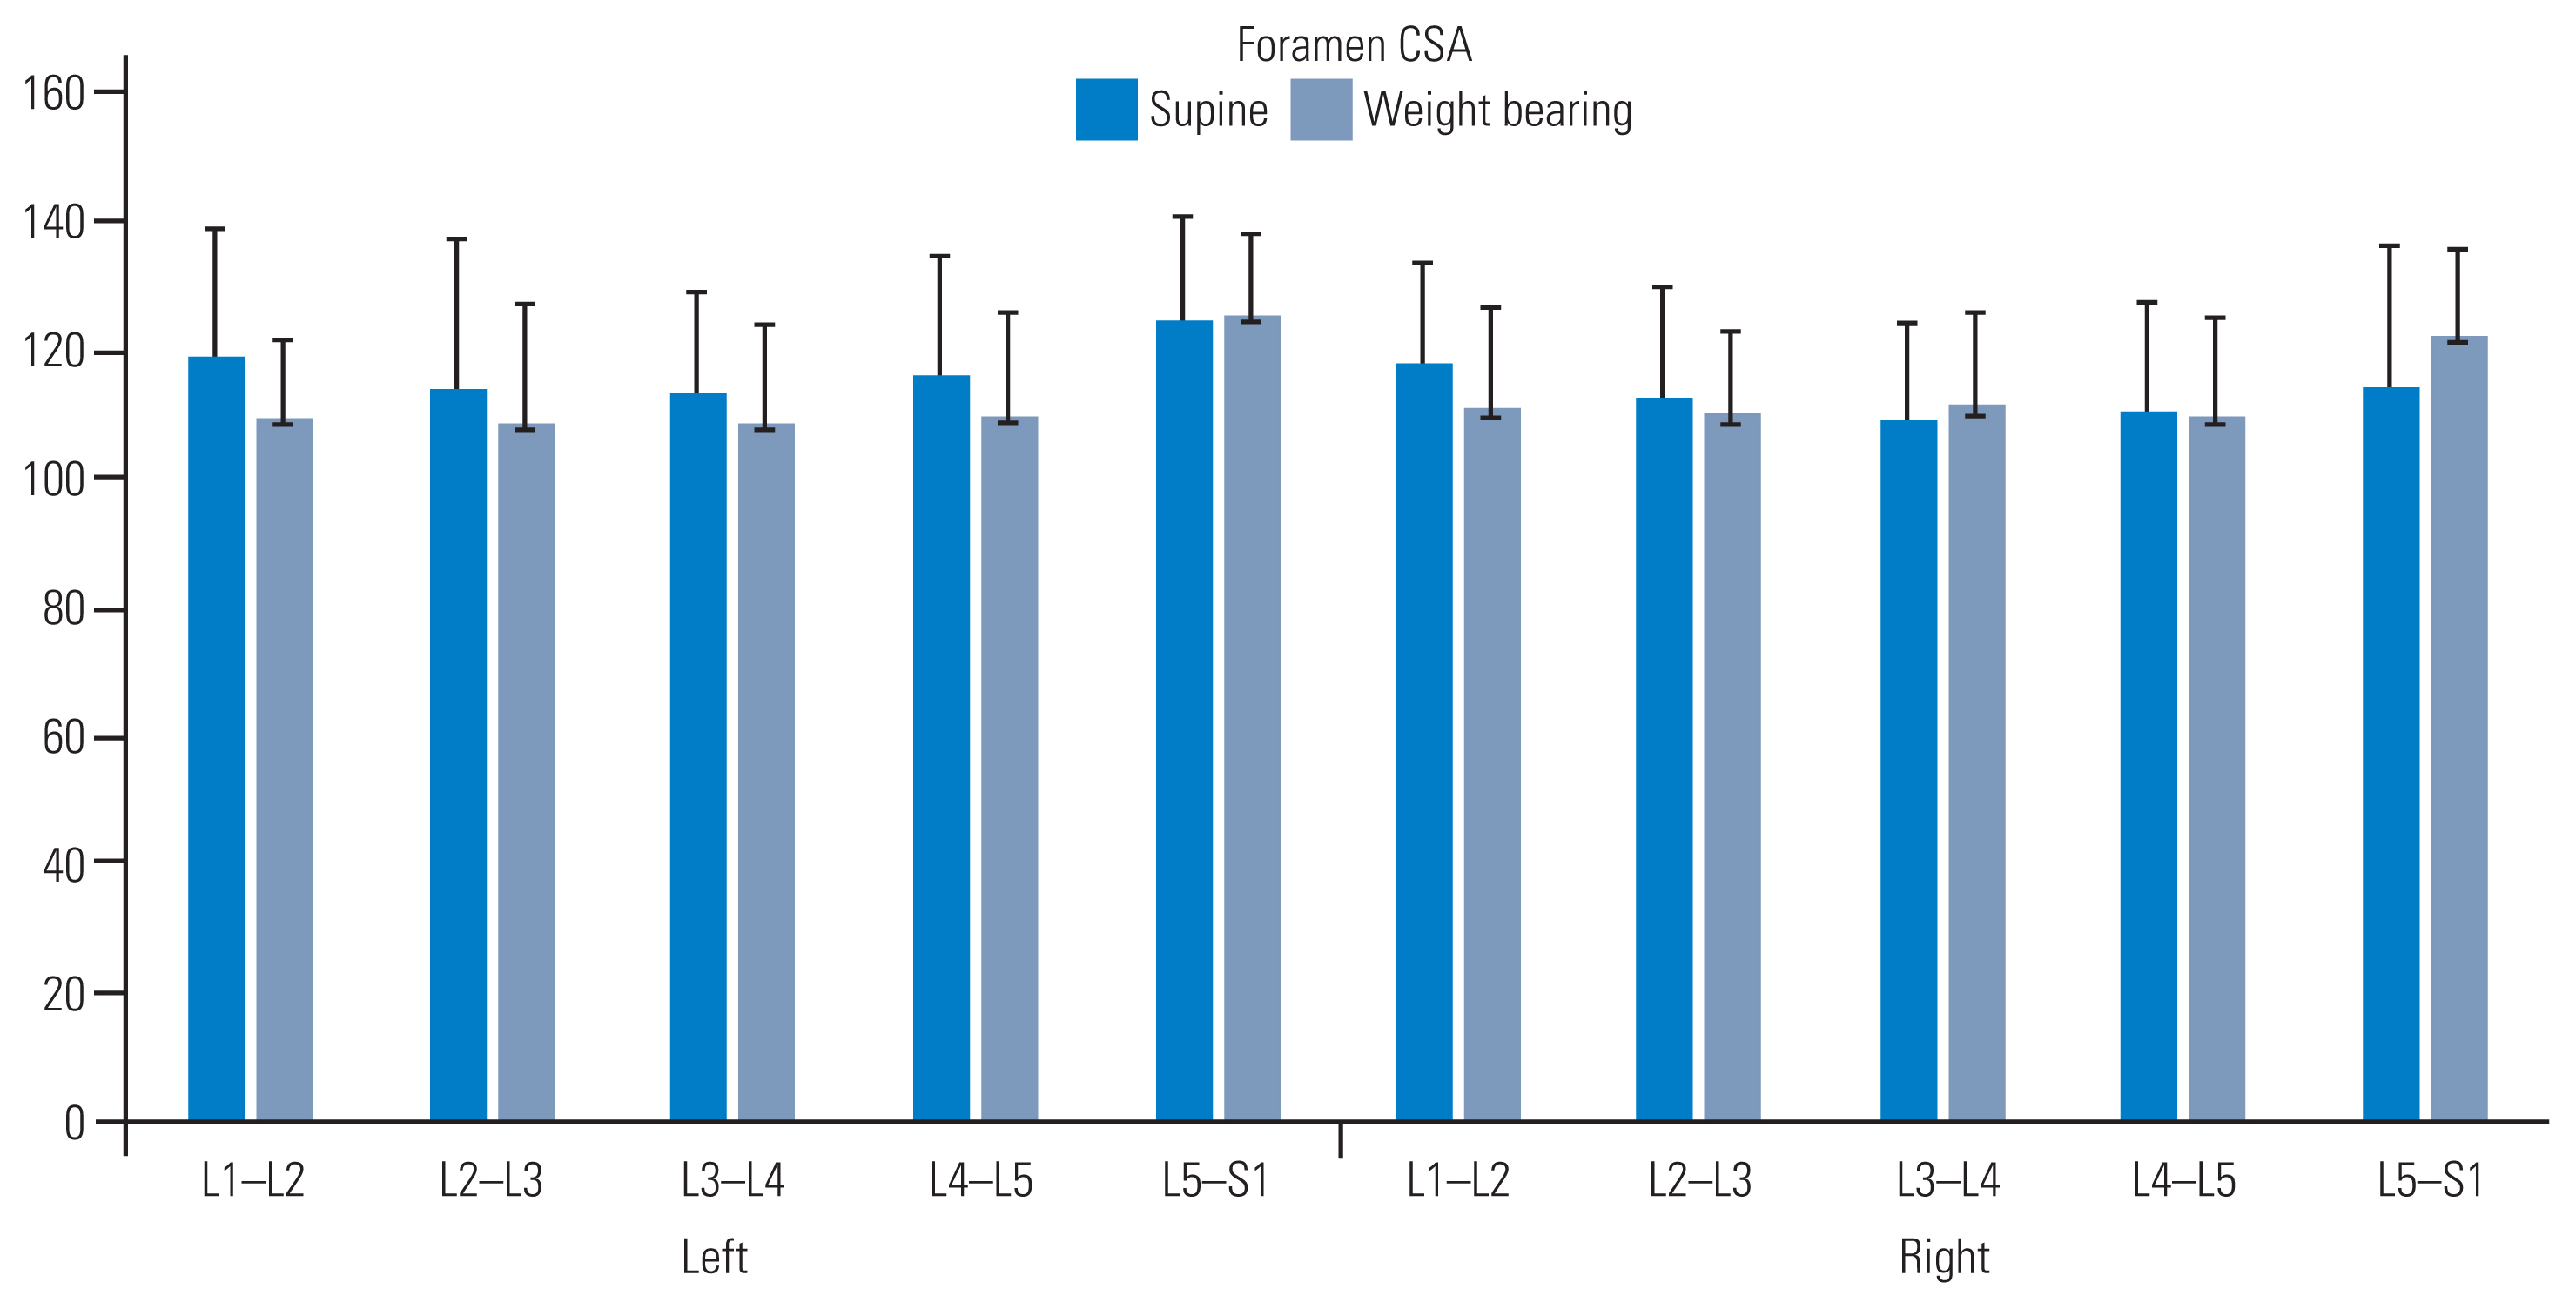
Intervertebral foramen cross-sectional areas (CSAs) measured by supine and weight-bearing imaging. All parameters returned significant values when comparing the two imaging positions (p<0.05).
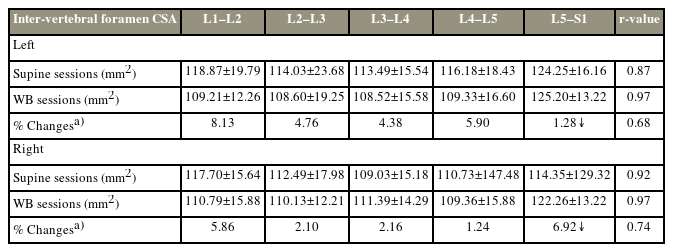
Descriptive statistics of CSAs measured in images acquired in the supine and WB positions in two separate sessions

ICC calculated for measured variables by sessions and by scanning positions
Only one pairwise Tukey honestly significant difference comparison (i.e., foraminal height) between the supine and WB positions was significant (p<0.01); all other comparisons were insignificant. This result is expected considering that the pairs of the compared segmental means (two supine and two WB) remained clustered together. All positional comparisons tested (and presented) returned significant p-values (p<0.05) when assessed using paired Student t-test; this result was supported by the significant ANOVA F statistic, as reported above.
Discussion
This study assessed (1) specific dimensions that demonstrated morphometric shifts between the two positions of imaging, (2) the reliability of measurements on lumbar spine images between two loading positions and across two imaging sessions, and (3) the statistical significance of the anatomical changes observed between the supine and WB positions.
Increases in the sagittal dimensions observed at the vertebral junctional zones within the spinal canal may have occurred because of dynamic alterations in intra- and intersegmental changes in the vertebral angles, increased apposition of the zygapophyseal joints, and bulging of the interlaminar ligament system with WB, as reported in the literature [16,17]. Such dynamic effects on the lumbar spinal canal with axially loaded spine observed with computed tomography–myelography and MRI in patients with sciatica have been reported and agree to the findings of this study involving asymptomatic individuals [6,11]. These increments could also reflect increasing curvature of the lumbar spine, particularly at the thoracolumbar and lumbosacral junctions with the upright spine [18–21]. Reductions in disk heights reflect axial loading, though the reductions are not proportionately as large as reported in some earlier studies [22–24]. In this study, disk heights were measured at the mid-intervertebral spaces to detect changes at the level of the centrally placed nucleus. With upright WB, compression of the peripheral annulus may stabilize or even increase the height of the centrally located disk nucleus. Disk heights were reduced at the L1–L2 junction. Additionally, although earlier studies have reported Modic I changes to increase in size from the supine position to the standing position with MRI studies that correlated with an increase in pain intensity in the standing position, this study further substantiates the evidence that WB may uncover the “biomechanical stress” and “active discopathy” theories in LBP, as suggested by the authors [15].
Intervertebral foraminal heights decreased upon standing, possibly due to compressive loading at the posterior vertebral elements from the accentuation of the overall lumbar curvature, reduction of peripheral disk heights, or increased anterior angulation at segmental endplates [19]. This aligns with the observation that forward flexion facilitates foraminal widening by reducing posterior element stress, increasing the vertical dimension of the foramen [22–24]. Accordingly, forward flexion of the lumbar spine often mechanically reduces pain resulting from foraminal and spinal canal narrowing [25–27]. Interestingly, the L5–S1 foramina marginally increased in this dimension on WB, possibly due to a greater increase in the sacral angle upon standing. The relatively coronal orientation of the facet joints at this level may serve as struts that not only prevented the L5 listhesis at this junction but also acted as a fulcrum to help increase the L5–S1 angle, thereby “opening up” the foramen dimensions [20–22]. Interestingly, some studies have reported comparable changes in the intervertebral foraminal spaces as effects of axially loaded MRI of the lumbar spine on dural sac and lateral recesses [16].
All segmental and intersegmental angles in the sagittal plane increased with different magnitudes with WB. However, the overall L5–S1 angle slightly decreased (with greater variance). Nonetheless, all other angles related to the S1 endplate, including the lordosis and sacral angles, significantly increased with the upright position [23,24]. Further investigation is required to detect whether lumbar spine curvature variability is associated with overall changes in the spinal canal or intervertebral foraminal dimensions in individuals with back pain upon WB [25]. Interestingly, foraminal CSAs demonstrated changes due to alterations in disk and foraminal heights on WB. However, the lumbosacral foramina marginally increased bilaterally in CSA on WB. Thus, unlike the rest of the cranially located foramina, the L5–S1 foramina widened on standing, with a concomitant increase in CSA and height. Intuitively, one may assume that although the vertical foraminal heights reduce on WB, the available anteroposterior space in these foramina may increase, thereby preventing critical narrowing of the passage [26]. However, this study indicates that the corresponding CSAs at the L1–L4 foramina also decrease with standing. Notwithstanding, the lumbar intervertebral foramina are tubular spaces that are directed somewhat posterolaterally (not strictly in the coronal plane). Therefore, any change in the dimension perpendicular to the plane of the sagittal image may remain undetected and could prevent the detection of an increase in the foraminal dimension in that plane [27]. The CSA at the lumbosacral (L5–S1) foramen marginally increased bilaterally, as did its vertical dimensions. This increase may be due to the significant angular increases associated with the S1 endplate on WB. Because narrowing of the foramina is pathologically related to nerve compression and sciatica, changes in all foraminal CSAs on WB could yield clinically valuable information [25,28].
This study has some limitations. First, none of the study participants had chronic or acute back pain episodes, and all individuals were within a specific BMI range. Thus, we assume that the observed anatomical changes were within physiological limits and represent the effects of normal WB in the upright position. Second, the disk hydration status was not objectively accounted for every imaging session in terms of its potential effects on the disk height measurements. The disk height changes reported in this study were discussed as changes that incurred with gravitational load bearing only. Some changes related to disk hydration may have impacted the variability of data reported in this study. Lastly, although the scan time in the upright position was kept to the minimal mainly to acquire sagittal images and very few axial images for comparison, shortening the scan time further in the protocol may help include participants with back pain in such studies in the future. Comparisons could also be improved by generating a 3D rendition of the images and measuring additional parameters in multiaxial planes. Examining specific anatomical dimensions that change in the WB position could be critical in identifying specific structural causes of LBP and lumbar instability, for example, markers that may remain undetected on supine MRI [23]. Despite the relatively lower sample size, the number of images examined could delineate (normality of distributions, statistical significance within the assigned alpha levels) differences in the anatomical parameters measured in the study.
Images acquired from the relatively low-strength 0.25T MRI machine could provide adequate resolution to allow accurate and consistent measurements. The equipment is approved for clinical usage and comes with validated measurement software for use in clinical research and practice. Measurements of the anatomical changes presented in this study may help contextualize the importance of WB MRI in detecting potential anatomical changes that may be etiologically associated with back pain and spine instability. These changes may otherwise remain undetected with routine supine imaging. Though longer MRI protocols may be challenging for individuals with concurrent back pain, WB imaging could still be useful in detecting diagnostically valuable anatomical changes in the lumbar spine where indicated [29,30].
Conclusions
WB imaging may improve detection of changes in the lumbar spine anatomy compared with supine MRI. As a future step, findings from this study could be further corroborated in individuals with back pain to assess the validity of assessment in the context of specific dimensions (concerning spinal canal, disks, and intervertebral foramina) that may be pathologically related to back pain.
Notes
Conflict of Interest
No potential conflict of interest relevant to this article was reported.
Author Contributions
Conceptualization: NKM, BCC; data curation: NKM, BCC; formal analysis: NKM, BCC; funding acquisition: NA; methodology: NKM, BCC, PM; project administration: BCC, NKM; visualization: NKM; writing–original draft: NKM, BCC; writing–review & editing: NKM, BCC, PM; final approval of the manuscript: all authors.