Bone Mineral Density and Physical Performance of Female Patients 27 Years or Longer after Surgery for Adolescent Idiopathic Scoliosis
Article information
Abstract
Study Design
Retrospective cohort study.
Purpose
To assess bone mineral density (BMD) and bone metabolism ≥27 years after surgery in female patients who underwent spinal fusion for adolescent idiopathic scoliosis (AIS) during adolescence and to determine their associations with physical performance.
Overview of Literature
There are no studies investigating postsurgical BMD in middle-aged AIS patients.
Methods
This study included 23 patients who provided informed consent among 229 female patients with AIS who underwent spinal fusion from 1968 until 1988. Average age at the time of observation was 48.8 years. BMD was measured at the left femoral neck, and the levels of two bone metabolism markers–procollagen type 1 N-terminal propeptide (P1NP) and tartrate-resistant acid phosphatase 5b (TRACP-5b)–were measured from blood samples. Physical performance was measured using grip strength, sit-ups, sit-and-reach, side step, and standing long jump.
Results
Mean BMD was 0.784 g/cm2. According to the World Health Organization diagnostic criteria, one subject (4.3%) had osteoporosis, whereas nine subjects (39.1%) had osteopenia. In patients with osteoporosis or osteopenia, P1NP and TRACP-5b levels were high, and BMD loss was because of high metabolic turnover. All calculated standard scores for physical performance were lower in the study cohort than in healthy individuals. There was a positive correlation between BMD and the standard score for grip strength, whereas there were weak positive correlations between BMD and the standard scores for side step and standing long jump.
Conclusions
In female AIS patients who underwent spinal fusion in adolescence, 4.3% and 39.1% had osteoporosis and osteopenia, respectively, ≥27 years after surgery. Exercise performance of these patients was poor compared with the national standards. In these patients, increased physical activity should be encouraged to prevent BMD loss in middle age.
Introduction
As patients with adolescent idiopathic scoliosis (AIS) undergo surgery in their teens, one important concern remains whether long-term health can be sustained. Thus far, several studies examined health-related quality of life as well as other health-related issues such as lower back pain and respiratory function [1234]. However, to date, there are no reports examining postsurgical bone mineral density (BMD) in AIS patients.
Osteoporosis that begins in middle age is a major concern in the elderly. Especially in females, several factors, including aging, declining estrogen levels, low body weight and body mass index, family history of osteoporosis, and smoking, are known risk factors for low BMD [5]. Furthermore, several reports demonstrated that BMD was associated with physical performance and activity [67].
The aims of this study were to assess BMD and bone metabolism ≥27 years after surgery in female patients who underwent spinal fusion for AIS during adolescence and to determine their associations with physical performance.
Materials and Methods
The institutional review board approved the present study. Initial study cohort included 229 female patients with AIS who underwent spinal fusion from 1968 to 1988. The inclusion criteria were (1) AIS, (2) female patients who underwent spinal fusion, (3) age <20 years at the time of surgery, and (4) a minimum postsurgical period of 27 years. The exclusion criteria were (1) neuromuscular disease, (2) syndromic scoliosis, and (3) congenital scoliosis. A survey was conducted in these 229 subjects by postal mail, and patients who provided informed consent underwent evaluation. As a result, 119 patients with unknown addresses, 58 patients who failed to respond to the survey, 22 patients who refused evaluation, and seven patients who died were excluded. Therefore, 23 subjects who gave informed consent were included in the final analysis. Average age at the time of surgery was 14.4 years (range, 11–19 years), average age at the time of observation was 48.8 years (range, 40–60 years), and the average time between the surgery and the observation period was 34.4 years (range, 27–44 years).
BMD was measured at the left femoral neck, and bone metabolism markers were measured from blood samples. Briefly, BMD was measured using dual-energy X-ray absorptiometry (DPX Bravo, GE Healthcare Japan, Hino City, Japan). Z scores were calculated from mean and standard deviation values for females of the same age, and T scores were calculated from mean and standard deviation values of young females. According to the T score–based World Health Organization (WHO) diagnostic criteria, the diagnostic categories were normal (T score, −1.0 or above), osteopenia (T score between −1.0 and −2.5), and osteoporosis (T score, −2.5 or below). Serum procollagen type 1 N-terminal propeptide (P1NP) level was used as a marker of bone formation (normal value, 17.1–64.7 µg/L), and serum tartrate-resistant acid phosphatase 5b (TRACP-5b) level was used as a marker of bone resorption (normal value, 120–420 mU/dL).
Physical performance was measured at our institution using the new physical fitness test issued by the Japanese Ministry of Education, Culture, Sports, Science, and Technology [8]. Measurements in five categories that could be tested at the rehabilitation room of the hospital were collected: grip strength, sit-ups, sit-and-reach, side step, and standing long jump. Right and left grip strengths, which reflect muscular strength, were evaluated using a Smedley grip strength tester; the better of two scores was recorded for each hand. Sit-ups, which reflect muscular endurance, were measured by instructing the subject perform sit-ups for 30 seconds; the number of sit-ups was recorded. Sit-and-reach, which reflects flexibility, was evaluated by instructing the subject to assume a sitting posture with her back against a wall and push against a 24-cm high measuring device with the fleshy parts of the thumbs; the better of two scores for displaced distance of the measuring device was recorded. Side step, which reflects agility, was measured by instructing the subject to step sideways over three parallel lines placed 1 m apart and counting the number of times the lines were straddled; the better of two scores was recorded. Standing long jump, which reflects jumping strength, was measured by instructing the subject to align both feet and jump forward; the jumped distance was measured, and the better of two scores was recorded. Standard scores for each recorded item were calculated from age-specific and sex-specific means and standard deviations and compared with the 2014 standard scores for the same decade of age and sex, published by the Ministry for Healthy Individuals. Physical performance scores for healthy females aged 40–44 years are 29.12±4.58 kg for grip strength, 16.69±4.71 for sit-ups, 42.36±9.13 cm for sit-and-reach, 41.59±5.57 times for side step, and 154.60±20.52 cm for standing long jump. Physical performance scores for healthy females aged 45–49 years are 29.21±4.68 kg for grip strength, 16.13±4.86 for sit-ups, 42.54±8.28 cm for sit-and-reach, 41.25±5.49 times for side step, and 151.72±20.69 cm for standing long jump. Physical performance scores for healthy females aged 50–54 years are 28.04±4.42 kg for grip strength, 14.85±5.58 for sit-ups, 42.54±8.40 cm for sit-and-reach, 39.97±5.72 times for side step, and 145.50±21.65 cm for standing long jump. Physical performance scores for healthy females aged 55–59 years are 27.51±4.18 kg for grip strength, 13.43±5.67 for sit-ups, 42.57±7.74 cm for sit-and-reach, 38.50±5.70 times for side step, and 139.51±20.55 cm for standing long jump. Physical performance scores for healthy females aged 60–64 years are 26.01±4.13 kg for grip strength, 11.10±6.14 for sit-ups, 41.41±8.35 cm for sit-and-reach, 35.15±6.23 times for side step, and 128.61±20.64 cm for standing long jump. Specifically, the following formula was used to determine the physical performance scores of patients in the current study: standard score=50+10 (individual value–mean value)/standard deviation.
For statistical analyses, SPSS ver. 22.0 (IBM Corp., Armonk, NY, USA) was used. According to the T score–based WHO diagnostic criteria, subjects were classified into two groups according to BMD: group L with osteopenia or osteoporosis and group N for subjects with no osteopenia or osteoporosis. For comparisons between the two groups, the Mann–Whitney U or chi-square test was used. The level of significance was set at 0.05.
Results
Mean BMD of the left femoral neck was 0.784±0.11 g/cm2 (range, 0.58–0.98 g/cm2). Mean Z score was −0.15±0.96 (range, −1.89 to 1.9), and mean T score was −0.94±0.92 (range, −2.6 to 0.7). One subject (4.3%) had osteoporosis, and nine subjects (39.1%) had osteopenia; there were 13 subjects (56.5%) without osteoporosis and osteopenia. Evaluation of bone metabolism markers revealed that average P1NP level, indicative of bone formation, was 55.5±24.7 µg/L (range, 15.3–115 µg/L) and that average TRACP-5b level, indicative of bone resorption, was 339.4±133.1 mU/dL (range, 114–597 mU/dL). In the current study cohort, only one subject with osteoporosis had a high TRACP-5b level.
In the current study, physical performance scores were as follows: 23.9±4.3 kg for grip strength, 8.0±6.4 for sit-ups, 34.7±11.6 cm for sit-and-reach, 30.9±6.2 times for side step, and 90.8±30.4 cm for standing long jump. The calculated standard scores for physical performance were as follows: 40.4 (range, 21.8–58.4) for grip strength, 36.1 (range, 17.9–59.2) for sit-ups, 41.1 (range, 16.2–62.4) for sit-and-reach, 33.3 (range, 17.0–53.5) for side step, and 25.1 (range, 12.9–53.4) for standing long jump; all were lower than those reported in healthy individuals.
Ten subjects with osteopenia or osteoporosis according to the T score-based WHO diagnostic criteria (group L) were compared with 13 normal subjects (group N). There were no significant differences in age at the time of surgery, age at the time of observation, time between the surgery and the observation, body mass index, scoliosis angle of the main curve, number of fused vertebrae, and number of unfused lumbar vertebrae between the two groups. The percentage of postmenopausal patients was higher in group L than in group N, which was not statistically significant (Table 1). The P1NP levels were significantly higher in group L than in group N (67.9 µg/L vs. 45.9 µg/L, p=0.049). Conversely, while the TRACP-5b levels were also higher in group L than in group N, this was not statistically significant (385.4 mU/dL vs. 304.1 mU/dL, p=0.077) (Table 2). Increased levels of P1NP and TRACP-5b in group L, thus, indicated that BMD loss was because of high metabolic turnover.

Comparison between the subjects with osteopenia or osteoporosis (group L) and the normal subjects (group N)

Bone mineral density and bone metabolism makers
The standard score for grip strength was lower in group L than in group N; however, this difference did not reach statistical significance. No significant difference between the two groups was found with comparison of other standard scores for exercise performance included in the current study (Table 3).

Standard score of new physical fitness test
Pearson correlation coefficient utilized to determine correlations between BMD and various parameters such as background patient characteristics, test results, and physical performance. There were no correlations between BMD and age at the time of surgery, age at the time of observation, time between the surgery and the observation, scoliosis angle of the main curve, and number of unfused lumbar vertebrae; however, there were weak positive correlations between BMD and body mass index (r=0.386) and number of fused vertebrae (r=0.238). There was a positive correlation between BMD and the standard score for grip strength (r=0.440) as well as weak positive correlations between BMD and the standard scores for side step (r=0.236) and standing long jump (r=0.262). We found no correlations between BMD and the standard scores for sit-ups and sit-and-reach (Fig. 1).
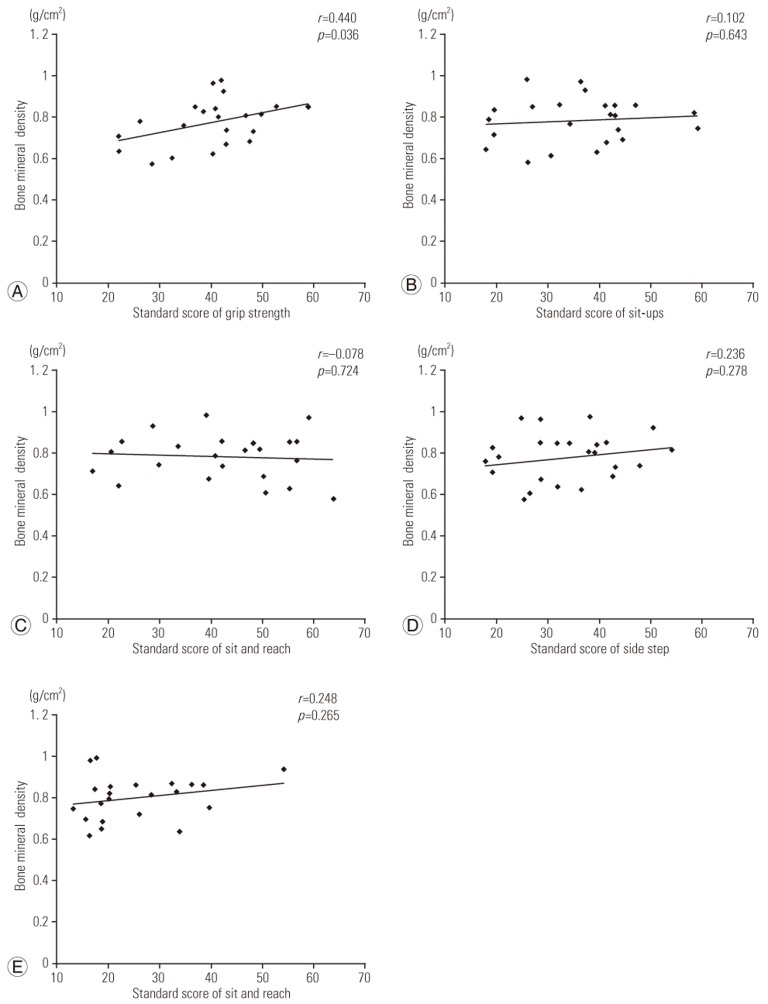
Correlations between bone mineral density and physical performance. There was a positive correlation between bone mineral density and the standard score for grip strength (A). There were weak positive correlations between bone mineral density and the standard scores for side step (D) and standing long jump (E). There were no correlations between bone mineral density and the standard scores for sit-ups or sit-and-reach (B, C).
Discussion
Studies indicate that osteopenia occurs in 27%–65% AIS patients [910111213141516]. Ishida et al. [14] studied the relationship between BMD and bone metabolism markers in AIS patients and reported that osteopenia or osteoporosis occurred in 65% patients. They also found that there was a correlation between TRACP-5b levels and BMD. A study by Hung et al. [15] also indicated that osteopenia was a risk factor for the progression of scoliosis. Notwithstanding these findings indicating decreased BMD in adolescence, there are no reports on BMD in patients with AIS who underwent surgery for scoliosis. In addition, the extent of osteopenia and osteoporosis after a long period following spinal fusion in middle-aged AIS patients is not known. In the current study, we found that the middle-aged patients who underwent spinal fusion in adolescence had an average Z score of −0.15. We further determined that osteoporosis and osteopenia were present in 4.3% and 39.1% patients, respectively. The frequency of osteoporosis in these patients was similar to that of Japanese females (2.9% between the ages of 40 and 49 years and 4.8% between the ages of 50–59 years), as reported by Yoshimura et al. [17].
Majority of the surgeons recommend that patients can resume sports 6 months to 1 year after spinal fusion surgery for AIS [18]. Therefore, sports activities are typically suspended after surgery in AIS patients. Fabricant et al. [19] reported that 5.5 years after surgery, the physical activity level of these patients was 40.5% lower than their presurgical level. Hirano et al. [20] also reported that the return to physical education classes after surgery was slow, with an average of 11 months, and that only 20% patients after surgery were engaged in sports at the same level as before surgery. Furthermore, Katougi et al. [21] indicated that the level of physical performance in postoperative AIS patients did not reach to the level observed in healthy individuals. Overall, these findings suggest that suspension of sports activities after scoliosis surgery might hinder the return to sports activities and negatively impact physical performance of AIS patients after surgery.
Physical performance and physical activity are widely acknowledged as contributors to increasing BMD. Friedlander et al. [7] reported that aerobics and weight training were effective in increasing BMD in young females. Moreover, in an observational study of young females starting in adolescence and encompassing 15 years, weight bearing activity was shown to be important for increasing BMD [6]. Furthermore, there is a confirmed relationship between physical performance, particularly grip strength, and BMD [2223]. A decrease in grip strength is a marker of low BMD and a risk factor for increased vertebral fractures [23]. In the current study, we found a positive correlation between grip strength and BMD, in agreement with previous studies. Therefore, our findings implicate physical activity as an important approach in preventing osteoporosis in AIS patients and suggest that physical activity should be encouraged in postoperative AIS patients.
The present study has several limitations. As this was an observational study of patients after an exceptionally long time after surgery, the follow-up rate of 10% was low. Because of the considerably long follow-up period of the study, it was not possible to include more patients in the current study. Additionally, some of the findings in the current study were conflicting. Despite the positive correlation observed between BMD and the standard score for grip strength, there was no statistical significance in the grip strength between the two groups; this conflict may arise from the small sample sizes used for comparison as group L and N had 10 and 13 subjects, respectively. As a follow-up to the current study, we will contact those patients who did not reply to the study survey as well as those who declined to participate. As BMD measurements were not performed at the time of surgery, we could not ascertain whether low BMD was present before surgery. Finally, information on the type of guidance given to the patients concerning physical activity and the length of time for exercise prohibition after surgery were not clear.
Conclusions
In this retrospective study of female AIS patients who underwent spinal fusion in adolescence, we found that osteoporosis and osteopenia were present in 4.3% and 39.1% patients, respectively, after ≥27 years after surgery. The rate of osteoporosis in these patients was similar to that in Japanese females. Among patients with bone loss, P1NP and TRACP-5b levels were high in those whose T scores for BMD were less than −1.0 standard deviations, indicating that BMD loss was because of high metabolic turnover. BMD exhibited a positive correlation with the standard scores for grip strength, side step, and standing long jump, and the exercise performance was worse in those with low BMD. The exercise performance of the patients with AIS who underwent spinal fusion surgery was worse than the national standards. All together, these findings indicate that an increase in physical activity should be encouraged to prevent BMD loss in middle-aged patients with AIS.
Acknowledgments
The authors thank Mr. Hideo Ishikawa, Mr. Mitoshi Ishino, Ms. Mika Fujiwara, and Ms. Mayumi Ishii at Seirei Sakura Citizen Hospital for assistance on data collection.
Notes
Conflict of Interest: No potential conflict of interest relevant to this article was reported.