Discrimination between Lumbar Intraspinal Stenosis and Foraminal Stenosis using Diffusion Tensor Imaging Parameters: Preliminary Results
Article information
Abstract
Study Design
Retrospective observational study.
Purpose
To examine fractional anisotropy (FA) values and apparent diffusion coefficient (ADC) values of damaged nerves to discriminate between lumbar intraspinal stenosis (IS) and foraminal stenosis (FS) using diffusion tensor imaging (DTI)
Overview of Literature
It is important in the selection of surgical procedure to discriminate between lumbar IS and FS, but such discrimination is difficult.
Methods
There were 9 cases of IS, 7 cases of FS, and 5 healthy controls. The regions of interest were established in the lumbar intraspinal zone (Iz), nerve root (N), and extraforaminal zone (Ez). The FA and ADC values were measured on the affected and unaffected sides of the nerves. The FA ratio and the ADC ratio were calculated as the affected side/unaffected side ×100 (%).
Results
In the Ez, the FA value was significantly lower in FS than in IS (p<0.01). FA ratio was significantly lower in FS than in IS for the Ez (p<0.01). In the Iz, the ADC value was significantly higher in IS than FS (p<0.01). ADC ratio was significantly higher in FS than in IS for the N and Ez (p<0.05). For the Ez, receiver operating characteristic analysis of parameters revealed that the FA values showed a higher accuracy for the diagnosis of FS than the ADC values, and the FA value cut-off value was 0.42 (sensitivity: 85.7%, false positive: 11.1%) and the FA ratio cut-off value was 83.9% (sensitivity: 85.7%, false positive: 22.2%).
Conclusions
The low FA value in the extraforaminal zone suggests the presence of foraminal stenosis. When the FA value and FA ratio cut-off value were established as 0.42 and 83.9%, respectively, the accuracy was high for the diagnosis of foraminal stenosis. It may be possible to use DTI parameters to help in the discrimination between IS and FS.
Introduction
Diffusion-weighted imaging (DWI) is a magnetic resonance imaging (MRI) technique that depicts movements of water molecules, such as diffusion. The images are obtained by applying a motion probing gradient (MPG) in certain directions relative to proton diffusion [1234]. In the diagnosis of acute cerebral infarction [5], DWI is indispensable and widely-used in current clinical practice [67]. DWI shows the ease of diffusion of water molecules and the direction of diffusion. In nerve fibers, axonal membranes and myelin sheaths hinder diffusion along nerve fiber bundles, resulting in the loss of isotropy of water molecules. This state is called anisotropy, and tractography and diffusion tensor imaging (DTI) selectively record this information.
Fractional anisotropy (FA) is an index representing the level of anisotropy and is expressed on a scale of 0 to 1. FA values closer to 1 indicate stronger anisotropy and 0 indicates complete isotropic diffusion. In recent years, the usefulness of DTI has been reported in demyelinating degenerative disorders, such as multiple sclerosis, and in chronic compressive peripheral neuropathies, such as carpal tunnel syndrome. The usefulness of DTI has also been reported in spinal regions. However, DTI tends to be affected more by magnetic susceptibility in the spine and spinal cord than in the head [8]. Thus, its clinical application is limited in the spine and spinal cords.
In myelinated nerves in tissues, diffusion of water molecules is restricted along the nerve fibers because of myelin sheaths, and there is high diffusion anisotropy. However, FA values have been reported to decrease due to decreased anisotropy, resulting from demyelination and degeneration associated with nerve injuries, including the spinal cord and peripheral nerve injury [9101112].
Lumbar foraminal stenosis is a disease where entrapment of the nerve roots and lumbar nerves occur in the intra- and extraforaminal regions due to degenerative changes of the spine [13]. There are pain receptors in the dorsal root ganglion at the affected site, and the intense leg pain that develops is intractable. Macnab [14] introduced the term "hidden zone" to describe this area, which can be easily missed even in the present clinical setting with advanced diagnostic imaging. Therefore, it can cause the worsening of surgical outcomes. Current MRI has difficulty in establishing the diagnosis of extraforaminal stenosis, such as that affecting the lumbar nerve roots and brachial plexus arising from the spinal cord.
Diseases that cause L5 neuropathy are L4/5 canal stenosis (disk herniation) with L5 nerve compression and L5 nerve compression with extraforaminal stenosis at L5/S1. In such cases, L5 nerve roots can be compressed at both sides (double lesion syndrome). In the selection of surgical procedure, it is important to accurately diagnose whether the compressive lesion is intraspinal or foraminal. Conventional MRI has been reported to produce false positives in 30% to 40% of lumbar foraminal stenosis cases. So, this is a difficult condition to diagnose and a new diagnostic imaging method is desirable [15]. To date, there have been only a few reports of DTI in the lumbar nerve root [16171819]. We have previously reported in DTI studies that the tract is interrupted in the stenosed area in patients with lumbar foraminal stenosis and that the FA values become low, and that DTI canreduce the false-positive rate compared with conventional MRI [1520].
This study used DTI to examine DTI parameters of FA and apparent diffusion coefficient (ADC) in intraspinal stenosis (IS) and foraminal stenosis (FS), and determined the diagnostic accuracy of these parameters for FS, such as cut-off value, sensitivity, and false positive rate.
Materials and Methods
There were 9 cases of IS (all lumbar disk herniation; mean age, 59 years), 7 cases of FS comprising 4 cases of lumbar foraminal stenosis and 3 cases of lateral disk herniation (mean age, 60 years), and 5 healthy controls (mean age, 54 years). Endoscopic surgery was performed for diagnosis on those with stenosis. DTI was performed preoperatively using an Achiva 1.5 T MRI system (Philips). Table 1 presents the DTI parameters of patients and healthy volunteers. The patient exclusion criteria were lumbar spinal instrumentation after surgery, multiple levels of lumbar canal stenosis, myelopathy, and spinal tumor, infectious disease, or spinal trauma.
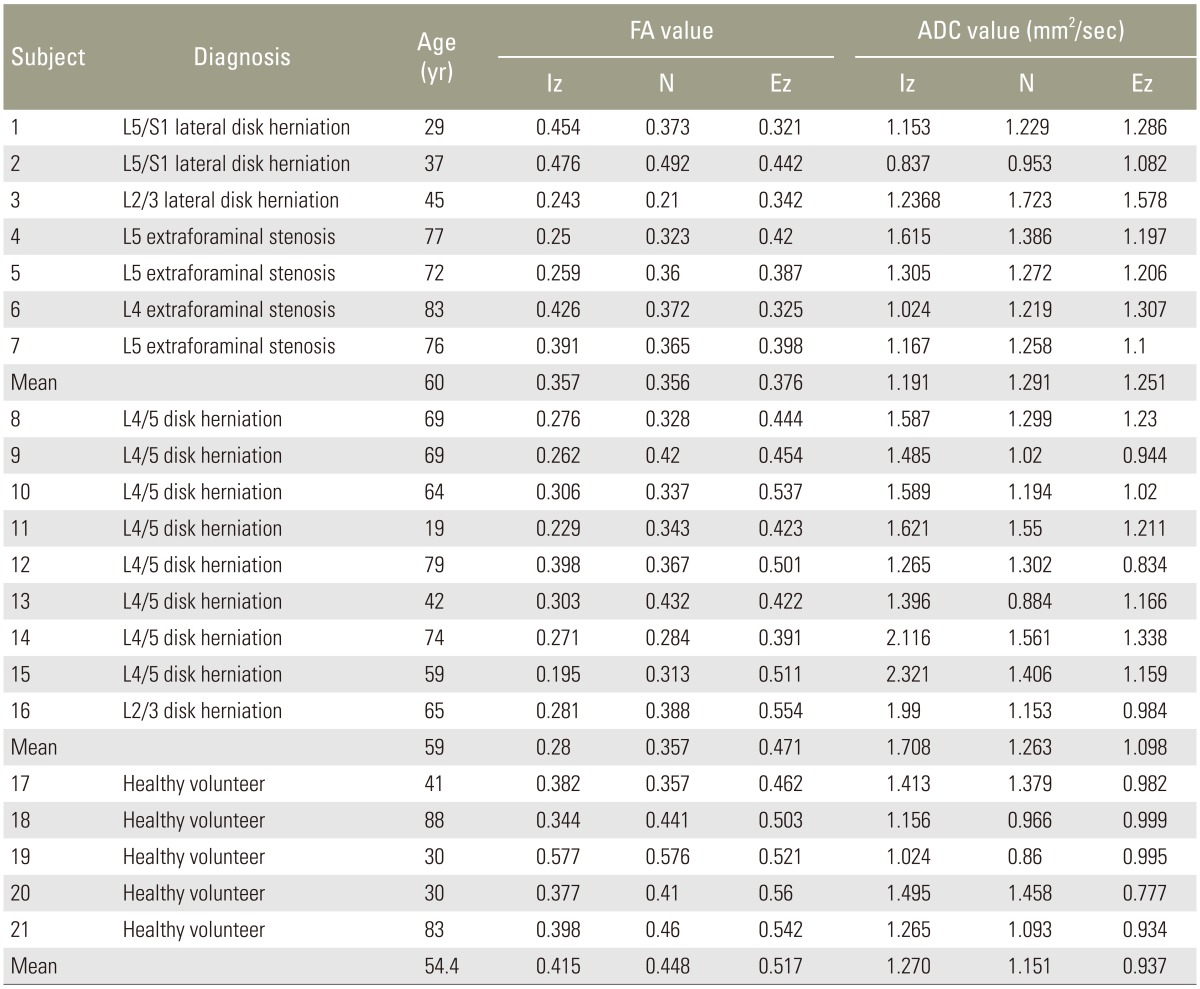
DTI parameters of the patients and healthy volunteers
Motion probing gradients (MPGs) in 15 axes and the b-value of 800 sec/mm2 were used. The DTI images were obtained using an imaging sequence with the array special sensitivity encoding technique (factor: 2), chemical shift selective, echo planar imaging, repetition time: 6,000 ms, echo time: 76 ms, axial slice orientation, 3/0 mm slice thickness/gap, 320×256 mm field of view (FOV), 96×192 matrix, and 50 signals averaged. Imaging was performed for 10 minutes.
Region of interest (ROIs) were established in the intraspinal zone (Iz), nerve root (N), and extraforaminal zone (Ez) (Fig. 1). FA and ADC values were measured on the affected and unaffected sides of the nerves. The FA ratio was calculated as the affected side/unaffected side ×100 (%) and the ADC ratio was calculated as the affected side/unaffected side ×100 (%). Student's t-test was used to compare between groups, with the significance level set at 0.05. A receiver operating characteristic (ROC) curve was used to examine the diagnostic accuracy and cut-off value of extraforaminal parameters.

The regions of interest were placed in the intraspinal zone (Iz), nerve root (N), and extraforaminal zone (Ez). The fractional anisotropy and apparent diffusion coefficient values were measured on the affected and unaffected sides of the nerves.
Results
In IS, the FA value was 0.280±0.019, 0.357±0.016, and 0.471±0.019 for the intraspinal zone (Iz), nerve root (N), and extraforaminal zone (Ez), respectively. The FA value was 0.357±0.039, 0.356±0.031, and 0.376±0.018, respectively, in FS and 0.436±0.021, 0.441±0.017, and 0.520±0.020, respectively, in the controls. The FA value of the Ez was significantly lower in FS than in IS (p<0.01).
In IS, the ADC value was 1.708±0.118 mm2/sec, 1.263±0.076 mm2/sec, and 1.098±0.054 mm2/sec for the Iz, N, and Ez, respectively. The ADC value was 1.191±0.091 mm2/sec, 1.291±0.087 mm2/sec, and 1.251±0.063 mm2/sec, respectively, in FS and 1.280±0.109 mm2/sec, 1.092±0.045 mm2/sec, and 0.924±0.046 mm2/sec, respectively, in the controls. The ADC value of the Iz was significantly higher in IS than in FS (p<0.01) (Fig. 2).

FA and ADC values. The FA value of the Ez was significantly lower in FS than in IS (p<0.01). The ADC value of the Iz was significantly higher in IS than in FS (p<0.01). FA, fractional anisotropy; ADC, apparent diffusion coefficient; Ez, extraforaminal zone; FS, foraminal stenosis; IS, intraspinal stenosis; Iz, intraspinal zone; FS, foraminal stenosis; Cont, control.
In IS, the FA ratios were 64.1%±4.3%, 86.9%±4.6%, and 92.0%±4.0% for the Iz, N, and Ez, respectively. In FS, the FA ratios were 84.8%±7.2%, 74.8%±4.3%, and 72.8%±4.3%, respectively. In the Iz, the FA ratio was significantly lower in IS than in FS (p<0.05). In the Ez, the FA ratio was significantly lower in FS than in IS (p<0.01).
In IS, the ADC ratios were 128.5%±9.0%, 109.6%±4.4%, and 117.1%±5.6% for the Iz, N, and Ez, respectively. In FS, the ADC ratios were 116.6%±20.1%, 128.0%±4.2%, and 147.4%±13.9%, respectively. The ADC ratio was significantly higher in FS than in IS for the N (p<0.05) and Ez (p<0.05) (Fig. 3).

Intraspinal stenosis (IS) and extraforaminal stenosis (FS) values. In the intraspinal zone (Iz), the fractional anisotropy (FA) ratio was significantly lower in IS than in FS (p<0.05). The apparent diffusion coefficient (ADC) ratio was significantly higher in FS than in IS for the nerve root (N) (p<0.05) and extraforaminal zone (Ez) (p<0.05). Cont, control.
For the Ez, ROC analysis of parameters revealed greater accuracy of FA values for the diagnosis of FS than ADC values. The FA value cut-off value was 0.42 (sensitivity: 85.7%, false positive rate: 11.1%, and odds ratio: 48) and the FA ratio cut-off value was 83.9% (sensitivity: 85.7%, false positive rate: 22.2%, and odds ratio: 21) (Fig. 4).

For the exraforaminal zone, receiver operating characteristic analysis of parameters revealed that the FA values showed a higher accuracy for the diagnosis of extraforaminal stenosis than the ADC values. FA, fractional anisotropy; ADC, apparent diffusion coefficient; TPF, true positive fraction; FPF, false positive fraction.
1. Case presentation
A 77-year-old woman (case 4 in Table 1) had L4?? laminectomy for lumbar spinal stenosis of L4-5 one year previously. She experienced low-back pain and left calf pain in the fifth lumbar dermatome 3 months after the first surgery, with subsequent worsening of pain and numbness. Diagnostic images, including plain radiographs, computed tomography (CT) (Fig. 5A), and MRI revealed L5 foraminal stenosis on the left side. Selective fifth nerve root block performed using 1 mL of 1% lidocaine relieved the pain in the left calf. FA values were 0.25, 0.323, and 0.420 for Iz, N, and Ez, respectively. FA ratios in the same respective order were 61.3%, 78.6%, and 79.8%. A low FA value was observed in the extraforaminal zone. Microendoscopic intrapedicular partial pediculotomy [21] was performed and L5 roots were decompressed (Fig. 5B-D). The Japanese Orthopedic Association score improved from 11 points to 24 points (normal score is 29 points). Fig. 6 shows diffusion tensor tractography of bilateral L5 roots. On the entrapment side of the left L5 root, nerve tracts were disrupted (Fig. 6A). Three months after decompressed surgery, the nerve tracts had increased and improved (Fig. 6B).

Presurgical (A) and postsurgical (B, C) computed tomography and image of endoscopic intrapedicular partial pediculotomy surgery (D) of a 77-year-old woman with L5 foraminal stenosis on the left side. (B, C) Arrows indicate pediculotomy. (D) Arrowhead indicates decompressed L5 roots.

Diffusion tensor tractography of bilateral L5 roots. (A) On the entrapment side of the left L5 root, nerve tracts were seen to be disrupted (arrow). (B) Three months after decompressed surgery, nerve tracts had increased and improved (arrowhead).
Discussion
Appropriately named the "hidden zone" by Macnab [14], lumbar foraminal stenosis is often overlooked, accounts for approximately 60% of failed back surgery syndromes, and plays a major role in lowering surgical success rates [13]. Plain radiography, CT, and MRI [222324] are useful in diagnostic imaging of lumbar foraminal stenosis, but false positive results are common. Thus, diagnosis is made comprehensively by a combination of selective radiculography and nerve root block [25]. The usefulness of 3D-CT, MR myelography [26], and 3D-MRI [27] has been reported. However, there is no diagnostic method to effectively determine the cause of L5 neuropathy, be that L4/5 canal stenosis, L5/S1 FS, or double lesions. When L5 nerve distal latency was measured in an electrophysiological study, latency was longer for extraforaminal stenosis than for intraspinal stenosis, enabling their discrimination [28]. However, this method is invasive and there is no non-invasive diagnostic method.
We have previously reported in DTI studies that the tract is interrupted in patients with lumbar FS and that the FA values become low [15]. Presently, ROIs were established at three sites: intraspinal zone, nerve root, and extraforaminal zone. A detailed examination was performed on DTI parameters of FA and ADC values. Generally, increased ADC may be due to inflammation or oedema, whereas decreased FA may reflect damaged tissue microstructure, demyelination, axonal loss, or increase in isotropic water volume. The changes in DTI parameters indicating neuropathy were dependent on the site of nerve compression. These changes (low FA value and high ADC value) were marked in the intraspinal zone for IS and in the extraforaminal zone for FS. In addition, the FA value showed higher accuracy than the ADC value in the extraforaminal zone and the low FA value suggested the presence of FS. When the FA value and FA ratio cut-off values were established as 0.42% and 83.9%, respectively, in the extraforaminal zone, the false positive rate was low for the diagnosis of extraforaminal stenosis. The results indicate that these parameters can help in the discrimination between IS and FS.
There have not been many reports on DTI of lumbar nerve roots [16171819]. Balbi et al. [16] used Fiber Viewer to continuously measure parameters along fiber bundles in cases of neuropathy due to disk herniation. They reported a sharp drop in the FA values and an increase in ADC values in the compressed areas. These results are consistent with ours. Electrophysiology studies can analyze nerve function, however the approach is invasive. We previously reported that no abnormalities of either amplitude or nerve conduction velocity were observed in the tibial or peroneal nerves in patients with L5 foraminal stenosis [29]. Nerve conduction tests are used to detect nerve conduction disorders peripheral to the knee, but lumbar nerve injuries are localized to the spinal canal, and if Waller degeneration does not extend to the region below the knee, then there is the possibility of false-negative findings. DTI may reveal the local lumbar nerve damage.
There are several limitations of our study. There were a small number of cases. IS cases were disc herniation cases and canal stenosis cases were not examined. Improved resolution and sequence development are needed for lumbar nerve imaging because DTI is prone to artifacts. Further studies are necessary with a larger number of cases.
Conclusions
This study examined the usefulness of DTI in the discrimination between lumbar IS and FS. The changes in DTI parameters indicating neuropathy were dependent on the site of nerve compression. These changes (low FA value and high ADC value) were marked in the nerve root and the extraforaminal zone for FS. In addition, the FA value was more accurate than the ADC value in the extraforaminal zone. Low FA value suggested the presence of FS. We anticipate that the diagnosis of FS can be made by a detailed examination of DTI parameters.
Notes
Conflict of Interest: No potential conflict of interest relevant to this article was reported.