


Introduction
Worldwide, neck pain ranks fourth among the leading causes for enduring years of disability [1]. The onset of neck pain peaks in middle age. The annual prevalence rate for the ailment exceeds 30%, and it occurs more often in females [1]. Most of the acute neck pain episodes resolve with or without treatment, but nearly 50% of the patients report recurrences and chronicity of pain [2].
Despite its high incidence, considerable variations exist in defining neck pain. The condition presents with a variable clinical course; however, mostly, it is described as ‘episodic’ or ‘recurrent’ [3]. This fact may be due to the association of the problem with numerous physical and psychosocial contributors [1]. The structural causes of neck pain have not been completely understood but are thought to be connected to a variety of anatomical structures and their interrelated functions [4]. The causative mechanisms rarely implicate a single anatomical structure and are dependent upon several contributing factors [4]. Peterson and Bergman [5] state that any event leading to altered joint mechanics or muscle functions can cause neck pain [6]. Hence, most of the complaints are categorized as ‘nonspecific’ or ‘mechanical’; in nontraumatic neck pain, the most significant contributor is poor posture [6]. Restricted segmental mobility of the cervical and thoracic regions has also been reported in people with neck pain [7].
Biomechanically, the cervical, thoracic, and lumbar spines are interrelated [8]. The thoracic spine column functions as a supporting base for the cervical spine and influences the cervical kinematics through the cervicothoracic junction [4]. Concomitant thoracic spine motion is necessary to produce the complete range of movements at the cervical spine, which are often reduced with changes in the normal alignment of the thoracic spine [8]. Owing to this close anatomical link, any mechanical dysfunction in the thoracic spine might produce associated changes in the cervical spine and vice versa [8]. The key postural muscles, namely trapezius, levator scapulae, and serratus anterior, have attachments spanning the cervical and thoracic regions. Postural impairments in the thoracic spine may lead to a dysfunction of these muscles [9]. Hence, changes in the thoracic alignment have been proven to alter the mechanical loading of the cervical spine [10]. Of relevance is the increased incidence of neck problems in older adults having a higher prevalence of thoracic hyperkyphosis [7]. Besides, reduced thoracic mobility has been identified as a predictor for neck and shoulder pain [4]. Further evidence of thoracic kinematics influencing the function of the cervical spine could be obtained from the fact that neck pain improves with thoracic articular treatment [11]. Thoracic thrust and nonthrust mobilizations have been shown to produce positive effects on the severity of neck pain, neck movements, and self-reported disability [11].
However, a systematic review reported conflicting results regarding the benefits of thoracic spine treatment in the management of neck pain [12]. Thus, there is a need to investigate the causative role of thoracic spine mobility and alignment in the subjects. Accordingly, studies have been conducted to assess thoracic spine function in individuals with cervical pain. Although individual studies exist, no review has comprehensively analyzed the available literature on the relationship between thoracic dysfunction and neck pain. Hence, a thorough review of the literature was performed to explore the relationship of neck pain with thoracic posture and mobility.
Materials and Methods
1. Data sources and search strategy
A systematic search of the literature was performed to investigate the presence of thoracic spine dysfunction in the cervical pain population. The databases of PubMed/Medline, CINAHL, and Web of Science were screened. The search strategy included MeSH terms “cervical pain,” “cervical spondylosis,” “cervical function” AND “thoracic kyphosis,” “thoracic hypomobility.” Papers published between 1990 and 2017 were considered. The studies were required to be published in English and involve only human subjects.
2. Study-selection process
The primary author initially screened the titles and abstracts of the resulting articles. After reviewing the abstracts, two authors independently scrutinized the fulltext documents for relevance. Any difference of opinion was resolved with discussion.
3. Inclusion and exclusion criteria
Only case-control, longitudinal/cohort, cross-sectional, and observational studies were included. Inclusion of the neck pain (nonspecific/mechanical) population with or without healthy, pain-free controls was necessary. Research works assessing thoracic spinal alignment or dysfunction in subjects with cervical pain dysfunction were selected. The investigations that failed to assess the outcomes of interest, involved only healthy subjects, or did not include an adult population were excluded.
Results
1. Search results and final inclusion
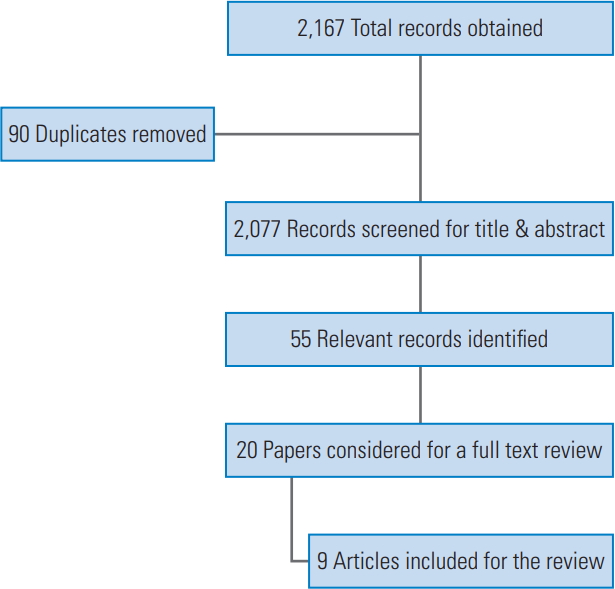
From the three databases, a total of 2,167 records were obtained. After removal of 90 duplicates, 2,077 records were screened for their titles and abstracts. Fifty-five relevant records were identified, and among them, 20 studies were considered for full-text review. Finally, nine investigations fulfilling the inclusion criteria were included in this review [4,13-20] (Table 1, Fig. 1). The major reasons for exclusion were that the studies failed to measure the outcomes of interest, estimated only cervical function, involved only a healthy population, included a child/adolescent population, and comprised a whiplash-injury population.
1) Participants
Almost all the studies (n=9) involved participants with chronic, nonspecific neck pain. One study consisted of both acute and chronic neck pain, and another work included patients with cervical radiculopathy along with mechanical neck pain. Both male and female participants were included in seven studies, and one research study was conducted exclusively on the female population. Six out of the nine reviewed studies encompassed adults in the age group 20–50 years, whereas two studies considered elderly population above 60 years of age. Only one longitudinal study involved children (age group) and monitored them up to their adulthood. Two studies evaluated office workers involved in computer-related work and having complaints of neck pain.
2) Comparison groups
Except for two studies, the rest of them mentioned the selection process of control subjects who were comparable to the cases with regard to age and gender. One of the works lacked a control group, as it was a longitudinal study on the same group.
3) Outcomes
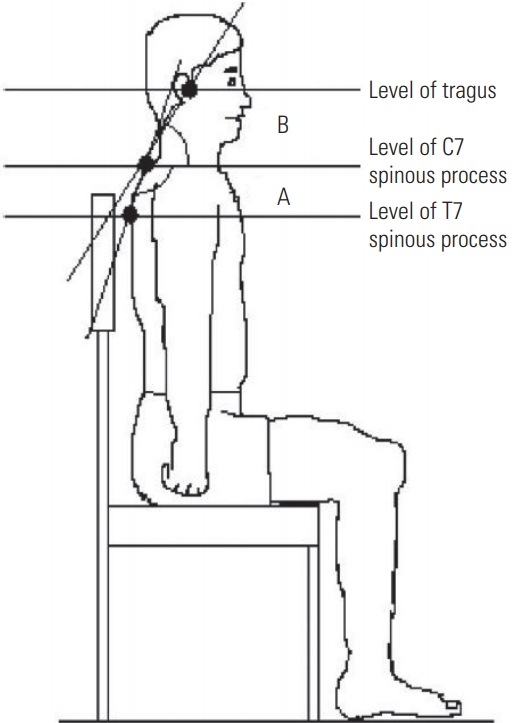
The outcomes used for assessing cervical pain and dysfunction included the Numeric Pain Rating Scale (NPRS), Visual Analogue Scale for severity of neck pain, Neck Disability Index, Northwick Park Questionnaire, and other questionnaires (State-Trait Anxiety Inventory, Tampa Scale of Kinesiophobia, and Medical Outcomes Study 36-item Short-Form Health Survey) to evaluate the associated disability. Craniovertebral angle (CVA) for cervical posture and upper/high thoracic angle (HTA) values for thoracic spine alignment were the commonly used measures of posture. CVA refers to the angle formed between a line drawn from the tragus of the ear to the seventh cervical vertebra (C7) and the horizontal (Fig. 2). Upper/HTA was calculated as the angle formed between a line joining the spinous processes of the seventh cervical and thoracic vertebrae (C7 and T7) and the horizontal (Fig. 2). One study also measured the various gait parameters and the amount of spinal rotations during walking tasks. Postural assessment outcomes were mostly evaluated through photographs, videos, software, and radiographic films.
2. Neck pain and thoracic spine alignment
Overall, five studies examined the influence of thoracic spine posture (upper thoracic angle [UTA]) on neck pain. A positive correlation was observed between higher UTA and neck pain by Lau et al. [4], but the thoracic kyphosis was not a significant predictor for the intensity of the neck pain as measured on NPRS. In this study, the neck pain group displayed a greater UTA (7.3°) when compared with the healthy controls. Similar results were reported by Kaya and Çelenay [19], who witnessed a positive correlation between thoracic curvature and neck pain. The research by Nejati et al. [16] reported significant differences between the neck pain and healthy control groups regarding the HTA in working position and not in neutral forward-looking position. Further, a substantial correlation between thoracic posture and neck pain was documented. However, in another study, Tsunoda et al. [14] did not discern a substantial association between increased kyphosis and neck-shoulder pain. In a study on computer workers by Szeto et al. [15], no significant differences were observed in the assumed sagittal postures of the thoracic spine while performing a keyboard task between the case and the control groups.
3. Thoracic posture as a risk factor for neck pain
A cohort study by Poussa et al. [17] reported that thoracic kyphosis was not a significant risk factor for the development of neck pain. A cohort of school children (in the age group of 10–13 years) was assessed annually for thoracic kyphosis, lumbar lordosis, height, and weight until the age of 22 years. During the last visit, history and the presence of neck pain were evaluated. However, no significant association between thoracic kyphosis and neck pain was seen in the adolescent age group.
4. Neck pain and thoracic spine mobility
Two studies reported the relationship between thoracic spine mobility and neck pain. The work by Falla et al. [18] investigated the amount of trunk rotation during a walking task in neck pain individuals and healthy, pain-free controls. It was concluded that the participants with neck pain had reduced trunk rotations compared to asymptomatic controls during any speed of walking. The number was further reduced in the neck pain group when neck rotations were added. In another study by Kaya and Çelenay [19], thoracic mobility was established to have a negative correlation with neck pain intensity, and a decrease in the mobility by more than 30° was found to be a critical factor for neck pain.
5. Forward head posture and thoracic spine posture
The relationship between forward head posture (FHP), that is, a smaller CVA and thoracic kyphosis (measured with HTA/UTA) was investigated in three studies. Lau et al. [4] testified to the presence of smaller CVA and greater UTA in participants with neck pain in comparison with the control group devoid of neck pain. Further, a significant negative correlation was present between thoracic kyphosis and CVA in the study by Quek et al. [13]. The authors suggested that an increase in thoracic kyphosis was correlated with lower CVA, that is, increased FHP. Moreover, a multiple mediation analysis revealed that increased FHP along with thoracic kyphosis caused mobility limitations in the cervical spine. In another study by Yu et al. [20], a multiple linear regression was described, in which the cervical angles were correlated with thoracic kyphosis and T1 slope angle in cervical spondylitis individuals.
Discussion
The present literature review was performed to examine the presence of thoracic spine dysfunction in the neck pain population. The review identified nine studies fulfilling the specified inclusion criteria and investigated the impact of thoracic posture and mobility on chronic neck pain.
1. Thoracic kyphosis and neck pain
Increased kyphosis was determined by the presence of greater upper/HTA. UTA is measured as an angle between horizontal and a line drawn between the seventh cervical and thoracic spinous processes [13]. Among the five studies exploring the relationship of thoracic posture with neck pain intensity, two reported significant positive correlations and two more demonstrated contradictory results with no correlation between the two variables [4,14,15]. Besides, one study concluded that neck pain was positively associated with hyperkyphosis during a functional typing task [16]. Further, Lau et al. [4] reported that the UTA was better related to the presence of neck pain than the CVA.
The severity of pain is determined by a variety of other physical and psychosocial contributing factors [21]. Hence, these contradictory results might be due to multiple factors, such as psychological features influencing the neck pain severity and chronicity [21]. Thus, thoracic malalignment (that is, increased kyphosis) may be one among the multiple contributors to neck pain. Only one prospective study reported thoracic kyphosis as not a significant contributing factor [17]. But the work involved adolescent population in whom the incidence of neck pain may be too low to reveal a difference between individuals with and without thoracic kyphosis. However, the other studies lacked a prospective design and could not adequately investigate thoracic spine posture as a contributing risk factor for neck pain.
2. Thoracic mobility and neck pain
Impaired cervical mobility is one of the significant features of neck pain. Studies on normal individuals noted that cervical movement is dependent on thoracic posture and mobility [4]. Nevertheless, only a few studies have investigated the impairment of thoracic mobility in neck pain individuals. Norlander et al. [7,22] as well as Norlander and Nordgren [23] in 1998 reported that reduced segmental mobility in the upper thoracic spine could predict the onset of neck and shoulder pain. The researchers argued that thoracic manipulation could restore cervicothoracic junction mobility and hence alleviate cervical dysfunction.
Another study reported that neck pain patients exhibited reduced trunk rotations while walking [18]. The reduction in trunk movement was claimed to be a generalized protective response of the pain centers to avoid further injury. It appears from the discussion of these authors that reduced trunk rotation is a consequence of neck pain. However, walking with reduced trunk movement places excessive mechanical stress on the lumbar spine, leading to low-back pain [18].
The only study that measured thoracic mobility in the sagittal plane observed a significant difference between the neck pain and healthy control groups. However, the causative mechanisms for reduced thoracic mobility are underreported and poorly studied [19]. Thoracic mobility decreases with age, and therefore, it is still unclear whether these restrictions are independent of the aging-related stiffness of the thoracic spine [13].
3. Thoracic kyphosis and forward head posture
Among the various relationships described in the present review, increase in thoracic kyphosis and FHP were consistently correlated across the three studies [4,13,16]. This connection suggests that increased kyphosis is a crucial factor in the development of FHP and hence neck pain. A greater FHP has been ascertained to be associated with reduced cervical ranges and thus contribute to neck pain. FHP increases the compressive loading on the cervical spine structures [13]. This plausible association is supported by Quek et al. [13], who demonstrated that FHP is a mediator between thoracic kyphosis and neck pain. Furthermore, a randomized control trial by Lau et al. [24] uncovered that manipulation of the thoracic spine improved FHP and cervical flexion range of motion, which further substantiates the above findings.
4. Causative mechanisms for neck pain
The cervical spine and the head complex are positioned and balanced on the kyphotic curve of the thoracic spine. A change in the thoracic alignment might therefore cause compensatory changes in the cervical curve to preserve the normal forward gaze [20]. Increased thoracic kyphosis leads to the anterior shift of the trunk mass through an alteration of the thoracic spine loading, thereby resulting in FHP of the cervical spine as compensation [4]. The FHP increases the compressive loading of the cervical spine and places abnormal stress on its posterior noncontractile elements [4]. Flexion of the thoracic spine was shown to increase the cervical spine erector spinae electromyography activity, which further accentuates the stress on the posterior spinal structures in the neck [4]. The results of the review also reported the presence of FHP with thoracic hyperkyphosis. Sustained FHP due to the above reasons is implicated in the alteration of cervical motor control and the development of myofascial dysfunction, thereby contributing to neck pain.
In a rigid thoracic spine (as occurring with hyperkyphosis), increased loads are placed on the postural muscles spanning the neck and the upper back, which considerably impair motor control [14]. In certain demanding postures that challenge the equilibrium, patients tend to further limit the motion of the spine, which results in reduced trunk rotations while walking. The increase in stiffness is not energetically efficient and hence increases the muscle co-contraction, thereby further enhancing the compressive load on the cervical spine [18].
In persons involved in computer-related work, persistent improper posture has been reported. Plausible reasons can be a lack of awareness regarding the body position during work; high concentration or focus, which may increase stress as a maladaptive coping strategy; and impaired motor control [16]. Altered/increased thoracic kyphosis causes mobility impairments at C7–T1 and T1–T2 levels [4]. Reduced mobility in the lower cervical segments can be compensated by increased movement at the upper cervical levels [13]. This occurrence could lead to impaired control and irritation of the nociceptive structures in the spine and hence, the onset of neck pain. Nonetheless, the effect could also be the result of ‘reverse causation,’ as hyper thoracic kyphosis could not be conclusively established as a causative factor in neck pain development.
5. Clinical implications
Most of the articles considered in the review reported the presence of thoracic dysfunction in the neck pain population. Two features, namely impaired thoracic mobility and relationship between FHP and thoracic kyphosis, were evident. Therefore, the review reinforces the inclusion of thoracic spine evaluation and treatment in the management of neck pain. Furthermore, the findings provide the conceptual basis for studies that investigate the effectiveness of thoracic spine mobilization procedures [24], as they can restore the normal biomechanics of the thoracic spine and lower the mechanical stress in the cervical spine [25,26]. However, a few studies also reported the absence of relationship between cervical pain and thoracic kyphosis. Nevertheless, a cutoff value for thoracic mobility (more than 30°) associated with neck pain has been identified in one study. Clinicians need to consider the results of these studies while assessing and treating neck pain.
6. Limitations
The review has a few limitations. A variety of study methods and outcome measures were identified across the studies, and hence, a meta-analysis could not be performed. As only one prospective trial was determined, the cause-effect relationship between thoracic posture and neck pain could not be examined.
7. Future recommendations
The current evidence suggests that the thoracic spine is possibly a contributing factor for neck pain. However, the studies identified in this topic are limited. Additionally, the number of studies that investigated the contributions of thoracic spine alignment and mobility as risk factors for the presence of neck pain is minimal. Thus, further research with a prospective study design might be helpful in establishing whether impaired thoracic dysfunction is a risk factor for the development of neck pain. Mobilization/manipulation of the thoracic spine is often performed with the aim of improving thoracic mobility; however, only minimal studies have examined the relationship between the two variables. Therefore, further research must identify the prevalence of thoracic mobility restrictions in the neck population and assess their impact on the severity and prognosis of the ailment. Besides, it is also unclear whether thoracic dysfunction is a predisposing or contributing factor for neck pain, thus necessitating further research on the cause and effect relationship.
Conclusions
A significant relationship is present between thoracic kyphosis and postural alteration of the cervical spine. However, thoracic kyphosis has not been uniformly correlated with neck pain intensity, which could be due to the multiple causative factors that are responsible for pain in general. Thus, the review favors the inclusion of thoracic spine assessment and treatment in managing mechanical neck pain. Owing to a lack of prospective trials in the area, thoracic kyphosis cannot be established as a risk factor for neck pain development. Further research is strongly recommended to investigate the cause-effect relationship between thoracic posture and cervical dysfunction.