


Introduction
X-ray is currently the primary diagnostic tool for assessment of idiopathic scoliosis in young patients. The Cobb angle method is the gold standard, although it has some limitations. Measurements of Cobb angle present an intraobserver and interobserver variability of 3°–5° [1] and are obtained from a radiograph in two planes, while scoliosis is a 3D deformity [2]. Furthermore, exposure to ionizing radiation may cause harmful effects such as breast cancer and other tumors, particularly during the growth stage [3]. Moreover, the magnitude of the Cobb angle is not the only factor responsible for changes in the external appearance of the back. The frontal balance of the trunk, variations in the sagittal plane, deformities of the chest and asymmetry of the pelvic and scapular waist also influence the external shape of the back in patients with scoliosis.
These limitations of radiological methods have triggered recent advances in noninvasive and optical techniques to assess the external morphology of the back, with the primary aim of minimizing exposure to ionizing radiation in children and adolescents with scoliosis. One of the first techniques was Moiré's topography in 1970 [4]; this was followed by several other methods such as the Integrated Shape Investigation System (ISIS) [5], ISIS2 [6], Fotometric 4D [7], Orthoscan [8], and Shannon's Surface Dynamic Topography [9]. These methods apply the projection of multiple rows of light on the subject's back. This is done in such a way that the pattern of distortion obtained recreates a quantifiable reconstruction of the back and allows the assessment of possible asymmetries using a specific computer software.
This paper describes the application of a back surface topography method based on structured light. This method was used to assess the asymmetry of the back and trunk in young patients with idiopathic scoliosis on three topographic parameters. Furthermore, we tested for correlations between these topographic parameters and the radiographic variables that quantify the underlying skeletal deformity of the spine. The objective of the study was to establish whether the correlation between topographic and radiographic variables is significant enough that the topographic method could complement radiographic study, and thus reduce the amount of ionizing radiation received by young, growing patients.
Materials and Methods
1. Patient selection
After obtaining approval from the Institutional Review Board, we conducted a study with young patients (children and adolescents) who were referred to our hospital between 2010 and 2014 for the assessment and treatment of idiopathic scoliosis.
The inclusion criteria were patients in growth phase diagnosed with juvenile or adolescent idiopathic scoliosis; those undergone a positive forward bending test in physical examination; and those with a radiographic Cobb angle equal to or higher than 10°.
On the other hand, patients with other causes of scoliosis like neuromuscular, congenital, tumour, osteochondrodystrophy; those that presented a positive Adam test in physical examination, but whose Cobb angle was lower than 10°; and those with missing data were excluded.
In compliance with the Declaration of Helsinki, all patients (together with their parents) received comprehensive information and gave consent to the use of their personal data in the study.
2. Patient evaluation
Patient evaluation consisted of a clinical, radiographic, and topographic study. A chart review was completed to obtain patient age, sex, information on how the disease was detected, and personal and family history. Physical examination included an assessment of range of motion, weight and height, asymmetry of shoulders, shoulder blades and pelvic girdle, leg length discrepancy, and forward bending test (location of the prominence of the back: cervical, thoracic, or lumbar; right or left).
All subjects underwent standard radiographies of the full spine (30–90; anteroposterior and profile projections). Lateral flexion angle was determined by the Cobb angle method [10]. We used the Pedriolle-Vidal method [11] to quantify the degree of vertebral rotation. We also determined the thoracic kyphosis angle between T4 and T12 vertebrae and the lumbar lordosis angle between T12 and L5 vertebrae over a profile projection.
Furthermore, all subjects were assessed using our previously developed back surface topographic method. This method allows the obtainment of three topographic variables to quantify the asymmetry of the back in three planes of space: Horizontal Plane Deformity Index (DHOPI), Posterior Trunk Symmetry Index (POTSI), and Columnar Profile (PC). These variables are explained in detail in the following section.
3. Back surface topography method
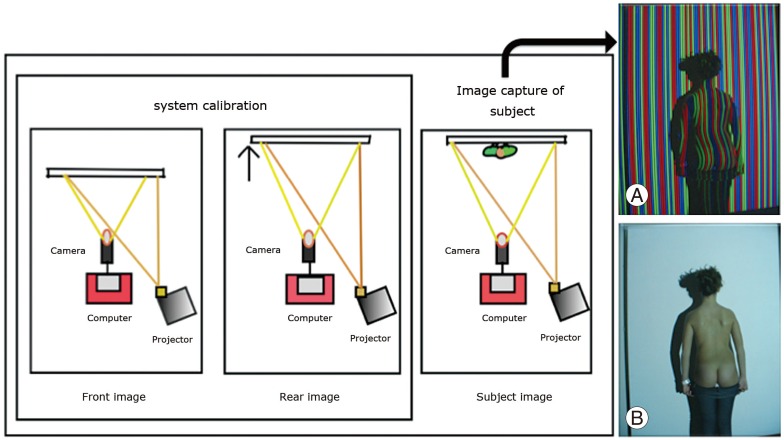
The method applied in our research [12] consists of projecting a pre-established color-coded pattern of 90 red, green, and blue parallel, vertical lines over the subject's back. These lines form sequences of 6 consecutive lines that are not repeated in the pattern, allowing localization of each line on the subject's back, as well as over a flat reference surface. The system is composed of a mobile white screen, a projector, a digital camera, and a computer with image recognition software designed in Matlab 7.9.0 (Matlab & Simulink Release 2009b. The MathWorks, Inc., Natick, MA, USA). This software allows matching of each point in the color-coded pattern of obtained images so that the information can be represented as level curves. In this way, a topographic image of the patient's back is obtained. The system provides 40 shades of color, ranging from the most protruding to the least prominent point. On its own, this image provides subjective information about possible asymmetry; however, it is necessary to quantify this data.
System calibration must be performed at the beginning of each session (Fig. 1). The white screen is mobile and may be placed in two positions separated by a known distance. Two images are captured with the color-coded pattern projected over the screen: one with the screen in forward position and the other in rear position. This step is not repeated unless the position of other elements is modified. Next, the patient is placed in front of the screen in a rear position and two photographs of his/her back are taken: one with and one without the color-coded pattern projected (Fig. 1A and B, respectively). Correct positioning of the subject is essential to avoid errors. The subject must fully expose the back from the neck to the buttocks and should be placed with the back to the camera, with his/her feet on a mark on the floor; arms should fall relaxed at the sides; and the head should be straight with eyes looking straight ahead.
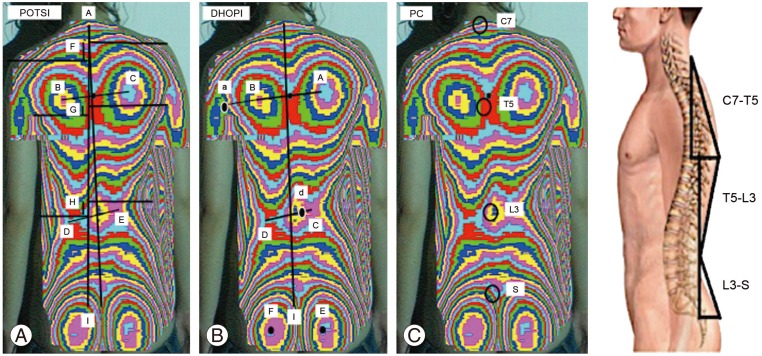
The topographic image of the subject's back obtained by this software allows for the calculation of three topographic variables by marking, in a sequential and standardized manner, 16 anatomical points on the image (Fig. 2). POTSI [13] refers to the coronal plane; DHOPI [14] is used to quantify the asymmetry in the axial plane; and a new variable called PC is used to calculate the asymmetry in the profile plane.
Points 1 through 6 allow calculation of POTSI (Fig. 2). This index is the sum of two variables (Fig. 3A): Height Asymmetry Indexes (HAI) and Frontal Asymmetry Indexes (FAI). HAI is obtained as the sum of height differences of the shoulders (distance F), axillary folds (distance G), and waist creases (distance H). It is normalized via division of its value by the vertical distance from the C7 vertebra to the baseline of gluteal cleft (distance I). To determine FAI, differences in the horizontal distance of C7 vertebra (distance A), axillary folds (B–C), and waist (D–E) with respect to the gluteal cleft are obtained and their sum is calculated; they are also normalized through division by distance I.
To calculate DHOPI, the software draws two lines: (1) the line between the two most prominent points of the scapulae: points 11–12 (Fig. 2) and points B–A (Fig. 3B); and (2) the line between the two least prominent points of the waist: points 13–14 (Fig. 2) and points D–C (Fig. 3B). Next, it locates the symmetrical point of the most prominent point situated on the two abovementioned lines. The differences in depth between the symmetrical points divided by distance I are then summed.
Finally, the new PC variable is obtained from the determination of three angles (points 7–10 of Figs. 2, 3C): (1) PC1 was defined by the angle between the basis of the neck (C7) with inter-scapular zone at T5 and the vertical line; (2) PC2 was determined by the angle between the anterior point (T5) with the waist zone (L3) and the vertical line; and (3) PC3 was determined by the angle between the anterior point (L3) with the inter gluteal cleft (sacrum) and the vertical line. Lastly, points 15–16 (Fig. 2) are used to correct, if necessary, the incorrect placement of the subject by rotating the image around a vertical axis until both points are at the same depth.
4. Statistical analyses
SPSS ver. 19 (SPSS Inc., Chicago, IL, USA) was–used for statistical analyses. Descriptive statistics (mean±standard deviation, minimum to maximum, 95% confidence interval [CI]) were calculated for radiographic and topographic parameters. Pearson's correlation test was applied to determine the correlation between radiographic and topographic variables. One-way analysis of variance (ANOVA) and the Bonferroni correction for multiple comparisons were used to determine if there were statistically significant differences in the values of topographical variables between groups with different degrees of scoliosis. A two-tailed p-value <0.01, and in some cases <0.05, was considered statistically significant.
Results
We collected the data of 88 patients (12 boys and 76 girls) diagnosed with juvenile or adolescent idiopathic scoliosis. Mean age was 13.15±1.96 years (range, 7–17 years). All patients had asymmetry of the back, with a positive Adams test. None had a significant discrepancy in length of the lower limbs.
1. Descriptive statistics for radiographic variables
The type of curve was double (thoracic and lumbar) in 49 patients and single in 39 subjects (14 lumbar, 8 thoracic, and 17 thoracolumbar). The mean Cobb angle of the main curve was 20.53°±7.84° (10.00°–51.80°). Fifty-one patients presented a Cobb angle less than 20°; 27 had angles between 20° and 30°; and 10 had angles greater than 30°. Mean value of vertebral rotation degree of the main curve was 7.98°±5.83° (0°–30°). Mean value of thoracic kyphosis angle was 29.59°±8.87° (10°–60°), and mean lumbar lordosis angle was 44.65°±9.96° (20°–72°).
2. Descriptive statistics for topographic variables
Mean DHOPI value was 5.90±1.94 (1.68–10.26; 95% CI, 5.31–6.40), mean POTSI value was 19.79±7.03 (17.96–21.43; 95% CI, 19.05–23.12); and mean PC value was 41.67±9.93 (11.80–65.47; 95% CI, 39.61–43.64).
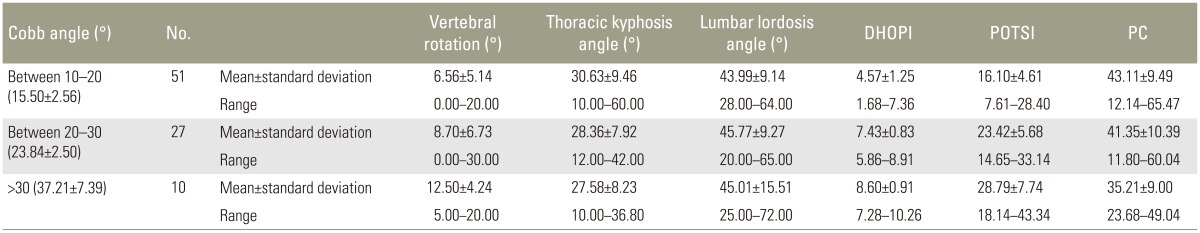
Patients were divided into three groups according to their degree of scoliosis: (1) group 1: Cobb angle 10°–20°, (2) group 2: Cobb angle 20°–30°, and (3) group 3: Cobb angle >30°. Table 1 summarizes mean values for each topographic variable according to Cobb angle values.
3. Correlation between topographic and radiographic variables
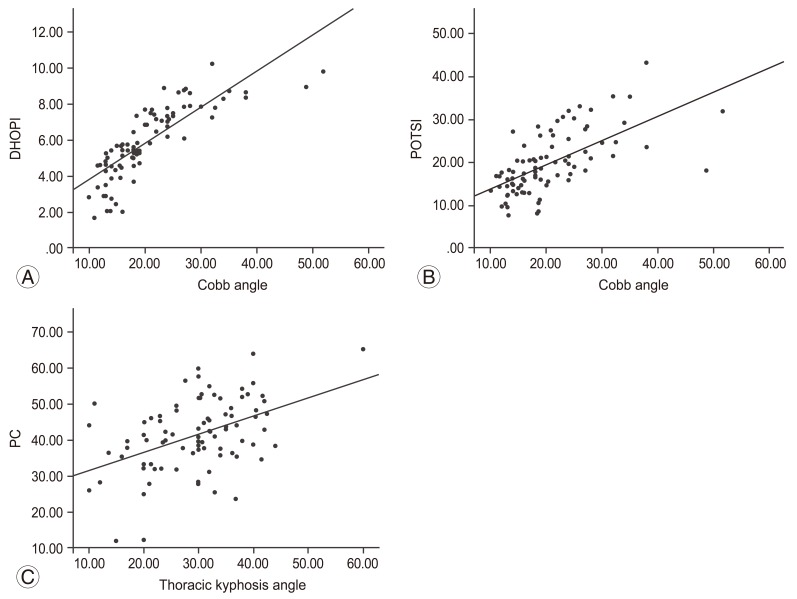
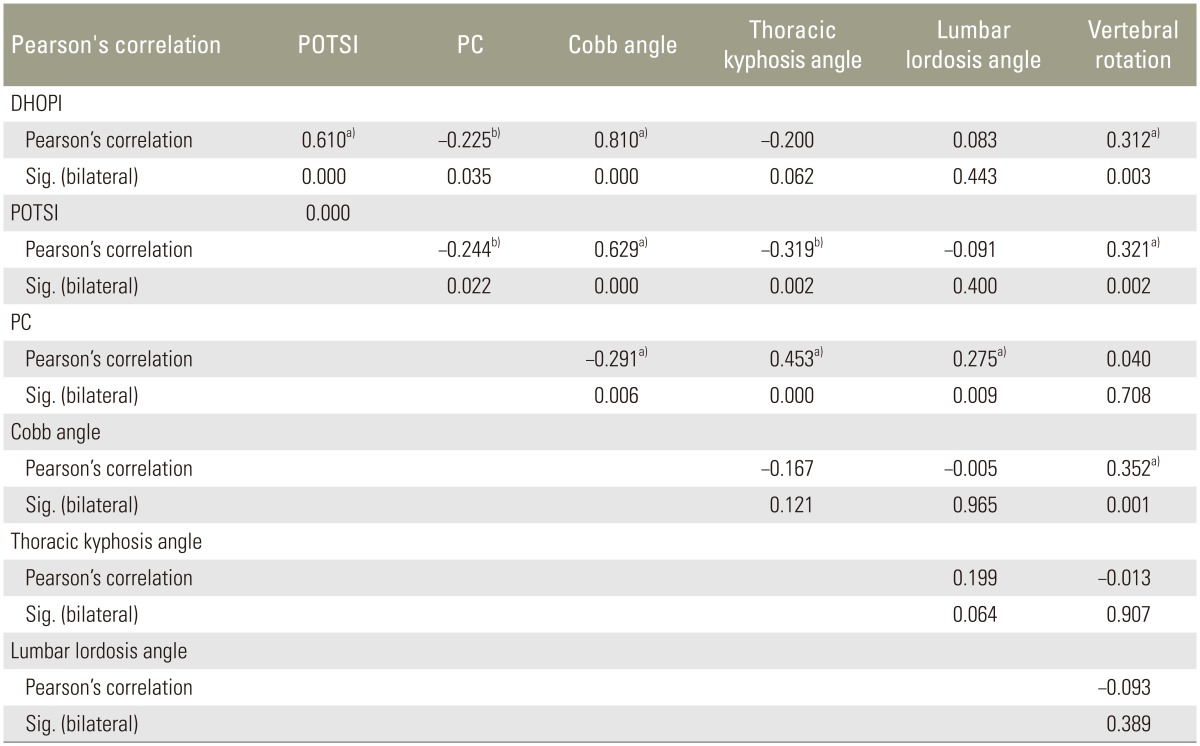
Although topographic and radiographic variables quantify different aspects of vertebral deformity, we may assume that there is some relationship between them. Pearson's correlations are summarized in Table 2. We observed that the most significant correlations (p≤0.01) were found between the Cobb angle of the main curve with DHOPI (r=0.810, p<0.001) and POTSI (r=0.629, p<0.001). Furthermore, a significant correlation (p≤0.01) was found between two topographic variables: DHOPI and POTSI (r=0.610, p<0.001), and between PC and thoracic kyphosis angle (r=0.453, p<0.001). The vertebral rotation angle was significantly correlated with DHOPI (r=0.312, p=0.003) and POTSI (r=0.321, p=0.002). Fig. 4 displays the most significant correlations between topographic and radiographic variables.
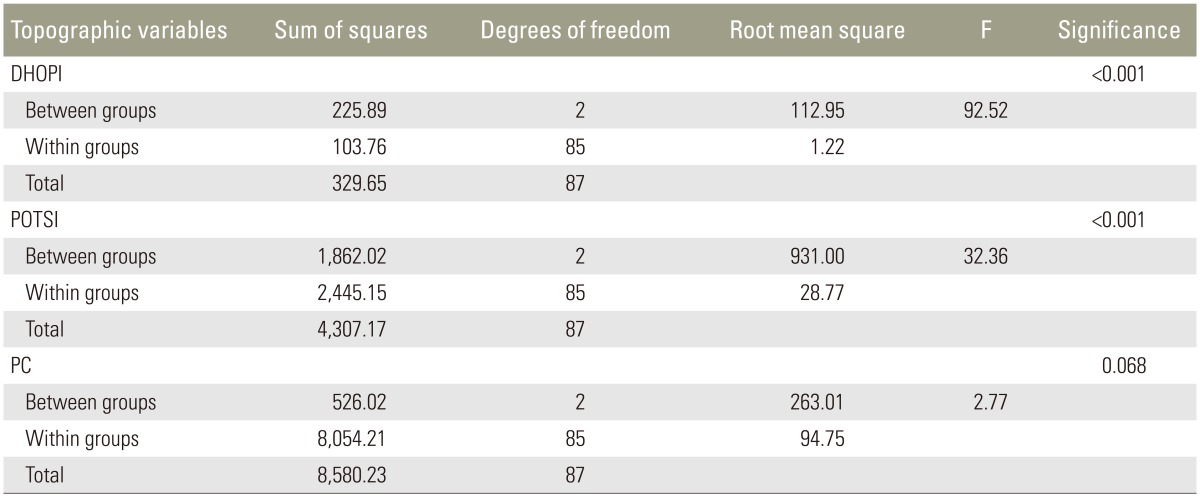
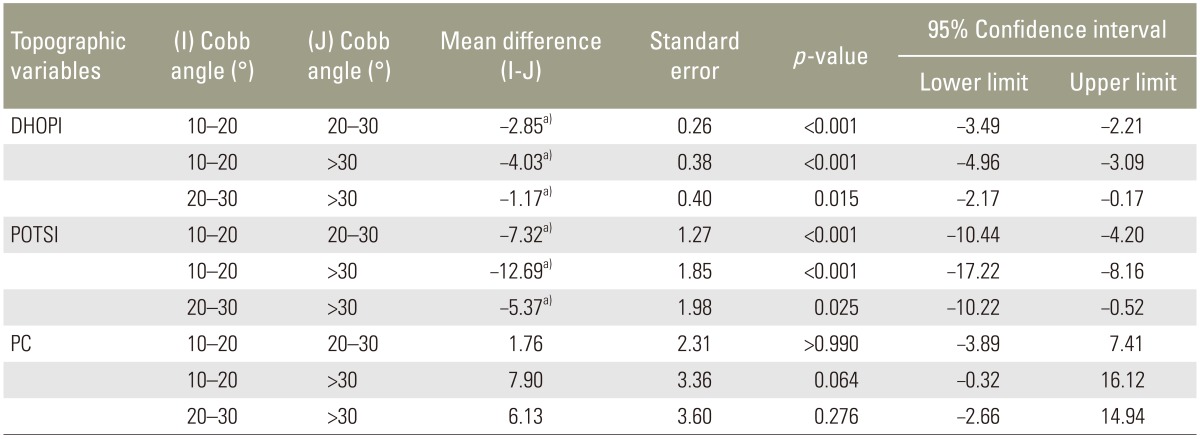
Results of the ANOVA, which compared the three groups depending on the grade of scoliosis (Table 3), indicated that there were statistically significant differences between the groups for DHOPI (F=92.52, p<0.001) and POTSI (F=32.36, p<0.001), but not for PC (F=2.77, p=0.068). The Bonferroni correction for DHOPI and POTSI variables indicated that there were statistically significant differences between the three groups (p<0.05 for all). No statistically significant differences were observed between groups for the PC variable (Table 4).
Discussion
Considerable developments in new optical methods to measure the back surface have been made in recent decades. Moiré's topography [4] is one of these pioneering techniques. These methods primarily aim to avoid the exposure of young patients to ionizing radiation. The Cobb angle, which is the gold standard test to quantify the curved lateral flexion angle in scoliosis, is not measured along three planes. Moreover, it does not take into account the cosmetic concerns regarding the asymmetry of the scapular and pelvic waist, which are present in scoliosis. Cosmetic improvement of the trunk is important to the child and his/her family after any treatment. Indeed, patients value symmetry of the external trunk rather than the radiograph that is traditionally used by physicians.
Many results have been obtained based on these techniques [1516171819]. Most studies have not found a direct correlation between topographic variables and the Cobb angle; Cobb angle prediction based on the external shape of the back therefore does not represent an absolute substitute for the X-ray. Nevertheless, it is evident that changes in the back surface show certain parallels with changes in the Cobb angle. Therefore, the magnitude of deformity, traditionally measured by the Cobb angle, can be obtained from surface topography. Frerich et al.'s [18] study using the Formetric 4D technique found a strong and statistically significant correlation with radiographs (r=0.758 in lumbar zone and r=0.872 in thoracic zone). Fortin et al. [19] also found a “good to excellent” correlation with shoulder and pelvic asymmetry for thoracic scoliosis (r=0.81–0.97), but “stable to moderate” for thoracic kyphosis, lumbar lordosis, and thoracolumbar or lumbar scoliosis (r=0.30–0.56). Berryman et al. [6], by means of ISIS2, found good correlation (r=0.84) between a topographic variable called the Lateral Asymmetry Index and the Cobb angle. Berryman suggests that the topographic method contributes additional information to radiograph studies and notes that although there is no direct linear correlation between the Cobb angle and topographic parameters, the more severe the Cobb angle is, the greater the deformity in the back surface [6].
Our results show a positive, significant correlation between the Cobb angle of the main curve and DHOPI (r=0.810) and POTSI (r=0.629) variables. A positive statistically significant correlation between these two topographic variables (r=0.610) has also been found. This is explained by the asymmetry of the frontal and axial plane that occurs in scoliosis. Furthermore, a statistically significant correlation between the degree of rotation of the apical vertebra with DHOPI (r=0.312) and POTSI (r=0.321) variables was observed herein.
The PC variable consists of the sum of three angles that measure the curvature of the back in the sagittal plane: PC1 for the upper thoracic area, PC2 for the thoracolumbar area, and PC3 for the lumbosacral area. Theoretically, the higher the thoracic kyphosis and lumbar lordosis, the greater the value of PC. Decreased thoracic kyphosis occurs commonly in scoliosis and signals a risk of curve progession. Our results showed a small, statistically significant, negative correlation between the PC variable and the Cobb angle (r=-0.291). This means that there were patients with severe scoliosis associated with a flattening of the thoracic kyphosis and with increased risk of progression. The same occurs between PC and DHOPI (r=-0.225) and between PC and POTSI (r=-0.244). In these cases, the higher the asymmetry in the coronal and axial planes, the lower the sagittal plane. Furthermore, the PC variable is positively correlated with the thoracic kyphosis angle (r=0.453) and lordosis lumbar angle (r=0.275). In the case of the lumbar lordosis angle, the lower correlation could be due to the fact that the morphology of the back at the lumbar level is dependent on not only the lumbar spine but also on the influence of other structures, such as the gluteus. Studies that focused specifically on the PC variable in other pathologies (e.g., Scheuermann's disease or hyperlordosis lumbar) would be required to demonstrate its clinical effectiveness. Three groups of subjects would be required to demonstrate whether this variable could discriminate between groups: one with thoracic hyperkyphosis/hyperlordosis lumbar; another with normal values for thoracic kyphosis angle and lordosis lumbar angle; and a third with thoracic hypokyphosis/lumbar hypolordosis. We believe that in the case of scoliosis, although DHOPI and POTSI variables seem more effective, the PC variable could serve as a complementary parameter to DHOPI and POTSI in the 3D quantification of the back and trunk asymmetry caused by scoliosis. Table 1 shows that although the difference does not reach statistical significance (p=0.068), the mean value of PC is lower in the more severe than in the milder scoliosis group. This indicates that the PC variable could also contribute to determining the severity and/or progression of scoliosis, since a low value can indicate increased risk of curve progression, and a high value may indicate an association between thoracic hyperkyphosis and scoliosis.Various researchers have attempted to determine which topographic parameters best correlate to vertebral deformity. According to Stokes et al. [20], axial rotation (DHOPI in our study), is the variable that best correlates with skeletal deformity. Oxborrow [21] suggests that the best deformity measure is a combination of topographic indices, combining the Suzuki Hump Sum (SHS) that quantifies asymmetry in the axial plane with POTSI in the coronal plane. Stokes suggests that the best manner to quantify vertebral deformity is the combination of three topographic variables, given that each variable represents a different plane in a 3D deformity [20]. Similarly, we believe that the best way to quantify the back deformity secondary to scoliosis is to consider the three topographical variables (DHOPI, POTSI, and PC), since each one quantifies a different plane of space.
Finally, we can conclude that our topographic method can differentiate between different degrees of scoliosis according to the Cobb angle. The grouping of subjects was made considering that patients with a Cobb angle less than 20° (mild curves) generally require observation only and no treatment; those with a Cobb angle of 20°–30° have moderate curves that usually require treatment with a brace; and those with a Cobb angle greater than 30° have more severe curves that could progress and eventually require surgical treatment. Lower values of DHOPI and POTSI were detected in scoliosis cases with Cobb angles less than 20° and the highest values of these variables were detected in scoliosis cases with a Cobb angle greater than 30° (a statistically significant difference). These differences in topographical variables between groups with differing Cobb angle degrees could be of clinical importance in decision-making regarding the treatment of scoliosis, depending on the magnitude of back asymmetry.
It must be acknowledged that most patients in our study had mild to moderate scoliosis curves (Cobb angles <30°). The three most serious cases had Cobb angles of 51°, 48°, and 38°, respectively. For this reason, future studies with a larger number of patients who have more severe scoliosis curves might lead to more accurate results. Another limitation of the current study was that our patient sample was heterogeneous regarding the type of scoliosis curve (single vs. double; lumbar, thoracic, and thoracolumbar). Despite this heterogeneity regarding curve type, a good correlation between DHOPI-POTSI and Cobb angle was shown. This is interesting because it opens the door to future studies with more homogeneous groups of patients in terms of curve characteristics; these studies could determine which types of curves show greater correlation between radiographic and topographic parameters.
There seem to be concerns regarding the required time and cost effectiveness of the topographic method. Regarding time effectiveness, initial calibration with the white screen takes about 40 seconds and is only performed at the beginning of the session. Taking two images of the patient's back takes about 15 seconds, and image processing takes about 4 minutes. In a study of the time effectiveness of a 3D telediagnostic postural screening of scoliosis [22], the average examination time per subject ranged from 2 minutes 43 seconds to 4 minutes 51 seconds; our method falls within a similar range. Regarding radiographic assessment, taking both radiographic views may take about 20 seconds; however, in our hospital, digitized images do not appear in the computer until about 10 minutes later.
Currently, a radiographic method called the EOS 2D/3D X-ray imaging system uses slot-scanning technology to produce a high-quality image with less radiation than standard imaging techniques. However, the health benefits estimated from EOS as a result of radiation dose reductions are very small and the higher price of the EOS equipment does not render it cost effective. Set-up costs (i.e., complete system, staff training, and installation costs) of digital radiography are around 29,400 €, the yearly maintenance costs are 29,380 €, and recurring (software upgrades) costs are 2,350 €. Set-up costs for EOS are around 470,080 €, yearly maintenance costs are 37,606 €, and recurring costs (e.g., X-ray tube) are 29,380 € [23]. According to Melhem et al. [24], basic costs of the EOS machine with its corresponding software for acquisition, 2D processing and 3D reconstruction, equal around 500,000 €. Therefore, the cost estimate for EOS system is of 598,176 €=636,543 USD. In contrast, our topographic method is inexpensive. One the researcher has the system components (cost estimate of 2,200 €=2,341 USD), repeated and indefinite measurements can be obtained without further cost.
Therefore, although a perfect linear correlation does not exist between the Cobb angle and our topographic parameters, it has been observed that the more severe is the Cobb angle, the greater the deformity in the back surface. Drerup [25] suggests that surface topography provides reliable and consistent results that may be used to reduce X-ray exposure, but the correlation of shape parameters with the radiological Cobb angle is poor.
Conclusions
Although back surface topography cannot substitute radiography for the diagnosis of scoliosis, since significant correlations between radiograph and topographic parameters were found, we conclude that this method offers additional quantitative data that may complement radiologic study. In addition, it may be useful in the follow-up of scoliosis patients, as it avoids unnecessary exposure to radiation, and is a harmless procedure that can be applied repeatedly. Further studies with a larger sample size and longer study duration are necessary to determine the effectiveness of this back topographic method as a monitoring test for scoliosis.