Influence of Diabetes Mellitus on Surgical Outcomes in Patients with Cervical Myelopathy: A Prospective, Multicenter Study
Article information
Abstract
Study Design
Multicenter, prospective study.
Purpose
To investigate the effects of diabetes mellitus (DM) on surgical outcomes in patients with cervical myelopathy.
Overview of Literature
To date, few studies have investigated the influence of postoperative blood glucose or glycated hemoglobin (HbA1c) levels on surgical outcomes.
Methods
The participants were patients who underwent surgery for the treatment of cervical spondylotic myelopathy and ossification of the posterior longitudinal ligament. The 61 cases were evaluated preoperatively and 1 year postoperatively using the Japanese Orthopaedic Association (JOA) scores and the JOA Cervical Myelopathy Evaluation Questionnaire (JOACMEQ). The study variables included fasting blood glucose and HbA1c levels measured preoperatively and at 1 week, 4 weeks, and 1 year postoperatively; the F-wave conduction velocity, latency, rate of occurrence, and M-wave latency in the ulnar and tibial nerves were measured preoperatively and at 1 year postoperatively. The patients were divided into a group without diabetes (N group, 42 patients) and a group with diabetes (DM group, 19 patients). We then assessed the associations between the surgical outcomes and each of the study variables.
Results
JOA scores significantly improved in both groups; however, no significant between-group differences were found. There was no significant improvement in the JOACMEQ scores, which assessed cervical function, upper and lower limb function, and bladder function in both groups. We then subdivided the DM group into those with a good control of HbA1c after 1 year (DMG group, 12 patients) and those with HbA1c deterioration after 1 year (DMB group, seven patients), prior to comparing the surgical outcomes. The JOACMEQ scores for upper and lower limb function significantly improved in the DMG group (p<0.01). Compared with the DMB group, there were no significant increases in upper or lower limb function scores in the DMG group.
Conclusions
Poor glycemic control might prevent postoperative functional recovery of the spinal cord.
Introduction
Cervical spondylotic myelopathy (CSM) is generally observed in adults aged >50 years [1,2]. Common symptoms include numbness in the upper extremities (UE) and lower extremities (LE), bilateral impairments in dexterity, spastic gait disturbances, and bladder and bowel dysfunction. Treatment for CSM is well established; however, there are several risk factors for poor surgical outcomes. A previous study reported that the prevalence of diabetes mellitus (DM), hypertension, hyperlipidemia, and the use of anticoagulant and/or antiplatelet agents could affect cervical laminoplasty outcomes [3]. Associations between DM and surgical outcomes in patients with CSM have been reported in several recent publications [3-6].
Dokai et al. [5] has reported that patients with DM and CSM exhibited a poorer recovery of sensory function in the LE and an overall poorer recovery ratio (RR). Furthermore, Nakanishi has proposed that disruptions in microvascular structures that result from DM influence CSM outcomes [7].
DM is a frequent comorbidity that affects many organs and causes numbness and weakness in the extremities due to peripheral nerve damage. The effects of DM on the peripheral nervous system and microvasculature are of concern.
Surgeons must consider issues surrounding DM control during the perioperative period. Previous reports have indicated that preoperative glycated hemoglobin (HbA1c) and blood sugar levels affect surgical outcomes in patients with CSM. However, few studies have examined the influence of postoperative blood glucose or HbA1c levels on surgical outcomes. Our study investigated the effects of DM on surgical outcomes in patients with CSM by assessing DM control postoperatively.
Materials and Methods
We performed a prospective multicenter study at Tottori University Hospital, comprising eight hospitals in and around the Tottori Prefecture in Japan from 2012 to 2015.
Informed consent was obtained from all participants. Inclusion criteria were patients who underwent surgical treatments for CSM and ossification of the posterior longitudinal ligament. We used magnetic resonance imaging (MRI) to determine the compression level and regarded the compression level with cord intensity change at T2WI. If cord intensity changes were never determined, we considered the level of most severe stenosis within the cervical spine as the origin of the myelopathy.
All the patients underwent laminoplasty or anterior decompression and fusion at the discretion of the spinal surgeon at each institution. Exclusion criteria were (1) past history of cervical spine surgery; (2) congenital deformity of the cervical spine; (3) infection; (4) trauma; (5) tumor; (6) rheumatoid arthritis; (7) cervical palsy; (8) pacemaker treatment; and (9) paralysis without cervical disorder. The patients were divided into two groups: a group without diabetes (N group) and a group with diabetes (DM group). DM was diagnosed if any or all the following criteria were met, as defined by the Japan Diabetes Society: (1) fasting blood sugar >126 mg/dL, (2) causal blood sugar over 200 mg/dL; (3) blood sugar over 200 mg/dL under 2 hours 75 g, and oral glucose-tolerance test; and (4) HbA1c over 6.5%.
The patients diagnosed with diabetic mellitus were treated with intensive blood sugar control by a doctor of internal medicine during the perioperative period. This study was approved by the local ethics committee of the Faculty of Medicine, Tottori University (IRB approval no., 1824).
1. Surgical outcomes
The Japanese Orthopaedic Association (JOA) [8] and the Japanese Orthopaedic Association Cervical Myelopathy Evaluation Questionnaire (JOACMEQ) [9] scores were obtained to measure surgical outcomes preoperatively and at 1 year postoperatively. We calculated the RR as follows [10]: RR (%)=(postoperative JOA score−preoperative JOA score)/{17 (fullmark)−preoperative JOA score}×100.
2. Patient characteristics
Patient characteristics recorded included sex, age, height, weight, body mass index, and disease duration.
3. Diabetes mellitus
We evaluated fasting blood glucose (FBG) and HbA1c levels via routine blood testing preoperatively and 1 week, 4 weeks, and 1 year postoperatively.
4. Electrophysiological evaluation
M- and F-waves were recorded from the ulnar and tibial nerves. Surface recording electrodes were placed bilaterally on the abductor digiti minimi and abductor hallucis muscles. Stimulations were delivered from the proximal elbow to the ulnar nerve and from the popliteus to the tibial nerve. The peripheral conduction time (PCT) was calculated using Kimura’s method [11]. The PCT, excluding the turnaround time at the spinal motor neuron (1 ms), was calculated from the compound muscle action potential and F-waves as follows: (M-wave latency+Fwave latency−1)/2.
These assessments were performed preoperatively and 1 year postoperatively.
5. Statistical analysis
All the data are expressed as mean±standard deviation. The statistical analyses were performed using StatMate ver. 5.0 for Windows and Mac (ATMS Co., Tokyo, Japan). Differences between groups were determined using Pearson’s chi-square test, Fisher’s exact test, and the Mann–Whitney U-test. We performed Fisher’s exact test when the expected cell size was <5. The Mann–Whitney U-test was used for comparing JOA scores between groups. We compared PCT data between the two groups using Welch’s t-test.
Between-group differences in FBG and HbA1c levels were compared using paired t-tests. Correlations between the RR of the JOA score and FBG and HbA1c levels were estimated using the Pearson correlation coefficient (r). The Mann–Whitney U-test was used to compare JOA scores between the groups. After excluding patients whose pretreatment and post-treatment scores were ≥90 points from the analysis according to a previous report on the JOABPEQ [9], the Wilcoxon signed-rank test was used to determine categorical changes within the JOACMEQ scores in each group. The results were considered to be significant when p<0.05.
Results
1. Patients
A total of 148 participants were registered. A total of 140 patients were included during the 3-year study period. Seventy-nine of these patients were excluded: 66 for missing values at the 1-year follow-up, two patients died, two patients suffered from lumbar spinal stenosis, two patients had spinal injuries, one patient had cerebrovascular disease, one patient was diagnosed with bile duct cancer, one patient was diagnosed with a vitamin B12 deficiency postoperatively, and four patients failed to present for the 1-year follow-up appointment, resulting in 61 evaluable patients. The patients were then divided into two groups: a group without diabetes (N group, 42 patients) and a group with diabetes (DM group, 19 patients). The characteristics of the N and DM groups are presented in Table 1. There were no significant between-group differences.

Patient characteristics and demographics
We also divided the DM group into two subgroups according to HbA1c levels over the preoperative period and the levels at the 1-year follow-up, in order to investigate the effects of HbA1c levels on surgical outcomes. The DMG group (n=12) consisted of individuals with good DM control at the 1-year follow-up. The DMB group (n=7) consisted of patients with DM control deteriorations at the 1-year follow-up (Fig. 1).
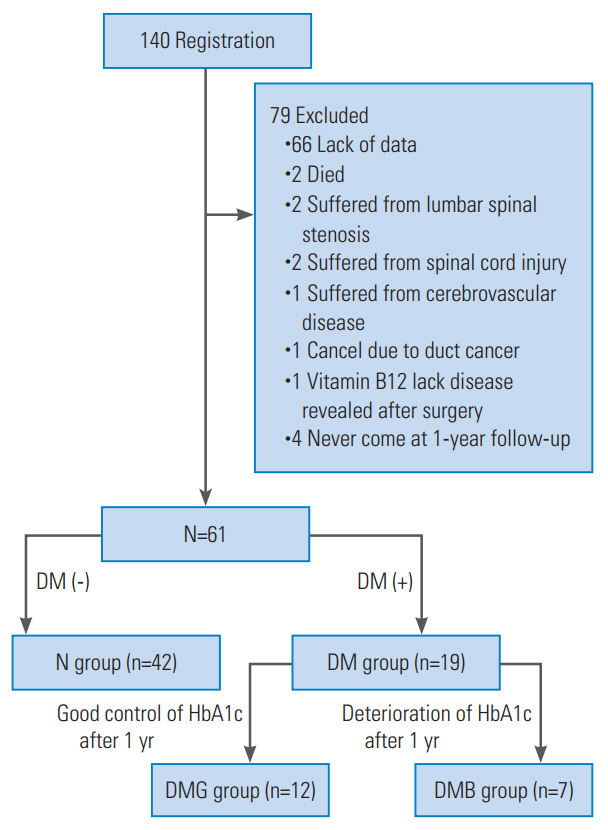
Study flowchart. N group: a group without diabetes; DM group: a group with diabetes; DMG group: those with a good control of HbA1c after 1 year; DMB group: those with HbA1c deterioration after 1 year. DM, diabetes mellitus; HbA1c, glycated hemoglobin.
2. Diabetes mellitus control from the preoperative period until the 1-year follow-up
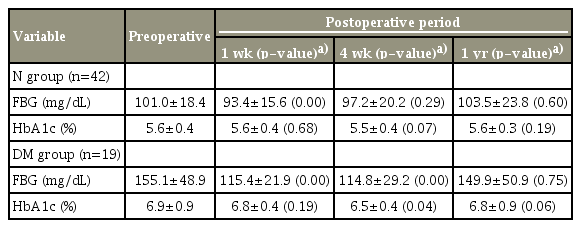
FBG and HbA1c level changes are shown in Table 2. In the N group, FBG levels significantly decreased at 1 week compared with the preoperative value. FBG levels at postoperative week 4 and at 1 year did not significantly change relative to the preoperative values. HbA1c levels did not significantly change between the preoperative and postoperative visits. Although FBG levels significantly improved at 1 and 4 weeks postoperatively, FBG levels at 1 year postoperatively were not significantly different from the preoperative values. The HbA1c levels were significantly decreased only at 4 weeks postoperatively.
Changes in FBG and HbA1c levels
3. Surgical outcomes based on the Japanese Orthopaedic Association scores
JOA scores significantly improved in both groups postoperatively (N group, p<0.01 and DM group, p=0.01). The RR was 40.1 in the N group and 26.3% in the DM group; between-group differences were not significant (Table 3).

Surgical outcomes as assessed on the basis of the JOA scores between the N and DM groups
4. Correlations between glycated hemoglobin and recovery ratio
To determine whether reduced HbA1c levels correlated with surgical outcomes, we analyzed the relationship between HbA1c levels and RR in all cases. There was no correlation throughout the study period (Table 4).

Correlations between hemoglobin A1c and recovery ratio levels
5. Surgical outcomes based on the Japanese Orthopaedic Association Cervical Myelopathy Evaluation Questionnaire scores
The surgical outcomes with JOACMEQ are shown in Table 5. Postoperatively, UE and LE functions in the N group significantly improved. In the DM group, LE function improved significantly, and UE function tended toward improvement (p=0.051). There were no significant between-group differences for each parameter of the effective value.

Surgical outcomes as assessed on the basis of the JOACMEQ scores between the N and DM groups
6. Characteristics of the DMG and DMB groups
The ratio of males to females was higher in the DMG group than in the DMB group. There were no significant physical differences between the groups. Bowel and bladder disturbances were observed more frequently in the DMG group than in the DMB group (Table 6).

Characteristics and demographics of the DMG and DMB groups
7. Surgical outcomes based on the Japanese Orthopaedic Association scores between the DMG and DMB groups
JOA scores were significantly improved in both groups postoperatively (DMG group, p<0.03; DMB group, p<0.02). The RR was 30.1% in the DMG group and 19.8% in the DMB group. The RR did not significantly differ between the two groups (Table 7).
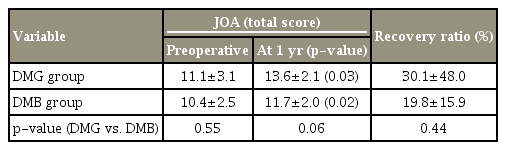
Surgical outcomes between the DMG and DMB groups as assessed on the basis of the JOACMEQ scores
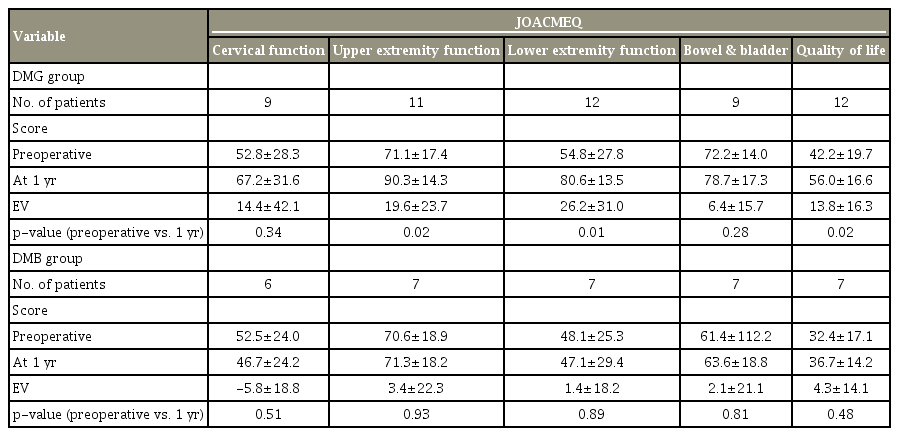
8. Surgical outcomes based on the Japanese Orthopaedic Association Cervical Myelopathy Evaluation Questionnaire scores between the DMG and DMB groups
The DMG group exhibited less improvement in UE and LE surgical outcomes (Table 8).
Surgical outcomes between the DMG and DMB groups as assessed on the basis of the JOA scores
Discussion
We evaluated surgical outcomes associated with CSM. Surgical outcomes based on JOA scores were not significantly different between the N and DM groups. Furthermore, there were no significant differences relative to DM control. In fact, with respect to the RR with JOA, there were no significant differences between the N and DM groups and between the DMG and DMB groups with respect to the presence of DM. Poor glycemic control affected CSM surgical outcomes as indicated by the JOACMEQ evaluation. We conclude that poor DM control impaired surgical outcomes in patients with CSM. Previous studies have reported that preoperative HbA1c levels affected recovery after CSM surgery [4,5]. DM is a risk factor for poor lumbar and cervical spinal surgery outcomes [12-15]. However, previous studies have focused only on the presence of DM, not on postoperative DM control.
DM affects outcomes of all types of spinal surgeries, yet most studies do not include postoperative DM control. The between-group differences in surgical outcomes in our study and in previous studies might be explained by conditional differences in patients with DM.
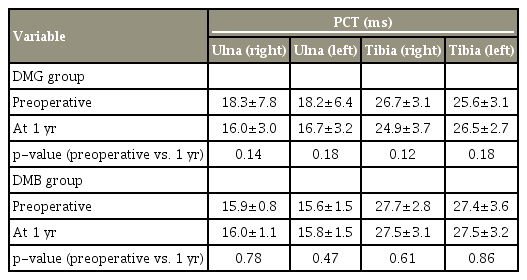
Diabetic neuropathy is one of the main factors in the diagnosis of patients with myelopathy. Nakanishi et al. [7] reported that the PCT of UE and LE were affected in patients with DM and CSM. This same study mentioned the possibility of DM causing peripheral nerve dysfunction, thereby affecting surgical outcomes. Generally, initial changes associated with diabetic neuropathy include extension of tibial F-wave latency [16,17]. In this study, no cases exhibited clear extension of F-wave latency. There were no significant differences between preoperative and postoperative PCTs in the DM group.
Patients with poor DM control often experience poorer recovery postoperatively than patients with good DM control. However, our results showed that peripheral disorders associated with DM did not directly affect surgical outcomes.
We could not identify the mechanism(s) by which DM was associated with CSM; however, we consider two theories relevant. The first of these involves DM-linked microangiopathy. Microangiopathy interferes with nutrient diffusion through the vertebral endplate, potentially leading to disk degeneration [12]. It is possible that DM angiopathy, therefore, interferes with nutrient delivery to other organs, including the spinal cord. Several studies mention possible spinal cord ischemia in patients with DM [18-20]. Mawad et al. [21] evaluated 24 patients who developed signs and symptoms of spinal cord ischemia or infarction following thoracoabdominal aortic aneurysm surgery using MRI. They determined that DM was a predisposing risk factor for the development of postoperative spinal cord ischemia [21]. DM angiopathy might, therefore, affect surgical outcomes.
Our second theory involves DM myelopathy. Following a post-mortem study, Reske-Nielsen and Lundbaek [22] have reported that patients with type 1 DM exhibited cranial nerve demyelination. There are other reports that describe a possible association between DM and central cord demyelination, axonal loss, and gliosis [23,24].
Selvarajah et al. [25] have investigated the relationship between spinal cord atrophy and neurophysiological assessments among patients with DM by measuring the diameter of the spinal cord with MRI. Spinal cord atrophy is observed in patients with DM regardless of the presence or absence of diabetic peripheral neuropathies [25]. Although DM-related cervical cord atrophy is a potential factor, it is difficult to preoperatively measure the cord diameter using MRI in patients with severe stenosis. In any case, poor control of DM appears to be a risk factor for microangiopathy and nervous system injury [26-28].
The 6.5-year Diabetes Control and Complication Trial in the United States divided patients with DM into two groups. The first group included patients receiving ‘typical’ DM therapy. The average HbA1c level in this group during the study was approximately 9.0%. The other group of patients received strictly controlled DM therapy. The average HbA1c level in this group during the study was approximately 7.0%. The prevalence of DM neuropathy was 13% among the patients receiving typical DM therapy and 5.0% among those receiving a stricter DM therapy at the end of this trial. DM control, therefore, appears to be important for preventing complications associated with DM, including neuropathy and angiopathy [29,30]. In this study, all the patients were under strict blood glucose control before surgery; after that, the patients who did not experience poorer blood glucose control exhibited good surgical outcomes. We believe that we can achieve good surgical outcomes in patients with CSM by enacting strict glycemic controls both preoperatively and postoperatively.
This study has several limitations. First, many patients were excluded because of a lack of data, particularly regarding HbA1c levels or PCT values at the 1-year follow-up. Second, we investigated only FBG and HbA1c levels during the perioperative period and at 1 year postoperatively. We did not record glycemic control between these time points. Despite these limitations, we believe that strict control of DM is necessary for achieving good longterm outcomes.
Conclusions
Postoperative improvement in CSM varies in association with control of DM symptoms during the preoperative and postoperative periods. We believe that poor glycemic control might prevent postoperative functional recovery of CSM.
Notes
No potential conflict of interest relevant to this article was reported.