Local Sagittal Alignment of the Lumbar Spine and Range of Motion in 627 Asymptomatic Subjects: Age-Related Changes and Sex-Based Differences
Article information
Abstract
Study Design
Prospective cohort imaging study.
Purpose
This study aimed to evaluate lumbar sagittal alignment and range of motion (ROM) using radiographs in a large asymptomatic cohort and identify sex-based differences and age-related changes in the subjects.
Overview of Literature
Several researchers have tried to establish normal alignment and kinematic behavior of the lumbar spine, using plain radiographs. Few studies have employed a large and sex-and age-balanced cohort.
Methods
Total 627 healthy volunteers (at least 50 males and 50 females in each age decade, from the 3rd to the 8th decade) underwent whole spine radiography in the standing position; lumbar spine radiography was performed for all subjects in the recumbent position. Lumbar lordosis (LL, T12–S1) and ROM during flexion and extension were measured using a computer digitizer.
Results
The mean LL was 36.8°±13.2° in the recumbent position and 49.8°±11.2° in the standing position. The LL was greater in the standing position than in the recumbent position; further, LL was higher in females as compared to that in males. Local lordosis at each disk level increased incrementally with distal progression through the lumbar spine in both the positions. Local lordosis at L4–S1 was 29.8°±8.0° in the recumbent position and 34.2°±8.3° in the standing position and occupied 85.1% and 70.8% of the total LL, respectively. However, local lordosis in the standing position decreased with age at L2–3, L3–4, and L4–5 levels. Total lumbar ROM (T12–S1) decreased with age. The ROM in females was higher than that in males.
Conclusions
We established the standard value and age-related changes in the lumbar alignment and ROM in each age decade in asymptomatic subjects. These data will be useful and provide the normal values for comparison in clinical practice to identify sex-based differences and age-related changes.
Introduction
The pelvis and spine can be considered as a linear chain connecting the head to the pelvis in the sagittal plane for the maintenance of a stable posture with minimum energy expenditure [1-3]. The normal and stable orientation of the pelvis in relation to the spine may be disturbed in patients with spinal disorders, such as spondylolisthesis, lumbar disk degeneration, and spinal deformity [4,5]. The degenerative aging process; postural changes (standing and lying down); and surgical treatments, such as instrumentation, might affect sagittal alignment and profile of the lumbar spine [6-10].
In recent years, many authors have emphasized the importance of spinal sagittal balance and investigated these parameters in healthy subjects [3,5,11-16]. Recently, Lafage et al. [17] have reported the fundamental role of the pelvis as the main regulator of a chain of correlation between the spine and lower limbs and sagittal evaluation. They proposed a classification system wherein they gave more importance to the following three spinopelvic parameters: pelvic tilt, sagittal vertical axis, and the relationship between pelvic incidence (PI) and lumbar lordosis (LL), expressed as PI minus LL [17]. PI–LL is an important parameter for the prediction of health-related quality of life following reconstructive surgery [18]. PI is considered an inherent value for each individual, unaffected by body posture [13]. Therefore, LL is the only value that a spine surgeon can manipulate during surgery. The LL can be changed by altering the posture (standing, sitting, and lying down). However, currently, the optimum sagittal alignment is determined based only on standing radiographs.
In order to perform various daily activities smoothly, a decent range of motion (ROM) of the lumbar spine is required [8,19]. Degenerative changes, such as spondylosis, could decrease lumbar ROM and may limit a patient’s ability to perform daily routine activities. Surgical treatments for lumbar disorders are designed to reestablish normal alignment, reduce neurologic symptoms, and reduce low back pain. However, surgical procedures that use the fusion technique must induce limitation of the ROM in the lumbar spine [4,20]. Motion-preserving technologies, such as artificial disk replacement, are considered potential alternatives to conventional fusion surgeries for the maintenance of ROM [21,22]. The kinematics of postural changes and the aging process of lumbar ROM remain unclear.
Thus far, several researchers have tried to establish the normal alignment and kinematic behavior of the lumbar spine using plain radiographs [3-5,9,11-14,23]. Majority of these radiography studies were performed only in the standing position, and few studies have used a large, age- and sex-balanced cohort. The aging process and sex-based differences in lumbar sagittal alignment and ROM were not demonstrated in detail in these studies. If such extensive data are obtained, the treatment strategy can be customized as per the age decade and sex of the subject. Therefore, the objective of the current study was to investigate normal lumbar sagittal alignment, its postural change during the recumbent and standing positions, and the ROM in the lumbar spine in >600 asymptomatic volunteers. We also aimed to conduct a detailed examination regarding the sex-based differences and age-related changes in these subjects.
Materials and Methods
Healthy Japanese volunteers were recruited after the study purpose was officially announced and approval was obtained from the institutional review board of Chubu Rosai Hospital (IRB approval no., 2009-2). Written informed consent was obtained from all subjects. The exclusion criteria included symptoms related to sensory or motor disorders, such as numbness, clumsiness, motor weakness, and gait disturbances; severe low back pain; a history of spine trauma and congenital spine deformity; a history of brain or spinal surgery; and comorbid neurologic diseases, such as cerebral infarction and neuropathy. Pregnant females and individuals who received worker’s compensation or presented with symptoms after a motor vehicle accident were also excluded. Subjects for whom the radiograph measurements of sagittal parameters were difficult to assess due to lumbosacral transitional anomalies or spinal malformation were also excluded. Finally, 627 asymptomatic subjects with appropriate images were enrolled; the study population included at least 50 subjects from each sex and each age decade (form the 3rd to the 8th decade) (Table 1).
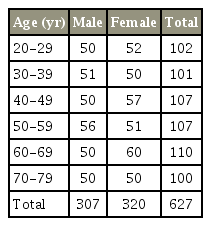
Patient characteristics, age and sex distribution
Full length, free-standing spine radiographs with fists on the clavicles were obtained for all the subjects. Further, anteroposterior (AP), lateral, flexion-extension radiographs of the lumbar spine were taken with the patient in the recumbent position.
All the images were transferred to a computer as Digital Imaging and Communications in Medicine data. Local alignment at each disk level from T12 to S1 was measured in both, the recumbent and the standing positions. LL (T12–S1) was also calculated. Total, flexion, and extension ROMs were also calculated in the recumbent position (Fig. 1). Each parameter was measured by experienced radiation technologists under the supervision of a certified spine surgeon, using imaging software (Osiris4; Icestar Media Ltd., Essex, UK) as in a previous report [24].
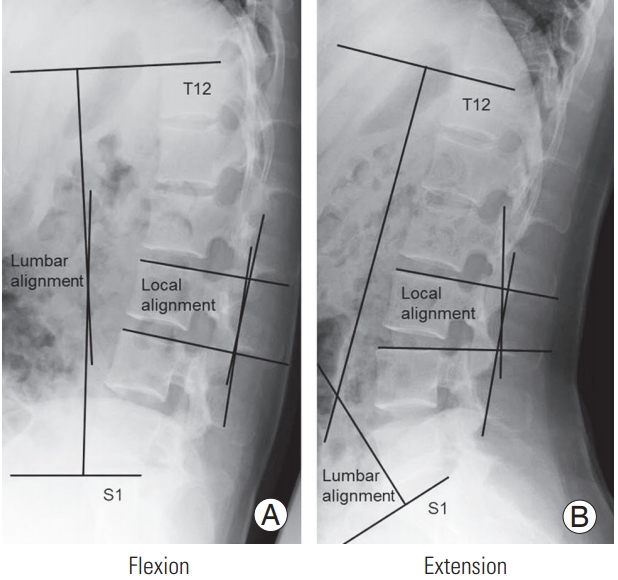
Lumbar and local alignment during flexion (A) and extension (B) in the recumbent position.
The data were analyzed using the SPSS ver. 13.0 software (SPSS Inc., Chicago, IL, USA). Descriptive statistics were calculated for the total study population and for the male and female population; mean and standard deviation (SD) values were determined. Comparisons between the male and female subjects were performed using un-paired Student t-tests. Statistical significance was set at p<0.05.
Results
The average height and weight (mean±SD values) of the male subjects were 169.1±6.5 cm and 66.8±10.3 kg, respectively, while those of the female subjects were 156.2±6.0 cm and 52.9±8.0 kg, respectively.
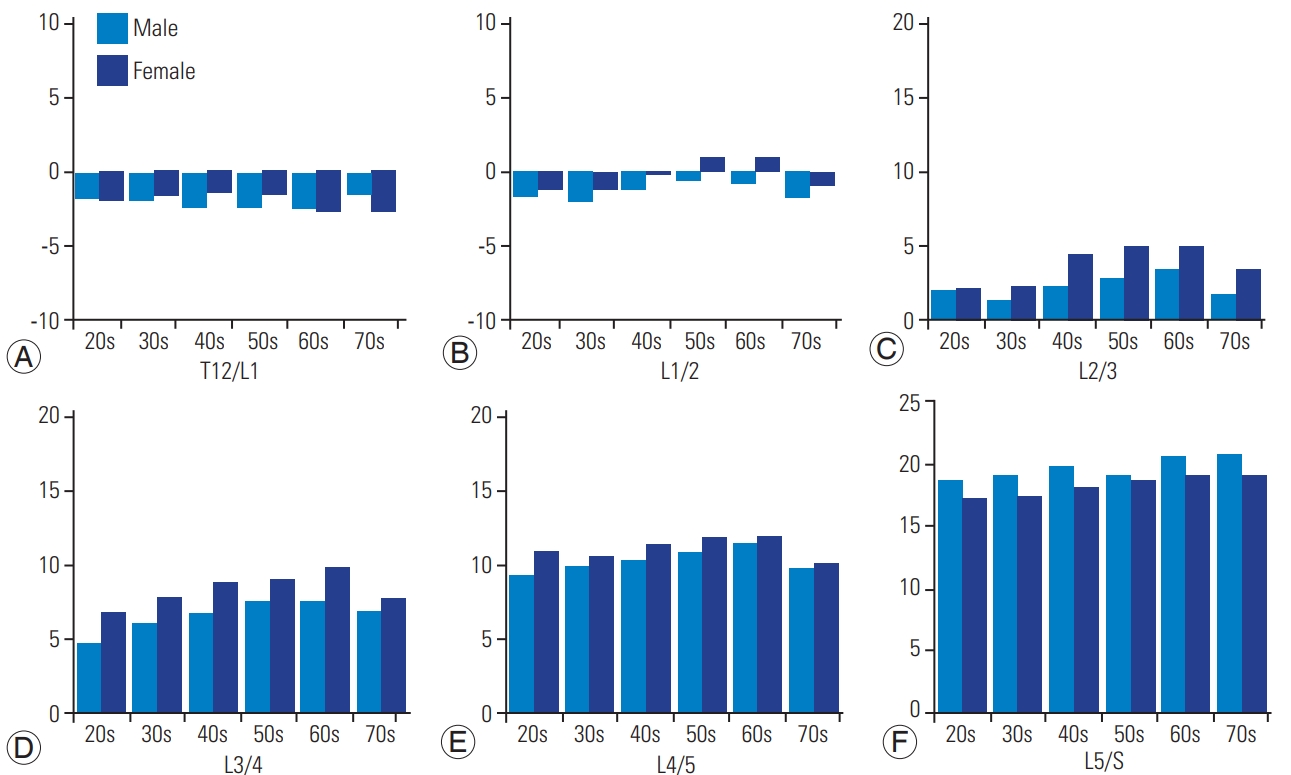
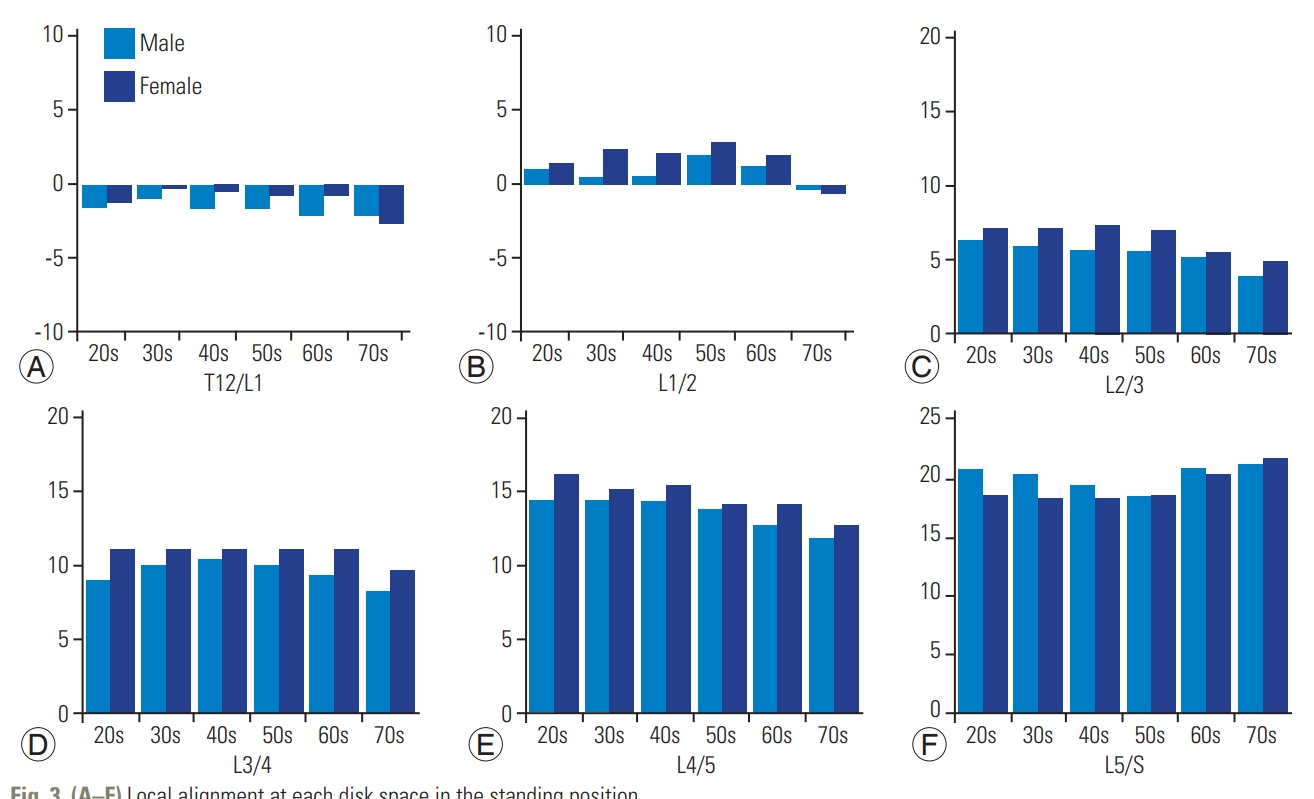
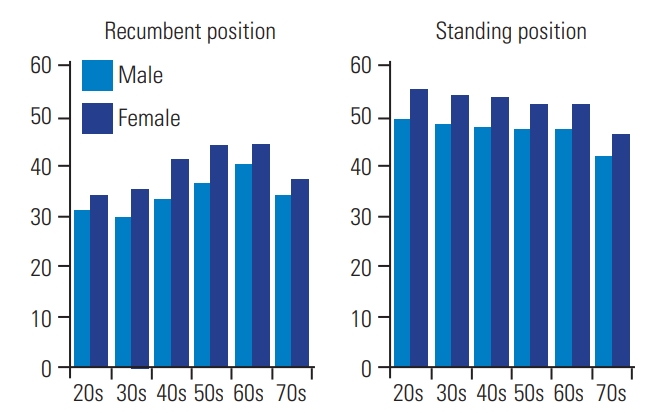
The average LL in the study population was 36.9°±12.9° (mean±SD) in the recumbent position and 49.8°±11.1° in the standing position (Table 2). The LL in the female subjects was larger than that in the male subjects in both, the standing and recumbent positions. Local lordosis at each disk level increased incrementally with distal progression through the lumbar spine in both, the recumbent and standing positions. Lordosis at each disk level increased with age in the recumbent position; however, there was a sudden drop in the 8th age decade (Figs. 2, 3). However, in the standing position, lordosis decreased with age at the L2–3, L3–4, and L4–5 levels. Lordosis in the standing position was higher than that in the recumbent position at each disk level (Fig. 4). Moreover, lordosis was larger in females than in males at all disk levels (Fig. 5). Local lordosis at L4–S1 was 29.8°±8.0° in the recumbent position and 34.2°±8.3° in the standing position; further, it occupied 85.1%±25.6% and 70.8%±18.8% of total LL in each position (Table 3). The ratio of L4–S lordosis/T12–S lordosis was higher in males than in females (91.1% versus 80.1%) in the recumbent position as well as in the standing position (74.4% versus 67.5%).

Lumbar lordosis, range of motion, and sex-based differences
(A–F) Local alignment at each disk space in the recumbent position.
(A–F) Local alignment at each disk space in the standing position.
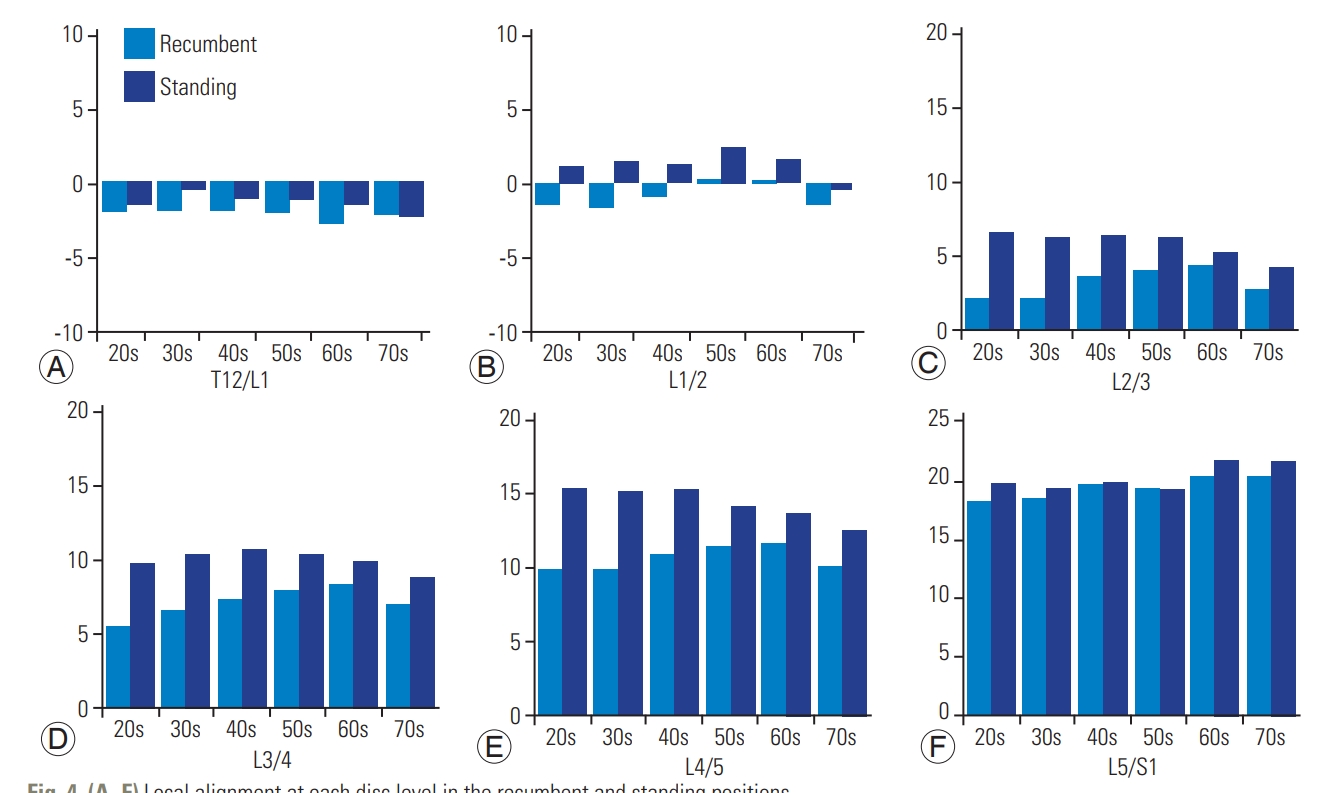
(A–F) Local alignment at each disc level in the recumbent and standing positions.
Lumbar lordosis in each age decade (A) in the recumbent position and (B) in the standing position.
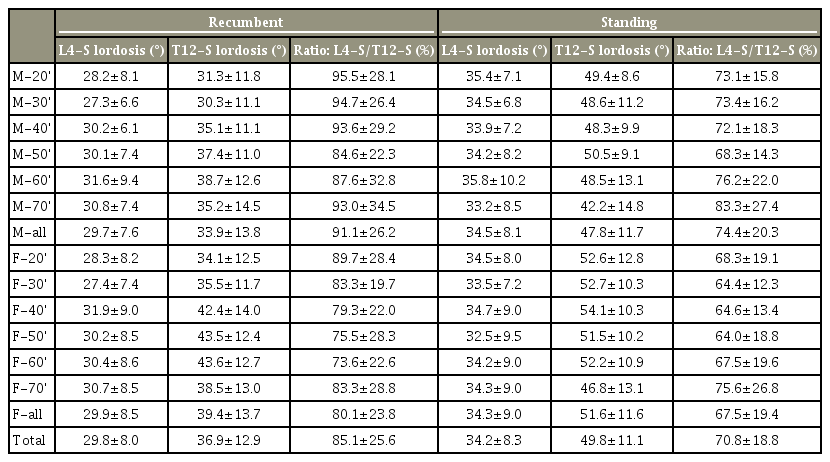
Local lordosis between L4 and S1, total lumbar lordosis (T12–S1), and its ratio (L4–S1 local lordosis/total lumbar lordosis)
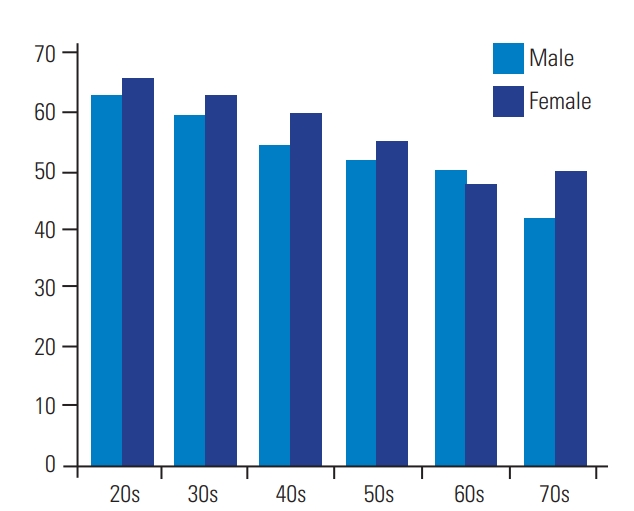
The total ROM in the lumbar (T12–S1) spine was 52.1°±17.1°, and it decreased with age (Table 2, Fig. 6). The flexion ROM was larger in the female subjects than in the male subjects (Fig. 6). The extension ROM decreased more than the flexion ROM with increasing age (Fig. 7). However, this decrease was compensated by an increase in the T12–S1 lordotic alignment until the 7th age decade (Fig. 8).
Total range of motion of the lumbar spine (T12–S1).
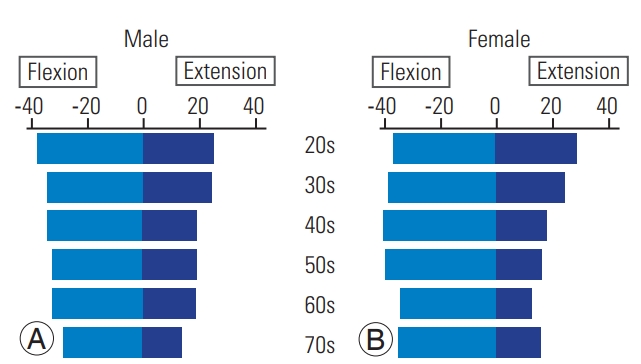
(A, B) Flexion (from the neutral position), extension (from the neutral position), and total range of motion of the lumbar spine (T12–S) in the recumbent position.
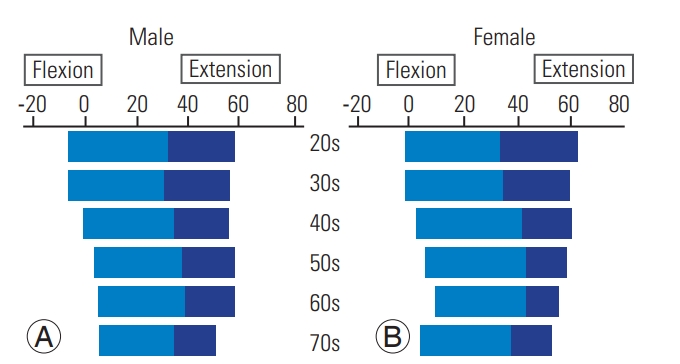
(A, B) Flexion, extension, and total range of motion of the lumbar spine (T12–S) in the recumbent position, adjusted with neutral sagittal alignment. The border shows the neutral position.
Discussion
In the present study, we aimed to investigate the lumbar spine sagittal profile in the standing and recumbent positions as well as the ROM in a large cohort of healthy subjects. Another study objective was the analyses of sex-based differences and aging-related changes in a cohort of asymptomatic volunteers with an even age- and sex distribution. We found that the average LL in the standing position was larger by 13° than that in the recumbent position. Local lordosis in the standing position was larger at each disk level than that in the recumbent position. Increase in age led to higher local lordosis at each disk level in the recumbent position until the 7th age decade. The total ROM of the lumbar spine (T12–S1) was 52.1°±17.1° and decreased gradually with age. Flexion ROM was larger in females than in males. The extension ROM decreased more than the flexion ROM with higher age.
The process of aging involves degeneration of the disk and vertebrae, thereby potentially affecting lumbar sagittal profiles, alignments, and ROMs. Detailed clinical history and physical examination are important for detecting the pathologic changes caused by aging-related degeneration. Imaging findings can be used to confirm these results. The use of computed tomography and magnetic resonance imaging has brought a huge shift in the diagnosis of lumbar diseases. Plain radiographs in the AP, lateral, and lateral flexion-extension views remain fundamental imaging studies in the diagnosis of lumbar spinal disorders. Radiographs are judged with a focus on lumbar ROM, alignment, disk space height, and abnormal instability.
Sagittal spinopelvic alignment plays a critical role in pain and disability and is a main influencing factor for the health-related quality of life measures in patients with adult spinal deformity (ASD) [4,18,25,26]. Glassman et al. [25] concluded that the restoration of ‘a more normal sagittal balance’ is the critical goal of any reconstructive spine surgery. However, the definition of what distinguishes normal from pathologic alignment in the spine remains unclear [25]. LL is a key parameter in spinal deformity surgery and can be influenced by changing the posture (standing, sitting, and lying down).
In our study, the standard values for sagittal alignment changed as per patient age. In particular, a sudden decrease was observed in LL from the 7th to the 8th age decade. It is still controversial to aim the standard alignment of all age groups or average alignment of each decade in the reconstructive surgery of ASD. Currently, we use standing radiographs alone to evaluate the spinopelvic sagittal alignment, although the standing time is much shorter than the combined total time of sitting and lying down for ordinary people. Local alignment between L4 and S1 occupied 74.4% in males and 67.5% in females of total LL during standing. In reconstruction surgery for spinal sagittal balance, we should obtain more lordosis in the lower two levels (L4/5, 5/S).
ROM of the lumbar spine decreases with age in the natural course [8,23]. Flexion ROM was less affected by age than extension ROM [27,28]. The exact mechanism of this phenomenon is unclear. In the present study, the total ROM decreased linearly with aging, and the highest reduction was observed in the extension ROM. The sagittal axis in the neutral position was not altered with aging in the male subjects; however, it shifted toward the extension direction in the female subjects. In general, older females demonstrated more thoracic kyphosis than males [29]. Thus, older females acquire greater compensatory lordosis in the cervical spine with age. A shift in the axis of the total lumbar ROM toward the extension direction may also occur as a compensatory mechanism. Following multi-level spinal fusion, adjacent spinal levels as well as the spinopelvis, hip, and knee joints would compensate for the loss of motion. However, we gradually lose spinal vicarious mechanisms with age because spinal flexibility decreases as part of the degenerative process of aging [4,20].
The mean values for LL and flexion ROM differed significantly in males and females. Some authors have demonstrated similar sex-based differences [3,12-14,30]. However, other researchers have shown contradictory outcomes [11,31]. The variations in LL and ROM observed in their studies may be attributable to the sample size.
This study has certain limitations. First, the flexion-extension radiograph was obtained in the recumbent position because it was easier for the radiation technologist to control the film positioning and obtain adequate X-rays. Second, the measurement was performed only once because the number of specific measurements and number of subjects were very huge. However, the measurements were authoritatively performed by well-experienced radiation technologists with enough knowledge of the lumbar osseous anatomy. Third, all the subjects in the present study were Japanese; therefore, these results may not be applicable to subjects belonging to other racial and ethnic groups.
The aging-related changes in sagittal lumbar alignment are gaining more importance than ever owing to the increasing number of reconstructive surgeries for ASD. A long-term follow-up study is necessary to understand the real natural history of lumbar alignment and ROM over time. However, it appears impractical to observe the aging-related changes in spinal alignment and ROM over a subject’s entire life span. Therefore, a large-scale cross-sectional observational study can be used as a substitute for longitudinal analysis. In the present study, we enrolled >600 asymptomatic volunteers, including at least 50 subjects belonging to each sex and each decade (from the 3rd to the 8th decade). This is one of the largest cohort studies on lumbar alignment and ROM, with a sex ratio of almost 1:1. We believe that the larger sample size and balanced sex- and age distribution contribute to the reliability of our results.
Conclusions
Standard values of lumbar sagittal alignment and ROM were established in each sex and each age decade (from the 2nd to the 7th age decade) in 627 asymptomatic subjects. A remarkable change was observed in the lumbar alignment of subjects in the 7th to the 8th age decade in both, the standing and recumbent positions. Local lordosis at L4–S occupied 70.8% of the total LL in the standing position. Gradual decrease in the ROM occurred with age. Greater LL and larger ROM were observed in females. These data can provide normal values for understanding the natural course of the lumbar spine and help surgical planning in clinical practice. Elderly subjects (in the 8th decade) may require special consideration while being scheduled for reconstructive spine surgery owing to their differences from younger subjects (those in the 5th, 6th, and 7th age decades).
Notes
No potential conflict of interest relevant to this article was reported.
Acknowledgements
This study was supported by institutional funds and by grant research funds, which are intended for promoting hospital functions, of the Japan Labor Health and Welfare Organization (Kawasaki, Japan).