


Introduction
The Oswestry Disability Index (ODI) and the Roland-Morris Disability Questionnaire (RMDQ) are ideal outcome instruments to assess functional outcomes; additionally, 36-item Short-Form Health Survey (SF-36) and its shorter versions such as 12-item Short-Form Health Survey (SF-12) are useful instruments to assess quality of life in patients with chronic low backache due to their established validity, reliability, and responsiveness [1]. The use of SF-12 has been recommended in clinical research to evaluate generic quality of life in spine surgery patients [2]. Although the validity of an outcome instrument is an important psychometric property, reliability and responsiveness should be weighted more in the selection of an outcome instrument [1]. Responsiveness of an outcome instrument is defined as the sensitivity of the instrument to detect clinically relevant change over a period of time [3]. However, responsiveness is a context-specific term and, thus, the resulting evidence is applicable only to that particular condition and specific intervention [4]. Many studies describing the psychometric properties of commonly used patient-reported outcome instruments have considered populations with chronic nonspecific low backache. However, Glassman et al. [5] successfully argued against the use of nonspecific low backache and demonstrated differences in ODI score and SF-36 had differing baseline scores, postoperative scores, values of improvement, and pattern of improvement or deterioration when evaluating long-term follow-up for various conditions such as spondylolisthesis, scoliosis, lumbar disc pathology, instability, and lumbar spinal stenosis.
To date, no studies have been published on the comparative responsiveness of ODI, RMDQ, SF12 PCS, and SF12 MCS in patients who underwent discectomy for lumbar disc herniation. Therefore, the purpose of the study was to evaluate and report the comparative responsiveness of these instruments. Region specific outcome instruments are more responsive than generic outcome instruments [6] and, thus, we hypothesized that ODI and RMDQ would show higher responsiveness compared to SF-12 PCS and MCS. Our secondary hypothesis was SF-12 PCS would show greater responsiveness compared to SF12 MCS.
Materials and Methods
1. Data collection
This was a quantitative, single site, prospective, observational, and cohort study comparing the responsiveness of validated outcome instruments in patients who underwent lumbar microdiscectomy. Our hospital research and clinical audit department approved this study protocol. Written informed consent was given by patients prior to surgical procedures. A prospective survey linked to service evaluation was undertaken. The study was an audit survey linked to service evaluation and approved by the research and clinical audit department of Countess of Chester Hospital, UK (approval no., 2520). As this study was an audit linked to service evaluation and improvement, institutional review board approval was waived off by the research and clinical audit department.
We recruited consecutive patients who underwent lumbar discectomy from 12th January 2009 to 4th October 2010 to the study. All the cases were either performed or supervised by one spinal surgeon. All the patients underwent non-instrumented surgical intervention (microdiscectomy) for lumbar disc prolapse and had primary complaints of leg pain which was unresponsive to nonoperative methods of treatment, such as analgesics and physiotherapy. The patients had a preoperative magnetic resonance imaging (MRI) scan to confirm the diagnosis. For a patient to be considered for surgical intervention, clinical examination had to correlate with the MRI scan findings. The exclusion criteria included patients undergoing instrumented spinal surgery, decompression for tumors, trauma, and infection. Written informed consent was given by patients prior to surgical procedures.
Data related to age, sex, primary indication of surgical intervention, level of pathology and type of surgical procedure were collected on the day of the surgery. Additionally, patients completed ODI version 2.0, RMDQ, and SF-12 preoperatively in pen and paper. Six to 12 weeks after the surgery, patients returned to clinic and repeated the ODI version 2.0, RMDQ, and SF-12. Patients were asked to evaluate the change in their clinical condition and rate the success of the operative intervention.
A 6-point transition scale (external anchor) was administered to patients to evaluate clinical condition following the spinal operation. Possible options on this scale were ‘cured,’ ‘much better,’ ‘a bit better,’ ‘the same,’ ‘a bit worse,’ and ‘much worse.’ This 6-point scale was converted into binary scale for the standardized response mean (SRM) and receiver operating characteristic (ROC) analysis. Patients who responded ‘cured’ and ‘much better’ were classed as ‘responders,’ and the remaining answers were classed as ‘non-responders.’
2. Outcome instruments
ODI version 2.0 has been shown to be valid, reliable, and responsive in chronic backache patients [7]. The ODI was calculated using the method as described previously [8]. The final score is determined as a percentage disability score, ranging from 0 (no disability) to 100 (worst disability).
The RMDQ is a valid, reliable, and responsive instrument in chronic backache [9]. For RMDQ, patients were asked to put a cross mark adjacent to the sentences that described their difficulty in daily activities due to their back pain or leg pain in the last 24 hours (today). The RMDQ is scored from 0 points (no disability) to 24 points (maximum disability).
The SF-12 is a generic instrument shown to be valid, reliable, and responsive in patients with low backache [10]. The SF-12 expresses physical component score (SF-12 PCS) and mental component score (SF-12 MCS). The value of SF-12 MCS and SF-12 PCS components range from 0 to 100 with a higher score representing better health related quality of life. The US population normalized values for SF-12 PCS and SF-12 MCS are 50.8 (standard deviation [SD]=8.9) and 50.0 (SD=9.5), respectively based on a sample of 2,105 subjects [11]. The UK norm values for SF-12 PCS and SF-12 MCS are 50.9 (SD=9.4) and 52.1 (SD=8.7), respectively based on a sample of 1,751 subjects [11]. Gandek et al. [11] concluded that there was little difference in SF-12 values of the United States and the United Kingdom, and recommended the US SF-12 version such that results from different studies can be compared. The US SF-12 (SF-12 version 1 [standard 4-week recall]) was used and PCS-12 and MCS-12 components of SF-12 were calculated. Quality Metric Health outcomes scoring software ver. 4.0 (QualityMetric Inc., Lincoln, RI, USA) was used to do this calculation.
3. Data analysis
IBM SPSS Statistics ver. 19.0 (IBM Corp., Armonk, NY, USA) was used to analyze data. The mean change in score was calculated by subtracting the mean postoperative score from the mean preoperative score. For the ODI and RMDQ, a positive value of the change score indicates improvement in clinical condition. For the SF-12, a negative value of the change score indicates improvement. Paired t-test was used to evaluate the statistical significance of the change in the score. The level of significance was set at 5%.
4. Distribution based methods to assess responsiveness
The effect size (ES) is the ratio between the mean change in score of an outcome instrument and the SD of the score of the outcome instrument at the baseline. The SRM is the ratio between the mean change in score of an outcome instrument and the SD of change in score of the outcome instrument. Both ES and SRM were interpreted using Cohen’s criteria, where values of 0.2, 0.5, and 0.8 are considered as small, moderate, and large effects, respectively [12]. An ES and SRM value of more than 0.80 is considered optimal responsiveness of an outcome instrument [13]. SRM values between 0.2 and 0.3 are thought to suggest effects of placebo treatment, values between 0.3 and 0.5 suggesting moderately effective pharmaceutical agent, and values of more than 1.0 are usually observed after an effective surgical intervention [12].
The SRM was calculated separately for patients who responded to the surgical intervention (SRM responder) and those who did not respond to the surgical intervention (SRM non-responder). The difference between SRM responder and SRM non-responder was called ‘SRM difference.’ The outcome instrument that has the highest value of ‘SRM difference’ is considered to be the most responsive [14-16].
5. Anchor based methods to evaluate responsiveness
ROC curve was used to discriminate responders from non-responders. The area under the curve (AUC) is calculated from the ROC curve, and an AUC value of 0.5 (no discriminatory accuracy) indicates poor ability to discriminate responders from non-responders; an AUC value of 1.0 (perfect discriminatory accuracy) indicates perfect discriminatory ability of the instrument. The AUC value of <0.70, 0.70–0.79, and ≥0.80 are considered as indicators of suboptimal responsiveness, optimal responsiveness, and excellent responsiveness along with accurate discriminatory ability of an outcome instrument, respectively [14,15,17]. The outcome instrument having the highest AUC is considered to be the most valid and accurate discriminator of the status of change in the condition of the patient [14-16].
Results
2. Patient response to operative intervention
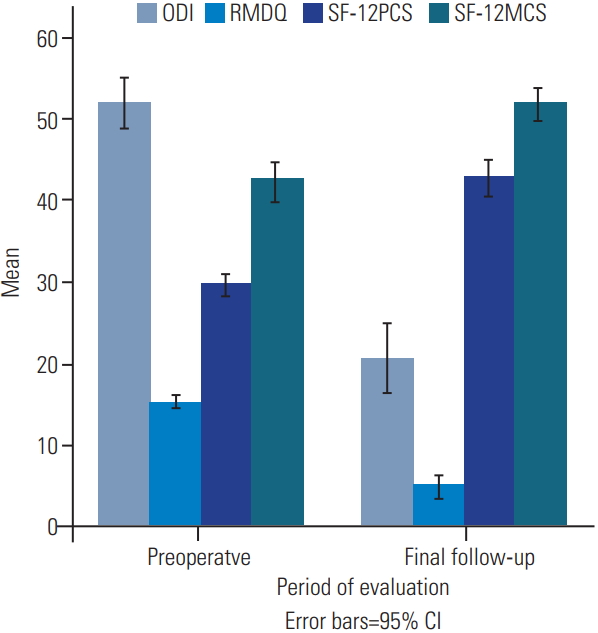
The patient response rate regarding clinical condition subsequent to operative intervention was 93 cases (94.9%). Table 2 identifies patient response pertaining to global assessment of change after operative intervention, with 82 patients (88.2%) responding that their clinical condition improved after discectomy. Fig. 1 and Table 3 depict preoperative, postoperative, and change in values of outcome instruments, showing significant improvement all outcome instruments.
3. Distribution based method (internal responsiveness [effect size and standardized response mean])
The overall ES of ODI, RMDQ, SF-12 PCS, and SF-12 MCS was 2.11, 2.15, 2.08, and 0.86, respectively. All were large effect as per Cohen’s criteria. The overall SRM of ODI, RMDQ, SF-12 PCS, and SF-12 MCS was 1.36, 1.43, 1.24, and 0.65, respectively. All were large effects as per Cohen’s criteria, except for SF-12 MCS which had a moderate effect. Setting self-reported change in clinical condition as an external anchor (Table 4), the RMDQ demonstrated the highest SRM difference, and SF-12 MCS the lowest.
4. Anchor based method (external responsiveness [area under the curve for receiver operating characteristic curve])
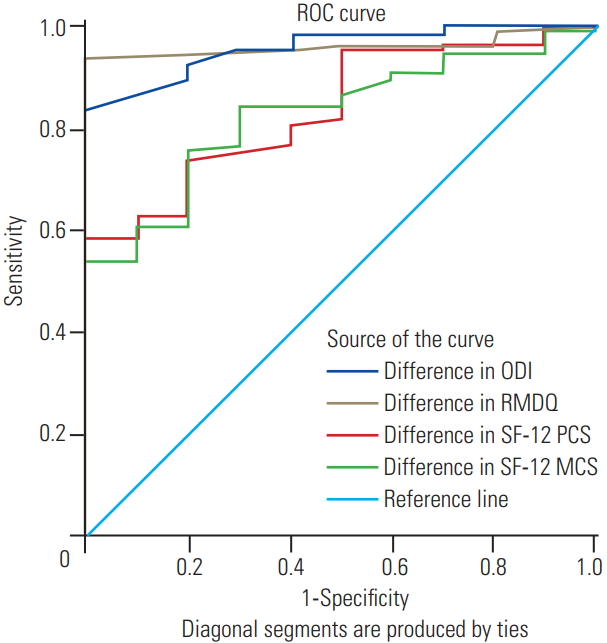
All outcome instruments demonstrated an adequate level of external responsiveness. It was difficult to conclude if ODI or RMDQ is better as 95% confidence interval (CI) of AUC of both outcome instruments tended to overlap. Setting self-reported change in clinical condition as an external anchor (Table 4), ODI and RMDQ had near-perfect responsiveness and discriminatory validity as the upper limit of their 95% CI was 1.00 (Fig. 2). Additionally, SF-12 PCS and SF-12 MCS demonstrated identical AUC on using the change in clinical condition of the patient as the external anchor (Table 4, Fig. 2).
Discussion
Our study shows that the commonly used region-specific patient-reported functional outcome instruments and generic quality of life outcome instruments accurately demonstrate improvement patients that underwent lumbar micro discectomy.
1. Standardized response mean difference
The SRM difference suggests that RMDQ had the highest responsiveness. As expected, RMDQ and ODI showed higher SRM difference compared to SF-12 PCS, which had a greater SRM difference than SF-12 MCS. Only one previous study has compared the SRM difference in ODI and RMDQ in a heterogenous cohort of patients with various surgically treated lumbar spine conditions such as lumbar canal stenosis, lumbar disc herniation, spondylolisthesis, and failed back syndrome [18]; this study demonstrated that the SRM difference of ODI was higher than RMDQ. The SRM difference for ODI in our study was higher than values reported previously (range, 1.11 to 2.18) [14,18]. The SRM difference for RMDQ in our study was higher than the SRM difference values quoted in literature for RMDQ (1.03) in a similar surgical cohort [18]. Only one study in a surgical cohort described an SRM difference for SF-12 PCS and SF-12 MCS, with the SRM difference of SF-12 PCS (1.28) slightly lower than our study, but SF-12 MCS (1.44) was higher than our study [15].
2. Area under the curve
We determined that both ODI and RMDQ have near perfect discriminatory ability. SF-12 PCS and SF-12 MCS had an identical AUC and as expected, the AUC of ODI and RMDQ was higher than that of SF-12, consistent with previous studies [14,19-21], which also show higher AUC in SF-12 PCS versus SF-12 MCS. However, we show equal AUC of SF-12 PCS and SF-12 MCS, suggesting equal discriminatory capability. This is important because two previous studies showed that the AUC of SF-12 MCS was suboptimal (<0.7) [20,21], and another showed that the AUC of SF-12 PCS was suboptimal [19]. All the studies reporting the AUC of ODI [14,18-22] and AUC of RMDQ [18,23] suggested optimal responsiveness. Optimal responsiveness based on AUC of SF-12 PCS was reported in three studies [14,20,21], whereas one study reported suboptimal responsiveness [19]. Optimal responsiveness based on AUC of SF-12 MCS was reported in one study [14], whereas two studies reported suboptimal responsiveness [20,21]. Our AUC value for ODI, RMDQ, SF-12 PCS, and SF-12 MCS was comparable to published AUC values for ODI (range, 0.74 to 0.90) [14,18-22], RMDQ (range, 0.78 to 0.84) [18,23], SF12-PCS (range, 0.60 to 0.90) [14,19-21], and SF-12 MCS (range, 0.64 to 0.85) [14,20,21] in surgically treated lumbar spine conditions.
3. Effect size
The large ES ODI, RMDQ, SF-12 PCS, and SF-12 MCS suggest optimal responsiveness for all patient-reported outcome instruments in our study. Three studies showed that the ES of ODI was higher than SF-12 PCS, which was greater than SF-12 MCS, which is consistent with our findings [14,20,21]. One study reported that ES of RMDQ suggested optimal responsiveness [18], whereas another study reported that RMDQ had suboptimal responsiveness [23]. All the studies showed that ES of SF-12 PCS suggested optimal responsiveness [14,20,21]. One study showed that ES of SF-12 MCS showed optimal responsiveness [21], whereas two studies showed that ES of SF-12 MCS had suboptimal responsiveness [14,20]. The overall ES of ODI in our study was 2.11, which is comparable to published reports of the ES of ODI in surgically treated lumbar spine conditions, ranging from 0.65 to 2.91 [14,18,20-22]. Three studies reported higher values of ES of ODI compared to our study [18,21,22]; this might be explained by a difference in the duration of follow-up, different types of surgical interventions, and different types of pathology. The overall ES of RMDQ in our study was much higher than previously reported ES of RMDQ (range, 0.76 to 0.84) after lumbar spine surgery [18,23]. One possible explanation for this discrepancy is few studies have reported the psychometric properties of RMDQ. The overall ES of SF-12 PCS and SF-12 MCS in our study was comparable to previously reported ES of SF-12 PCS (range, 0.98 to 1.70) [14,20,21] and SF-12 MCS (range, 0.63 to 0.98) [14,20,21] in operatively treated lumbar spine conditions.
4. Standardized response mean
We showed large ESs for overall SRM values of ODI, RMDQ, and SF-12 PCS, and moderate effect for SF12 MCS. The overall SRM of ODI was higher than the SRM of SF-12 PCS, which was higher than that of SF-12 MCS. Four similar studies [14,19-21] demonstrated that SRM of ODI was higher than SF-12 PCS and SF-12 MCS in three studies [14,20,21]. However, one study showed that SRM of ODI was lower than that of SF-12 PCS [19]. Three studies compared SRM of SF-12 PCS and SF-12 MCS [14,20,21] and surprisingly two studies reported that SRM of SF-12 PCS was lower than the SRM of SF-12 MCS [20,21]. If the value of overall SRM is greater than 0.80, it is considered as optimal responsiveness. In our study, ODI, RMDQ, and SF-12 PCS had optimal responsiveness; however, SF-12 MCS had suboptimal responsiveness. Three studies showed suboptimal ODI responsiveness [18-20] and three studies showed that SRM of ODI suggested optimal responsiveness [14,21,22]. One study reported optimal SRM of RMDQ [18], whereas another study reported suboptimal SRM of RMDQ [23]. Three studies reported SRM values of SF-12 PCS that suggest suboptimal responsiveness [19-21] and one study reported SRM value of SF-12 PCS that suggested optimal responsiveness [14]. One study reported the SRM of SF-12 MCS to be higher than 0.80 [21], whereas two studies reported that SRM of SF-12 MCS was of suboptimal responsiveness [14,20]. The overall SRM of ODI in our study was 1.36, consistent with previously published reports of SRM of ODI (range, 0.65 to 1.90) in surgically treated lumbar spinal pathologies [14,18,20-22]. The overall SRM of RMDQ in our work was 1.43, higher than previously published reports of SRM of RMDQ (range, 0.77 to 0.81) [18,23]. The overall SRM of SF-12 PCS and SF-12 MCS in our study was 1.24 and 0.65, respectively which was comparable to previously reported values of SRM of SF-12 PCS (range, 0.64 to 1.11) [14,19-21] and SF-12 MCS, respectively (range, 0.63 to 0.97) [14,20,21].
5. Comparison of distribution-based and anchor-based methods
Studies comparing responsiveness of ODI and RMDQ after surgical intervention are scarce. One previous study reported higher SRM difference and higher AUC of ODI suggesting that the ODI was the most responsive instrument in their study [18]. Another study showed that ODI was the most responsive instrument in their study over RMDQ in patients treated with transverse lumbar interbody fusion for degenerative spondylolisthesis [14]. The external anchors used in those studies were different from the ones used in the present study, as we use a distribution-based method (SRM difference) to determine that RMDQ was the most responsive outcome instrument. The anchor-based method (ROC) showed that both RMDQ and ODI were the most responsive instrument, suggesting that responsiveness value of an outcome instrument depends on the choice of the external anchor, clinical condition, and type of intervention. The value of responsiveness of an outcome instrument tends to vary with different external anchors [24], which might explain the discrepancy in our distribution-based and anchor-based methods.
6. Comparison of region specific and generic quality of life instruments
The responsiveness of ODI and RMDQ was higher than that of SF-12 (PCS and MCS) based on greater ES, SRM, SRM difference, and the area under the curve. This is consistent with previous observations wherein region and condition-specific outcome instruments demonstrated higher responsiveness compared to generic outcome instruments [25,26].
7. Comparison of generic quality of life instruments
In our study, responsiveness metric (SRM and ES) showed that SF-12 PCS had optimal responsiveness as SRM, and ES were above the threshold value of 0.8; also the AUC of SF-12 was above the threshold value of 0.8 and, thus, was excellent. Additionally, we observed higher responsiveness of SF-12 PCS compared to SF-12 MCS because SF-12 PCS exhibited higher values of ES, SRM, SRM difference, and the area under the curve compared to SF-12 MCS. The SRM of SF-12 MCS was suboptimal (SRM <0.8) but the remainder of parameters met the threshold of 0.8. This was on expected line especially as SF-12 MCS is a generic quality of life instrument. Therefore, we recommend the use of SF-12 PCS and SF-12 MCS to assess the quality of life after lumbar discectomy.
8. Strengths of the study
The present study is the first study to compare responsiveness of ODI, RMDQ, and SF-12 in homogenous group of patients that underwent micro-discectomy for lumbar disc herniation. The study was methodologically robust as we used both distribution- and anchor-based methods to evaluate responsiveness with a large sample size, based on COSMIN (consensus-based standards for the selection of health measurement instruments) checklist [27].
9. Limitations of the study
Several limitations of the study warrant discussion. External validity of the present study could be affected because this was a single center study and operated or supervised by a single surgeon performing a single specific surgical procedure. Thus, these results are applicable only to lumbar disc herniation treated with lumbar discectomy, and cannot be applied to patients having backache and sciatica secondary to other causes such as spondylolisthesis or spinal canal stenosis. The study was performed as part of service evaluation audit of spinal surgery services at our district general hospital. Patients were discharged to the care of the general practitioner at either 6 weeks or 3 months depending on the clinical progress of the patient. Hence, long-term follow-up was not undertaken in the study. Finally, the assignment of subjects into responders and non-responders was arbitrary and it is possible that the significance of the difference of SRM between the two groups could be due to the simplification of division.
Conclusions
ODI, RMDQ, SF-12 PCS, and SF-12 MCS demonstrate adequate responsiveness in a homogenous cohort of patients who underwent lumbar micro-discectomy for intervertebral disc herniation. The ODI and RMDQ are equally responsive and either instrument can be used to determine region specific outcome. SF-12 PCS and SF-12 MCS can be used to assess the quality of life after lumbar micro-discectomy.