


Introduction
Aging is associated with compromised function, impaired mobility, and loss of independence, resulting in decreased quality of life. Osteoporosis is characterized by decreased mineral mass and mechanical strength of bone leading to fragility fractures in the elderly. Vertebral fractures are one of the commonest fragility fractures. Vertebral fractures can increase mortality, with a reported age-standardized mortality ratio of 1.23 to 1.66 in women and 2.38 in men [1,2].
Muscle mass contributes to bone mineral mass, and the interaction between bone and muscle increases the mechanical strength of bone under loading and maintains normal musculoskeletal function [3,4]. Clinical studies have shown that loss of muscle mass occurs concurrently with osteoporosis [5]. The loss of muscle mass with increasing age associated with either decreased muscle strength or decreased physical performance is defined as sarcopenia [6]. Presarcopenia is the decrease in muscle mass alone, whereas severe sarcopenia is defined as the presence of a decrease in muscle mass, muscle strength, and physical performance. Muscle mass can be measured using various methods like dual-energy X-ray absorptiometry (DEXA), bioimpedance electrical analysis, computed tomography (CT) or magnetic resonance imaging (MRI). MRI is the most accurate method and total psoas muscle cross-sectional area (TPA) measured on MRI is an accepted muscle mass measure which shows atrophy and fat infiltration in sarcopenia [7]. Muscle strength is measured by handgrip strength using a dynamometer, and physical performance by tests such as usual gait speed or short physical performance battery.
Observational studies have shown that sarcopenia, decreased paraspinal muscle cross-sectional area, and fat infiltration of paraspinal muscles are risk factors for vertebral fractures. These factors have been associated with an increased number of vertebral fractures in the elderly [8-10]. However, some of these studies are limited as they did not account for muscle strength or physical performance, thus, diagnosing presarcopenia rather than sarcopenia. Moreover, some studies have used DEXA to assess muscle mass, which is inferior to MRI.
We hypothesized that sarcopenia, diagnosed by decreased TPA and decreased handgrip strength, is an independent risk factor for fresh vertebral fragility fractures in elderly. We did a comparative analysis between a study group of elderly patients with fresh vertebral fragility fractures and a control group of patients without fractures and analyzed the effect of sarcopenia and other variables. Our objective was to determine whether sarcopenia increased the risk for vertebral fragility fractures among the elderly.
Methods
After obtaining Institutional Review Board approval (IRB approval no., 2017/06/03, dated 28/07/2017 of Ganga Medical Centre and Hospitals Pvt. Ltd., Coimbatore) and informed consent, we included patients presenting to a tertiary spine center during the period between September 2017 and April 2018. Patients ≥50 years of age with acute back pain, history of trivial trauma, and presence of vertebral fracture on radiographs were included in the study group. Patients presenting after 3 weeks of symptoms, those with significant trauma, diagnosed malignancies or neuromuscular disorders, and those who were bedridden for more than a month in the preceding year were excluded. Out of 65 patients fulfilling the inclusion criteria, 14 were excluded (13 incomplete investigations and one lack of consent) and the remaining 51 patients were recruited. A detailed history was taken, including the history of drug intake and that of being bedridden. Anthropological measurements of height, weight, and body mass index were noted. Equal numbers of age and sexmatched patients who presented with backache, but without fresh vertebral fractures, were assigned to the control group. Age was matched to within 1 year. As sarcopenia is known to cause decreased bone mineral density (BMD), BMD was excluded as a matching variable to prevent overmatching.
MRI of the whole spine was performed using a 1.5-Tesla machine (Magnetom Essenza; Siemens Healthineers, Erlangen, Germany) to assess fracture, presence of previous fractures, exclude other pathologies and calculate the TPA. DEXA scan was performed to assess BMD at the femoral neck for evaluating osteoporosis with values of Caucasian females as reference (Lunar Prodigy Advance; GE Healthcare, Chicago, IL, USA). Femoral neck BMD was chosen instead of vertebral BMD as vertebral fractures and osteophytes are known to lead to falsely high values of BMD. Biochemical laboratory analysis of calcium, phosphorus, vitamin D, and parathyroid hormone was also performed.
The primary evaluation included the presence of sarcopenia, diagnosed according to the European Working Group on Sarcopenia in Older People (EWGSOP) criteria [8], which diagnoses sarcopenia by the presence of decreased muscle mass with either decreased muscle strength or physical performance. Although they mention that DEXA is the most commonly used method of assessment of muscle mass, MRI is the gold standard and most appropriate in the research setting. The cut-off values for diagnosis rely on measuring normative data from a reference population of young adults, with separate values for men and women. Muscle mass was assessed using TPA on MRI. We also examined the role of standardized muscle mass based on the psoas lumbar vertebral index (PLVI) to assess its role in addition to that of absolute muscle mass measured by TPA. PLVI is calculated as TPA divided by the vertebral body area at the same axial level. This measure is useful for standardizing muscle mass for stature. Sarcopenia was diagnosed based on both absolute muscle mass and standardized muscle mass for separate analysis. Muscle strength was tested using a hydraulic handheld dynamometer (Jamar Medical Hand Dynamometer; Patterson Medical, Warrenville, IL, USA) which measures peak hand strength in kilograms. Grip strength of the dominant hand was measured thrice, and the average was considered for diagnosis. Cut-off values for low muscle strength were specific for the Asian population (26 kg in males and 18 kg in females) according to the criteria of the Asian Working Group for Sarcopenia (AWGS) [11]. We excluded measurements of physical performance as the presence of an acute fracture and back pain in the patients precluded gait speed measurements.
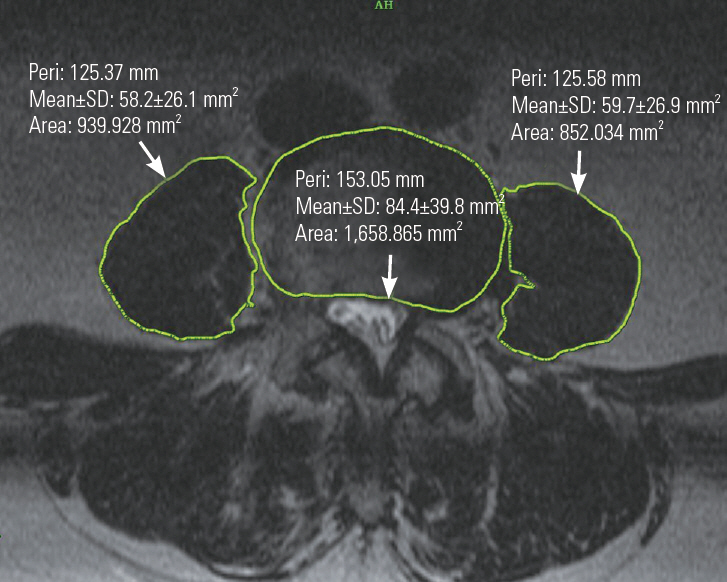
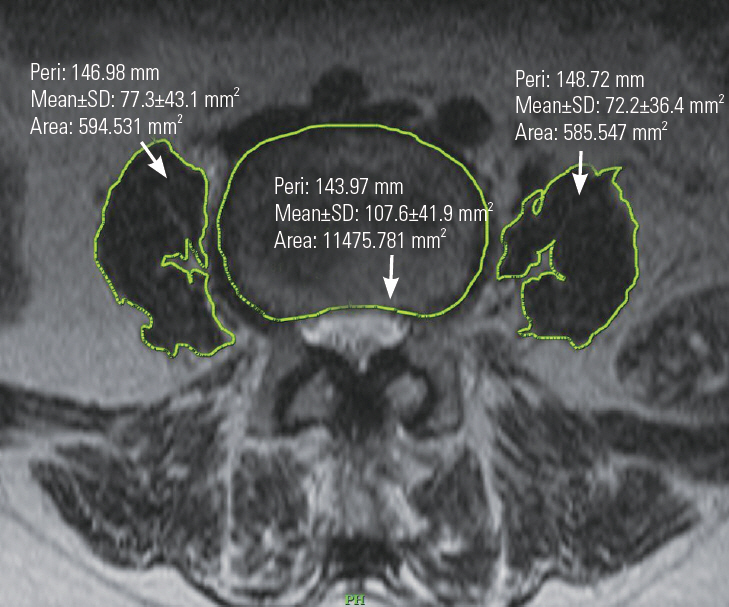
All measurements were taken by the principal investigator. The TPA at L4 upper endplate was used to measure muscle mass, as described by Shen et al. [12]. All the patients underwent MRI using the same protocol, with disk level parallel section at the upper L4 endplate used for measurements in all cases. TPA and PLVI were measured at the same level from T2-weighted axial images using the hospital picture archiving and communications system (PACS; Medsynapse PACS, ver. 5.0.1.3; Medsynaptic Pvt. Ltd., Pune, India). Outlines of the left and right psoas muscles and vertebral body were drawn manually to define the region of interest. Fat infiltration, seen as hyperintensity on T2-weighted films were excluded from the region of interest, thus measuring the fat-free cross-sectional area. The software calculated the area automatically (Figs. 1, 2). Sarcopenia was diagnosed as TPA and PLVI 2 standard deviations (SDs) below the mean of the reference population of normal young adults.
We calculated the reference values by analyzing MRI images of all persons between the ages of 20 and 40 years who had undergone MRI of the lumbar spine between January 2012 and December 2017. From medical records, we identified patients who had come for evaluation of a first episode of acute-onset back pain without any clinical abnormalities and normal imaging. Patients with significant pain, limitation of activity, or abnormal physical findings were excluded. The final list of persons with normal MRI was used to measure the psoas area and PLVI. Mean and SD were calculated separately for men and women. Cut-off values for diagnosing sarcopenia were then determined.
For calculating the reliability of interobserver assessment, measurements of 50 random subjects were taken independently by a senior registrar. For intraobserver reliability, measurements were repeated by the principal investigator after a gap of 3 months. Intraclass correlation coefficient (ICC) estimates and their 95% confidence intervals (CIs) were calculated using IBM SPSS ver. 22.0 (IBM Corp., Armonk, NY, USA). Based on a single-measurement, absolute-agreement, two-way random effects model for interobserver reliability, the ICC for TPA was 0.932 (95% CI, 0.865–0.964) and that for PLVI was 0.788 (95% CI, 0.619–0.881). Based on a single-measurement, absolute-agreement, two-way mixed effects model for intraobserver reliability, the ICC for TPA was 0.944 (95% CI, 0.902–0.968) and that for PLVI was 0.943 (95% CI, 0.886–0.970).
Statistical analysis was performed using IBM SPSS ver. 22.0 (IBM Corp.). The mean and SD for normative values were calculated. Significance level was set at p=0.05. Paired t-test and McNemar’s test were used to analyze continuous and categorical variables, respectively. Conditional regression analysis was used to analyze variables in multivariate analysis. Correlation between continuous variables within a group was analyzed using Pearson’s coefficient.
Results
1. Normative study
The normative data were calculated from 249 adults (114 men and 135 women). The TPA of the reference population was 1,576 mm2 (standard error [SE]=25.3, SD=295) for women and 2,723 mm2 for men (SE=50.6, SD=541). Based on these, cut-off values for women and men with sarcopenia were 986 mm2 and 1,641 mm2, respectively. The PLVI of women and men in the reference population was 1.51 (SE=0.026, SD=0.31) and 2.05 (SE=0.04, SD=0.46), with cut-off values of 0.89 and 1.13, respectively (Table 1).
2. Case-control study
There were 15 men (mean age, 70.05±9.8 years) and 36 women (69.3±9.2 years) each in the case and control groups. Compared with cases, TPA was significantly higher in the control group (1,569 mm2 versus 1,278 mm2, p=0.001). There was no statistically significant difference between women in both groups with respect to handgrip strength (15.8 kg versus 14.3 kg, p=0.226). However, men in the control group had significantly higher handgrip strength (30 kg versus 23 kg, p=0.016). Twenty-one cases and seven controls had a T-score less than −2.5, with an odds ratio (OR) of 5.67 (p=0.004). The mean T-scores were significantly different between the two groups. There was no significant difference between the two groups with respect to biochemical parameters. Table 2 shows the comparison of continuous variables between cases and controls, with separate analysis for males and females.
Sarcopenia, when diagnosed based on TPA, was present in 15 cases (29.4%) compared to four controls (7.8%) (p=0.005). However, when diagnosed based on PLVI, the prevalence of sarcopenia was 23 (45.1%) and 14 (27.4%) among the cases and controls, respectively, and it was not significantly different between groups (p=0.064). McNemar’s test revealed a significant OR of 12 (p=0.006) for sarcopenia diagnosed by TPA, in contrast to the PLVI, where the difference was not significant between groups (OR, 2.29; p=0.095) (Table 3).
Twenty-nine cases and seven controls had previous vertebral fractures, showing a significantly higher prevalence of previous fractures in the study group (OR, 12; p<0.001). The prevalence of sarcopenia was significantly higher among those with previous fractures (38% versus 7.6%; OR, 7.76; p<0.001). None of the controls without previous fractures had sarcopenia. TPA (1,563 mm2 versus 1,168 mm2) and handgrip strength (19.6 kg versus 16.3 kg) were significantly higher in those without previous fractures (p=0.001 and p=0.05). TPA showed a strong positive correlation with handgrip, height, weight, and BMD in all groups.
Univariate analysis of different variables showed that the presence of previous fractures, BMI, T-score, and sarcopenia diagnosed by TPA were significant risk factors for developing fresh fractures. Multivariate analysis was performed using the occurrence of fresh fractures as the dependent variable (Table 4). Sarcopenia was not identified as a significant risk factor for fresh fractures in multivariate analysis (p=0.4). The presence of previous fractures had a significant OR for developing fresh fractures (OR, 7.049; p=0.015). T-score showed a significant value (OR, 0.604; p=0.036) indicating a 40% decreased odds for each unit increase in the T-score.
Discussion
Sarcopenia is the age-related decrease in muscle mass, power, and physical performance. According to EWGSOP criteria, its diagnosis requires the presence of both decreased muscle mass and either decreased muscle strength or physical performance. MRI is the most accurate method for determining muscle mass [13]. In all previous studies that diagnosed sarcopenia using CT or MRI, cutoff points were derived arbitrarily, as the lowest tertile or quartile of muscle area [14-18]. In this study, the reference range of TPA for Indian men and women was calculated from records of clinically and radiologically normal adults. Then, sarcopenia was diagnosed as 2 SDs below the sex-specific population means, which increases the accuracy of the diagnosis. Handgrip strength is an easy, reliable, and reproducible indicator of muscle strength that is commonly used for the screening and diagnosis of sarcopenia. In this study, decreased handgrip strength was based on cut-off values according to the AWGS criteria [11].
In our study, sarcopenia showed a significantly higher prevalence among the elderly with vertebral fragility fractures compared to matched controls. However, multivariate analysis showed that sarcopenia was not an independent risk factor for fresh vertebral fractures. The close relationship between sarcopenia and low BMD may be responsible for the increased prevalence of sarcopenia among the elderly with vertebral fractures. However, this denotes only an association and not causation. Our analysis indicates that sarcopenia alone may not result in vertebral fractures and that low BMD and presence of previous fractures have more important roles in fracture occurrence.
Sarcopenia showed a significantly higher prevalence among the elderly with vertebral fragility fractures compared to matched controls suggesting that absolute muscle mass may have a more important role in preventing fractures than relative muscle mass. Women generally have lower muscle mass than men with a higher prevalence of vertebral fragility fractures, which could be a result of the loss of protective muscle mass [19]. Ignasiak et al. [20] simulated the effect of aging and sarcopenia in a spine model to determine muscle recruitment patterns and spinal loads. They simulated the loss of muscle fibers of back extensors, erector spinae, and multifidus that occurs with normal aging and sarcopenia. In the normal aging model, they found that loss of these muscles was compensated by an increased activity of other muscles, whereas in sarcopenia, the compensatory muscle groups were ineffective.
The presence of previous vertebral fractures was found to be significantly higher in the case group. Increasing age, preexisting vertebral fracture, and osteoporosis are known risk factors for a new vertebral fracture [21-23]. It is likely that an incident vertebral fracture will lead to sarcopenia, particularly in the case of prolonged immobilization, which can lead to a positive correlation between them.
Previous studies have shown a positive correlation between sarcopenia, osteoporosis, and fragility fractures [23-26]. Hida et al. [9] reported that sarcopenia, measured as decreased leg skeletal mass index, was a risk factor for vertebral fractures in elderly Japanese women. In a study of Hida et al. [9], the prevalence of sarcopenia was 42% and 25% in fracture and non-fracture groups, respectively. Our study found a prevalence of 29% and 7.8% in the fracture and non-fracture groups, respectively. In a study of Hida et al. [9], they measured only muscle mass and did not consider strength or physical performance. As decreased muscle mass is not always associated with decreased strength, this could result in overestimation of sarcopenia, which may explain the higher prevalence reported in their study. Moreover, they did not consider the presence of previous fractures in their study. In contrast, in our study, we found that the presence of previous fractures was the strongest risk factor for a new fracture, more so even than sarcopenia or osteoporosis alone.
Yu et al. [27] conducted a prospective study in a large cohort of elderly Chinese men and found that sarcopenia at baseline was an independent risk factor for incident fragility fractures, and the addition of sarcopenia to other risk factors, such as BMD, increased the predictive ability of the model. However, the group with sarcopenia had an incidence of vertebral fractures of only 2.7% over an average follow-up period of 11 years. Although they mentioned the proportion of people with preexisting fractures at baseline, they did not analyze the effect of preexisting fractures on the incidence of new fractures.
Not all studies demonstrated sarcopenia as a risk factor for fragility fractures. Trajanoska et al. [28] followed up 5,911 subjects in a Rotterdam study and found that sarcopenia did not carry a higher risk for fracture compared to BMD. Though sarcopenic individuals had a higher prevalence of fractures, this was associated with lower BMD in this group. Sarcopenia did not add to the risk of fracture in osteoporotic individuals. Harris et al. [29] also found a similar result in their prospective study on elderly women and found that sarcopenia was not an additional risk factor for fractures in women with osteoporosis.
Iolascon et al. [8] analyzed 67 women with vertebral fractures, of which 32 had multiple fractures and found that sarcopenia was more prevalent in women with multiple fractures than in those with a single fracture. Our findings were similar, indicating that sarcopenia is strongly associated with preexisting fractures. However, the causal relationship between sarcopenia and previous fractures cannot be determined without a prospective study.
In our sample, there were 20 pairs of cases and controls without preexisting fractures. Among these, five cases had sarcopenia, whereas none of the controls had sarcopenia. Though not statistically significant, this might indicate the contributory effect of sarcopenia for the development of the first episode of fractures. Future studies matched for the presence of previous fractures and osteoporosis may reveal the exact role of sarcopenia in the development of new fractures and its contribution in patients with preexisting fractures.
The small sample size is the biggest limitation of this study. There are longitudinal studies of large populations that examined the relationship between sarcopenia and osteoporotic vertebral fractures. However, in our country, we lack a common data registry and hence, we had to opt for a case-control study instead of a longitudinal study. The study was conducted in a single center, which might have introduced a selection bias. Although we measured muscle mass using MRI and diagnosed sarcopenia based on reference values obtained from a reference population, this method has not been rigorously validated in other studies. Reference values were obtained from a subset of the population that had attended the hospital to tend to a specific complaint rather than from the community, which was not operationally feasible.
Conclusions
Our results showed that sarcopenia is not an independent risk factor for vertebral fractures among the elderly despite its increased prevalence in this population. The presence of preexisting fractures and decreased T-score still remain the most important predictors of new fracture occurrence.