Ability of Spine Specialists to Identify Psychosocial Risk Factors as Obstacles to Recovery in Patients with Low Back Pain-Related Disorders
Article information
Abstract
Study Design
Prospective study.
Purpose
Yellow flags are psychosocial associated with a greater likelihood of progression to persistent pain and disability. These are referred to as obstacles to recovery. Despite their recognized importance, it is unknown how effective clinicians are in detecting them. The primary objective of this study was thus to determine the effectiveness of spine specialist clinicians in detecting the presence of yellow flags in patients presenting to an orthopedic outpatient clinic with low back-related disorders.
Overview of Literature
Psychosocial factors have been previously studied as important predictors of prognosis in patients with low back pain. However, the ability of spinal specialist to identify them remains unknown.
Methods
A prospective, single-center, consecutive cohort study was conducted over a period of 30 months. All new patients with low back-related disorders regardless of pathology completed a Yellow Flag Questionnaire that was adapted from the psychosocial flags framework. Clinicians assessing these patients completed a standardized form to determine which and how many yellow flags they had identified during the consultation.
Results
A total of 130 patients were included in the analysis, and the clinicians reported an average of 5 flags (range, 0–9). Fear of movement or injury was the most frequently reported yellow flag, reported by 87.7% (n=114) of patients. Clinician sensitivity in detecting yellow flags was poor, correctly identifying only 2 flags, on average, of the 5 reported by patients, with an overall sensitivity of only 39%.
Conclusions
The ability of spine specialists to identify yellow flags is poor and can be improved by asking patients to complete a simple screening questionnaire.
Introduction
Low back pain (LBP) is a common problem that leads to a great deal of suffering and loss of productivity [1], and it is the most prevalent musculoskeletal condition [2]. In developed countries, it is estimated that between 49% and 90% of individuals will experience at least one episode of back pain during their lifetime [2,3], with a global 1-month period prevalence of 23.2% and an overall prevalence of 31% [4]. The 1-year incidence of a first-ever episode of back pain ranges from 6.3% to 15.4% [4], with the incidence greatest in those in their 40s, increasing with advancing age, then declining in the older age groups [4-6].
In patients with a new episode of back pain, progression to a chronic pain pattern is more dependent on demographic, psychosocial, and occupational factors than on medical characteristics of the spinal condition itself [7]. Psychosocial factors play an important and significant role in the transition to and development of chronic LBP [8,9]. These psychosocial risk factors are obstacles to recovery, and have been collectively labeled as “yellow flags” by Kendall et al. [10]. These yellow flags are prominent in the development of disability due to musculoskeletal disorders, and good outcomes can be anticipated when interventions to address these yellow flags are competently applied [11].
Work absence in the United Kingdom secondary to back pain is common. Return to work for short-term absences secondary to back pain is between 80% and 90% [12]. A history of LBP and pre-existing psychological distress is associated with further episodes of LBP [13]. Sustainable return to work for those with chronic occupational LBP ranges from 22% to 62% at 2 years [6]. In addition to the financial implications for society of the failure to return to work, chronic LBP has been demonstrated to have a negative impact on individuals, with reduced physical performance and increases in fear avoidance and depressive symptoms [14].
Identifying and addressing obstacles to recovery is important to preventing the development of chronicity of symptoms and to minimizing or reducing the personal, socioeconomic, and health care burden. Screening tools such as the Keele STarT Back Questionnaire help primary health care professionals identify patients at risk of developing chronic symptoms [15]. Patients presenting to secondary care services often have chronic pain with associated obstacles to recovery. Implementing treatment strategies that empower patients to overcome these obstacles is an important component of the consultation. This implementation can only be achieved if these obstacles are identified. However, the ability of specialists to identify these obstacles to recovery is unknown.
The primary objective of this study was to determine the effectiveness of spine specialist clinicians in detecting the presence of obstacles to recovery (yellow flags) in patients presenting to an orthopedic spinal outpatient clinic with low back-related disorders. A secondary objective was to correlate the number of yellow flags reported by patients using validated spinal outcome assessment tools.
Materials and Methods
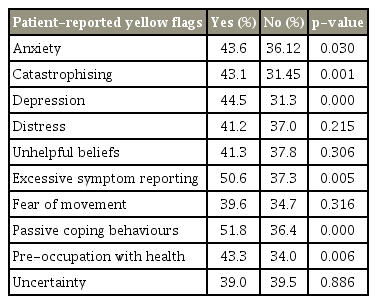
A prospective, single-center, consecutive cohort study was performed. This study was conducted in the United Kingdom at an institution with which all the authors were affiliated except R.D. This study did not require ethical approval. Data were collected over a period of 30 months. All new patients referred to a spine specialist outpatient clinic under the care of the senior author (P.S.), with low back-related disorders regardless of pathology, were asked to complete a Yellow Flag Questionnaire (Table 1). This questionnaire was adapted from the psychosocial flags framework. Patients also completed the Oswestry Disability Index (ODI), Low Back Outcome Score (LBOS), Modified Somatic Perception Questionnaire (MSPQ), and Zung self-rating Depression Scale (MZD).
The studied sample population involved patients who were referred to the spine specialist outpatient clinic for lower back disorders without any red flags, after being managed by the general practitioner and having not responded to pain medications. Therefore, all the patients studied were evaluated for lower back-related disorders, and none had any red flags (acute pathology), work-related injuries, or injuries involving accidents/litigations.
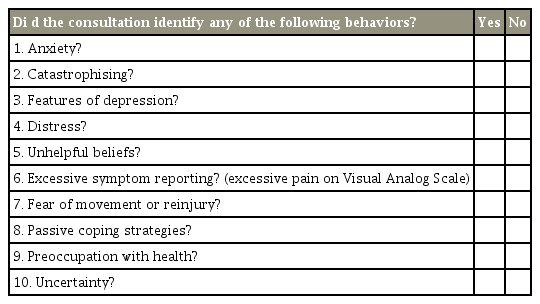
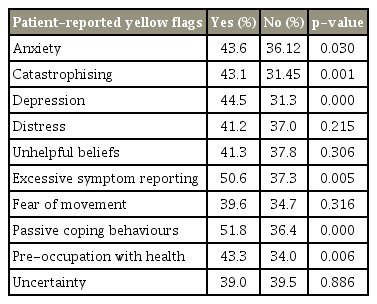
Clinicians completed a standardized form to determine which and how many yellow flags they had identified during the consultation (Table 2). The clinicians consisted of a consultant orthopedic spine surgeon, a general practitioner with a specialist spinal interest, a senior spine specialist physiotherapist, orthopedic specialist registrars, and clinical research fellows in spinal surgery. Exclusion criteria included those aged <18 years, follow-up patients, patients with non-low-back-related disorders, and those with incomplete questionnaires.
1. Questionnaire
We modified the adapted New Zealand Acute Low Back Pain Screening Questionnaire published by Linton and Halldén [16] in 1998 by summarizing and shortening it to two sets of 10 questions, one for the patient and the other for the clinician (Tables 1, 2).
The question sets for both patient and clinician were designed to elicit the following 10 themes: (1) anxiety, (2) catastrophizing, (3) depression, (4) distress, (5) unhelpful beliefs, (6) excessive symptom reporting, (7) fear of movement, (8) passivity, (9) preoccupation with health, and (10) uncertainty.
The questionnaires were completed by the patient before the consultation, and imaging was arranged after the assessment if required. The clinicians were blinded to the patient’s responses to the yellow flags questionnaire and performed a detailed history to assess the presence or absence of yellow flags.
The results were compared to assess how effective clinicians were in identifying obstacles to recovery as reported by patients. The sensitivity, specificity, and positive and negative predictive values of the clinicians’ ability in identifying these yellow flags was calculated. The reported number of yellow flags was then correlated with the ODI, LBOS, MSPQ, and MZD indices. The frequency of yellow flags was also correlated with sex, age, occupational status, imaging, and surgery.
Patients were then divided into four groups according to the validated Distress and Risk Assessment Method (DRAM) developed by Main et al. [17]. This process involved categorizing patients according to their MSPQ and MZD scores into normal (N); at-risk (R); distressed and depressive (DD); and distressed and somatic (DS) (Table 3). The frequency of yellow flags was then correlated to assess whether patients reporting more yellow flags were more distressed than those with fewer yellow flags.
A statistical analysis of the data was performed using PASW SPSS ver. 18.0 (SPSS Inc., Chicago, IL, USA). The categorical data were analyzed using Pearson’s chi-square test, and the continuous data were analyzed using the chi-square T-test and a one-way analysis of variance in combination with a Bonferroni post hoc test.
Results
A total of 130 patients were included in the analysis; 52.3% were women (n=68), and the average age was 48.9±17.2 years (range, 18–86 years). Some 78.5% (n=102) of the patients were white, 18.5% (n=24) were Asian, three were African-Caribbean, and one was Chinese.
Some 91% (n=118) of the patients had radiological investigations of their spine, with 78% (n=92) having had magnetic resonance imaging (MRI) and 56.5% (n=52) demonstrating a potential surgical target. Some 48% (n=62) of the patients were working adults with less than 30 days of sick leave; 52% (n=68) were not working. Of the total patients, 19 had at least 1 month of sick leave due to their low back-related symptoms, 23 were retired, and 20 were not employed. Six patients had an unclear occupational status and were excluded from the analysis.
1. Yellow Flag Questionnaire scores
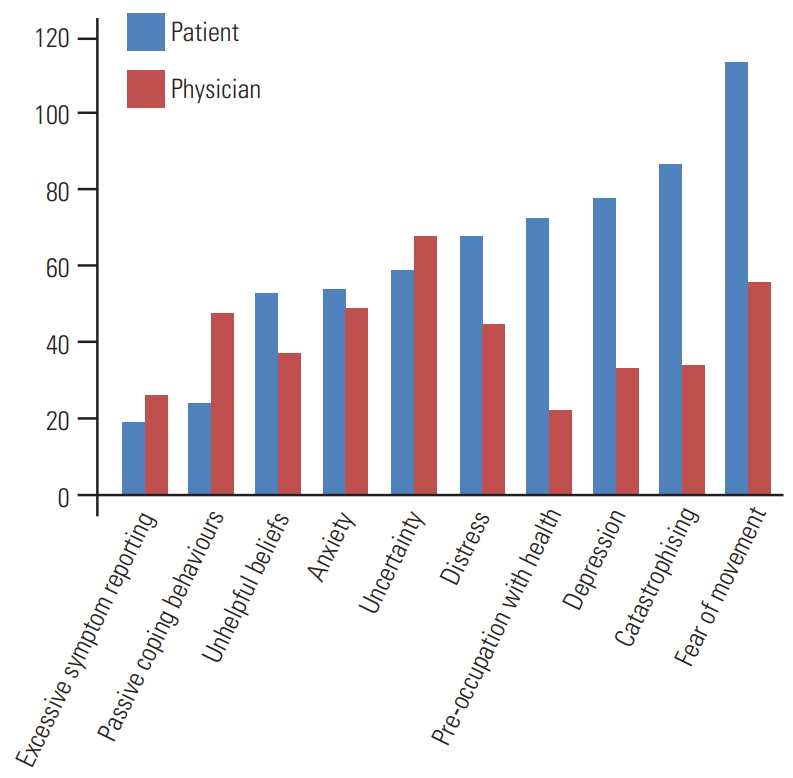
The average number of flags reported by patients was 5 (4.8±1.8; range, 0–9). The most frequent yellow flag reported by patients was fear of movement or injury, which was reported by 87.7% of patients (n=114), whereas only 14.6% (n=19) of patients demonstrated excessive symptom reporting, with a visual analogue score greater than 10. Fig. 1 shows the distribution of yellow flags reported by patients and those believed to be present by clinicians. Fig. 2 shows yellow flags as noted by clinicians.
2. Clinician sensitivity in detecting yellow flags
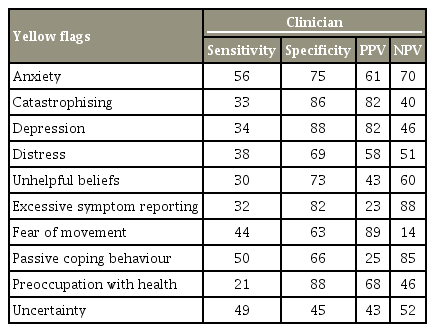
The average number of flags reported by clinicians was 3 (3.3±2.8; range, 0–9). Clinician sensitivity in detecting yellow flags was poor, correctly identifying on average only 2 flags (1.9±1.9) out of the average 5 reported by patients. Table 4 demonstrates the sensitivity and specificity for all of the individual yellow flags. The overall sensitivity of clinicians was only 39%, with a specificity of 73%. The overall positive predictive value for clinicians was 57%, and the negative predictive value was 55%. The number of patient-reported yellow flags was found to have a positive correlation with the number of clinician-reported yellow flags (Pearson’s correlation, 0.395; p<0.001).
We also stratified our results to see whether there was an association between clinician seniority and the ability to identify yellow flags, using the independent-sample Kruskal–Wallis test. Sensitivity (p=0.070) and specificity (p=0.211) were the same across all categories of assessors, suggesting that there were no significant differences in identifying yellow flags based on the level of seniority.
3. Sex and yellow flags
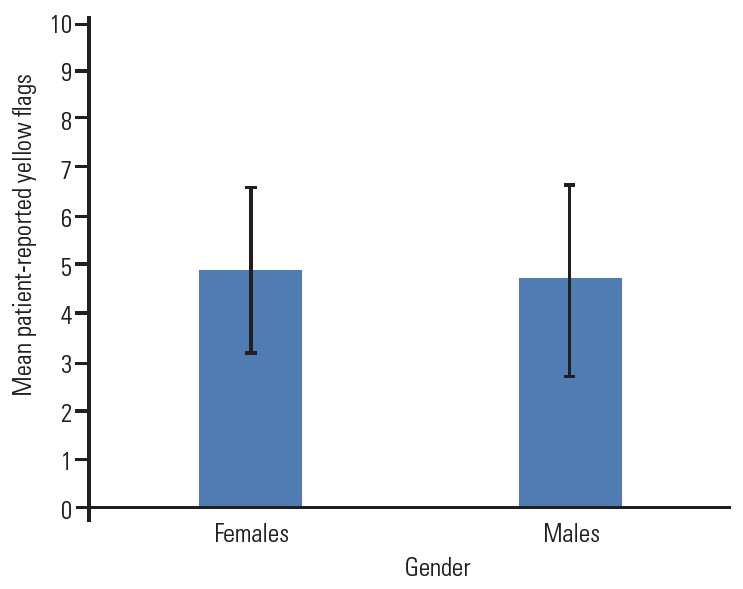
Men with low back-related disorders tended to be older than women (51.6 versus 45.1 years, p=0.03). However, there was no significant difference between the mean number of flags reported by patients (4.7±1.9 versus 4.9±1.7, p=0.40) or by clinicians (3.2±2.9 versus 3.5±2.7, p=0.503) for both sexes (Fig. 3).
4. Age and yellow flags
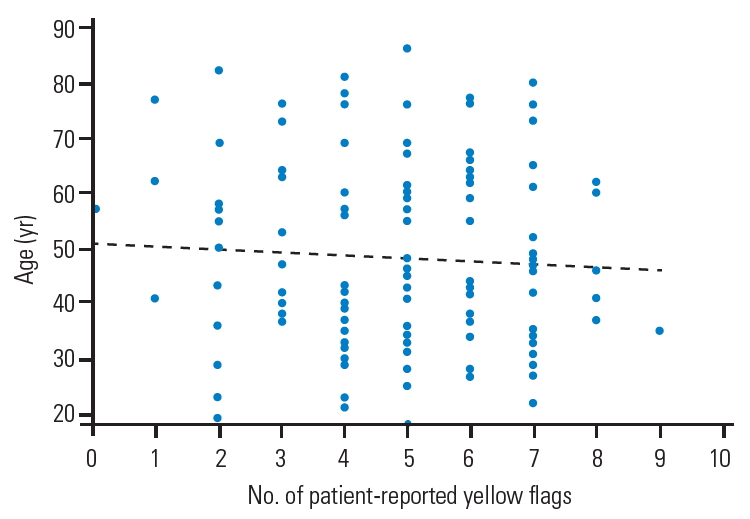
There was no significant difference found in the mean number of flags reported by patients aged <65 years and those >65 years (4.8±1.9 versus 4.7±1.6 flags, p=0.798). A weak negative correlation between age and the number yellow flags reported was found, but it did not reach statistical significance (Pearson’s correlation, −0.074; p=0.401) (Fig. 4).
5. Occupational status
There were no significant differences found between employment status and the number of patient-reported yellow flags (p=0.127). In contrast, there was a significant difference between the number of physician-reported yellow flags between working and nonworking patients (p=0.07).
Both MZD (23.8±10.8 versus 27.7±11.7, respectively; p=0.022) and MSPQ (6.55±6.3 versus 9.69±7.5, respectively; p=0.013) scores were significantly higher in patients who were not working compared with those who were employed. The ODI was lower in patients with employment compared with patients who were not working (35.7±16.3 versus 44.1±20.5, p=0.013).
6. Radiological investigations
Patients who had an MRI of the spine had a higher mean number of patient-reported yellow flags (5.06 versus 4.27, p=0.028). Clinician-reported yellow flags, however, were not significantly different in this group (3.55 versus 2.86 flags, p=0.219). There was no significant difference in MSPQ (p=0.167) or MZD (p=0.094) between patients who had MRI and those who did not.
7. Surgical procedures
Some 17% (n=22) of patients ultimately underwent surgery for their back-related disorder. There was no significant difference in the number of patient- or clinicianreported yellow flags in those who underwent surgery compared with those who did not: 4.7±1.5 versus 4.8±1.9 patient-reported flags (p=0.760) and 3.5±2.8 versus 2.4±2.6 clinician-reported flags (p=0.105). The mean MSPQ scores (5.8±4.4 points versus 8.4±7.3, p=0.114) were higher in the nonsurgical patients.
8. Oswestry Disability Index and Back Functional Assessment scores
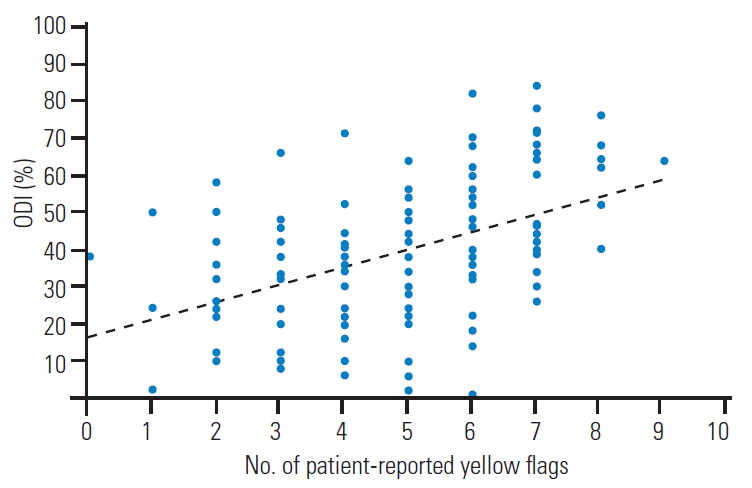
There was a significant positive correlation between the number of patient-reported yellow flags and the ODI (Pearson’s correlation, 0.446; p<0.001) (Table 5, Fig. 5). LBOS scores were significantly negatively correlated with the total number of patient-reported yellow flags (Pearson’s correlation, −0.44; p<0.001); i.e., patients with fewer reported yellow flags had better back functional outcomes (Table 6, Fig. 6).
9. Modified Somatic Perception Questionnaire, Zung Depression Scale, and Low back Outcome Score
Both patient-reported (Pearson’s correlation, 0.501; p<0.001) and clinician-reported (Pearson’s correlation, 0.438; p<0.001) yellow flags significantly correlated with MSPQ (Pearson’s correlation, 0.484; p<0.001) and MZD scores (Pearson’s correlation, 0.347, p<0.001) (Figs. 7, 8). The range of scores for MZD were mapped to provide the score for each question ranging from 0–3 instead of 1–4 to make the statistical analysis simpler.
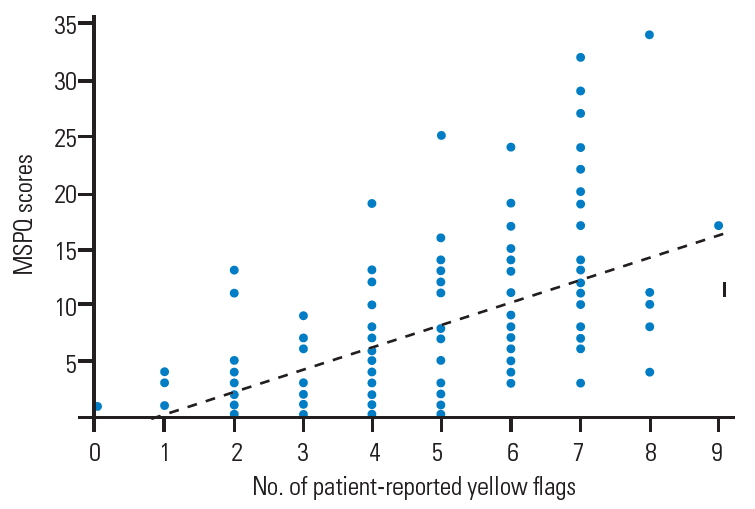
Correlation of number of patient-reported yellow flags with MSPQ scores. MSPQ, Modified Somatic Perception Questionnaire.
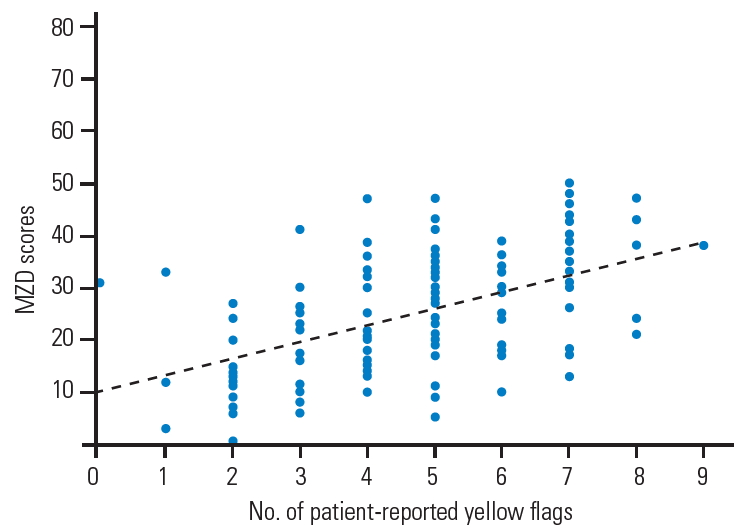
Correlation of number of patient-reported yellow flags with MZD scores. MZD, Zung Self-Rating Depression Scale.
Patients who identified themselves as depressed had higher mean MZD scores (29 versus 19, p<0.001) and MSPQ scores (10.3 versus 4.5, p<0.001). Patients who identified themselves as distressed also had higher MZD scores (27 versus 23, p=0.026); however, there was no difference between their MSPQ scores (p=0.546).
10. Distress and risk assessment method
For patient-reported yellow flags, there was a statistically significant difference in the number of yellow flags reported for the four DRAM categories (F [3,12]=20.525, p=0.000). A Bonferroni post hoc test revealed that the number of yellow flags reported was statistically significantly lower for type N patients compared with type R (-1.46±0.348 flags, p=0.000), type DD (-2.92±0.378 flags, p=0.000) and type DS (-2.14±0.523 flags, p=0.000) patients. There were no significant differences in the number of flags reported between type DD and type DS patients (0.78±0.517 flags, p=0.792).
For clinician-reported yellow flags, there was also a statistically significant difference in the number of yellow flags reported for the four DRAM categories (F [3,126]=9.152, p=0.000). The Bonferroni post hoc test, however, revealed that clinicians reported a statistically higher number of yellow flags only for type DD patients compared with type N patients (3.11±0.6333 flags, p=0.000) and not type R or type DS patients.
Discussion
The relationship between psychosocial characteristics and patient outcomes is recognized. Several studies have shown that the long-term prognosis of patients with back pain can be predicted largely on the basis of psychosocial factors evident at presentation [18]. In their review, Nicholas et al. [11] concluded that the studies targeting interventions toward known psychological risk factors for disability reported more consistently positive outcomes relative to interventions that did not focus on these risk factors.
Geographical location can affect the presence of yellow flags based on factors such as the cost incurred to seek medical attention, access to health care, work culture, and social status. However, definite evidence to support the influence of geographical location on the presence of yellow flags has not been established.
Each yellow flag has been shown in various studies to be an important predictor of recovery from back pain. Lanier and Stockton [19] had found that in nonmanual workers, a history of anxiety or depression was a significant predictor of long-term disability in patients with LBP. Carragee et al. [20] had found that distressed patients had longer term disability, greater work loss, more frequent back pain episodes, and a 3 times higher use of medical resources compared with the control group. Linton [9] had shown that depression as a risk factor for pain problems in the back and neck was a consistent finding in the literature; and a systematic review by Pincus et al. [8] had shown that psychological factors such as distress, depression, and somatization were implicated in the transition from acute to chronic LBP.
The psychometric profile at baseline can predict both disability and health care resource use [20]. Pre-surgical psychological screening can also be useful in predicting the outcome of spinal surgery [21]. However, more research is required to demonstrate whether the early identification and treatment of these obstacles improves surgical treatment outcomes [22].
During this study, attention was focused on the identification of yellow flags. However, clinicians were poor at identifying these obstacles to recovery. This inability to identify obstacles is of concern, given the failure to identify and address them can result in poorer outcomes and inappropriate treatment.
In a recent systematic review by Hoy et al. [4], the greatest prevalence of LBP was among women and those aged between 40 and 80 years. Carragee et al. [20] had shown no significant differences in age or sex across risk groups. This study demonstrates that demographic factors of age and sex have little influence on the presence of yellow flags, although younger patients tended to be more anxious and have more uncertainty regarding the future.
Although we have shown no significant differences in yellow flags between surgical and nonsurgical patients, patients who had higher somatization scores or who overreported their symptoms were less likely to undergo surgical procedures. Previous studies have shown that somatization is correlated with poor outcomes [23,24]. Nickel et al. [25] had shown that patients with LBP who had somatization were at a higher risk of poor outcomes, and patients who had a lower health-related quality of life at follow-up correlated significantly with a higher tendency to somatize before treatment and at follow-up.
In our study, work status did not appear to correlate with patient-reported yellow flags. However, the MSPQ scores were higher in nonworking patients. The relationship between work status and psychosocial obstacles is likely to be complex. A review by Linton [26] had shown strong evidence that job satisfaction, monotonous tasks, work relations, demands, stress, and perceived ability to work were related to future back pain problems. Possible observational bias has been demonstrated in this study, with clinicians attributing more yellow flags to those not in employment, despite no significant difference in the patient-reported measures.
Psychosocial therapy for patients with low back-related disorders who are distressed and/or depressed can be difficult to implement, and many departments might not have the capacity or expertise to assist these groups of patients. Patients “at risk,” on the other hand, often require only simple advice and positive reassurance to prevent them from becoming depressed and or distressed. However, the ability of clinicians to identify this important and potentially readily treatable group of patients is also poor, as demonstrated in this study.
This study has some limitations. The treating clinicians were actively seeking yellow flags, which could therefore result in an overestimation. Also, the questionnaire used for both patients and clinicians was not validated but was adapted from a validated tool. The original acute low back screening questionnaire was judged to be too long to be clinically feasible for this study [16]. We therefore modified the original Yellow Flag Questionnaire and we accept its questionable validity as a potential weaknesses of this study, given it could have introduced some measurement bias.
However, patients with more yellow flags also demonstrated greater disability, poorer back function, greater somatization, and were depressed. We therefore believe that, given the correlations with other validated outcome measures were in the same direction, the adapted tool very likely satisfied its purpose in assisting with the identification of patient-reported yellow flags. Future research should validate these questionnaires and results, thus helping to build an objective and complete checklist for a simple screening tool.
Conclusions
We found that the ability of spine specialists to assess the presence of yellow flags and thus identify those possibly at risk of developing chronic back disorders is poor. The ability of clinicians to detect these obstacles to recovery can be improved by asking patients to complete a simple screening questionnaire. The results would enable us to undertake early targeted interventions to address these issues, which could result in better clinical outcomes and ensuring cost-effective health care utilization.
Notes
No potential conflict of interest relevant to this article was reported.

