Postoperative Loss of Lumbar Lordosis Affects Clinical Outcomes in Patients with Pseudoarthrosis after Posterior Lumbar Interbody Fusion Using Cortical Bone Trajectory Screw Fixation
Article information
Abstract
Study Design
Retrospective cohort study.
Purpose
This study aimed to investigate relationships between clinical outcomes and radiographic parameters in patients with pseudoarthrosis after posterior lumbar interbody fusion (PLIF).
Overview of Literature
In some patients with pseudoarthrosis after PLIF, clinical symptoms improve following surgery, although pseudoarthrosis can often be one of the complications. However, there are no previous reports describing differences between patients with pseudoarthrosis after PLIF who have obtained better clinical outcomes and those who have not.
Methods
Twenty-seven patients who were diagnosed with pseudoarthrosis after single-level PLIF with cortical bone trajectory screw fixation (CBT-PLIF) were enrolled in this study. They were divided into two groups based on mean improvement of 22 points on the Oswestry Disability Index (ODI) at the 2-year follow-up. Group G consisted of 15 patients who showed improvement on the ODI of ≥22 points, and group P consisted of the residual 12 patients. Radiographic parameters, percentage of slip, lumbar lordosis (LL), segmental lordosis, segmental range of motion, screw loosening, and subsidence were compared between the two groups.
Results
There were no significant differences between the two groups on radiographic parameters except for postoperative changes in LL. Although surgery-induced changes in LL showed no significant difference between the two groups, changes in LL from before surgery to 2-year follow-up and during postoperative 2-year follow-up were significantly better in group G (mean change of LL: +3.5° and +5.1°, respectively) compared to group P (mean change of LL: −4.6° and −0.5°, respectively) (p<0.01 and 0.05, respectively).
Conclusions
Patients with greater improvement in ODI gained LL over the 2-year follow-up, whereas patients with less improvement in ODI lost LL during the 2-year follow-up. These results indicate that there is a significant correlation between clinical outcomes and LL even in patients with pseudoarthrosis after single-level CBT-PLIF.
Introduction
Pseudoarthrosis is one of the major complications following posterior lumbar interbody fusion (PLIF). However, there remains controversy about its impacts after lumbar fusion surgery on clinical outcomes. Although some authors have reported that pseudoarthrosis decreased ambulation ability, impaired social life, and/or caused psychological disorders as clinical outcomes after lumbar fusion surgery [1,2], others have reported that patients with pseudoarthrosis have obtained clinical outcomes comparable to those who achieved bone union after lumbar arthrodesis after lumbar fusion surgery [3,4]. In fact, in some patients with pseudoarthrosis after PLIF have reported that their clinical symptoms improved satisfactorily after surgery. It is necessary to clarify differences between patients with pseudoarthrosis after PLIF who have obtained better clinical outcomes with those who have not. The purpose of this study was thus to investigate relationships between clinical outcomes and radiographic parameters in patients who have developed pseudoarthrosis after single-level PLIF.
Materials and Methods
1. Patients
There were 263 patients who underwent single-level PLIF with cortical bone trajectory screw fixation (CBT-PLIF) for degenerative lumbar disorders between September 2012 and October 2015 and were followed for at least 2 years after surgery. Of them, 236 patients were diagnosed with successful union. Successful unions were determined by confirming bridging bone linking cranial and caudal vertebrae around the intervertebral cage on computed tomography (CT) at 6 months after surgery, with neither loosening of pedicle screws nor motion of fused segments over 5° on dynamic radiographs. One-mm thick axial helical CT scans of fusion segments were performed on an 80-line multi-slice CT scanner (Aquilion ONE; Toshiba, Otawara, Japan), and coronal and sagittal multi-planar reconstruction CT (MPR-CT) images were created. Although the above-mentioned bone bridging on the MPR-CT 6 months after surgery was not found, if one of the four following findings—(1) absence of bridging bone linking cranial and caudal vertebrae around the intervertebral cage; (2) motion of the fused segment over 5°; (3) clear zone around the intervertebral cage; (4) loosening of pedicle screws—were found on dynamic radiographs in the standing position at 2 years after surgery, then patients were diagnosed as having pseudoarthrosis. Thus, based on these criteria, 27 patients were diagnosed as having pseudoarthrosis and were enrolled in this study. Preoperative diagnoses of these patients included degenerative spondylolisthesis for 20 patients, lumbar canal stenosis for six patients, and isthmic spondylolisthesis for one patient.
Clinical outcomes were assessed using the Oswestry Disability Index (ODI; range, 0 to 100 points) preoperatively and at 2 years postoperatively [5]. The mean ODI of the 27 patients improved significantly from 44.0 points before surgery to 21.8 points at the 2-year follow-up (mean improvement, 22.2 points; p<0.01) (Table 1). No further operations for pseudoarthrosis were performed as there was no deterioration of postoperative ODI compared to preoperative ODI in all 27 patients. The minimum clinically important difference (MCID) of the ODI was reported to be in the range of 5.2 points to 24 points [6-9]. Thus, the 27 patients were divided into two groups based on the mean improvement of the ODI. Group G consisted of 15 patients with improvement of ODI of ≥22 points, and group P consisted of the residual 12 patients who obtained improvement of ODI of <22 points. There were no significant differences in patients’ demographic characteristics and comorbidity between the two groups. Table 2 and Table 3 summarize the patients’ demographic characteristics and comorbidities respectively.
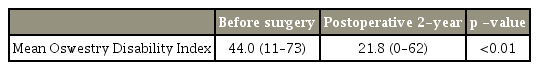
Clinical outcomes in 27 patients with pseudoarthrosis
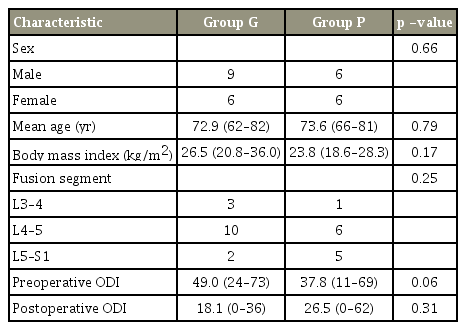
Demographic characteristics of 27 patients with pseudoarthrosis

Correlations between comorbidities and clinical outcomes
The Kansai Rosai Hospital ethics committee approved the protocol and informed consent was obtained from all participants before participating in the study.
2. Radiologic evaluations
In respect to radiographic parameters, the percentage of slip (% slip=distance of slip/antero-posterior length of the cranial end plate of the caudal vertebra), lumbar lordosis (LL; Th12−S1), segmental lordosis (SL), segmental range of motion, the existence of screw loosening, and the extent of subsidence of cages were compared between the two groups using dynamic radiographs taken before surgery in the standing and again immediately after surgery and at the 2-year follow-up. A single examiner (A.Y.) measured these radiographic parameters. The percentage of slip was evaluated only in 21 patients who were preoperatively diagnosed with degenerative spondylolisthesis or isthmic spondylolisthesis as the other six patients who were diagnosed with lumbar canal stenosis had a foraminal stenosis without slip.
3. Statistical analysis
Statistical analysis was performed using Statcel 4 software (OMS Publishing Inc., Saitama, Japan). Wilcoxon’s signedrank test was used to analyze the changes between mean pre- and postoperative ODI. Fisher’s exact probability test was performed to investigate the correlation between clinical outcomes and comorbidities. The Mann-Whitney’s U-test was used for comparison of demographic data between the two groups. Student t-test was used to compare radiological parameters between the two groups. Values of p<0.05 were considered to be statistically significant.
Results
There were no significant differences in preoperative and immediate postoperative % slip between group G (12.9%, 9.9%) and group P (12.8%, 11.5%) (p=0.96, p=0.47, respectively) (Fig. 1). There were no significant differences between preoperative SL (group G: 8.8° versus group P: 9.4°, p=0.77), immediate postoperative SL (group G: 6.9° versus group P: 9.5°, p=0.22), 2-year postoperative SL (group G: 6.0° versus group P: 6.9°, p=0.63) and changes of SL from before surgery to immediately after surgery (group G: −1.9° versus group P: +0.1°, p=0.23), the changes of LL from before surgery to 2-year follow-up (group G: −2.8° versus group P: −2.5°, p=0.92) and the changes over the postoperative 2 years (group G: −0.9° versus group P: −2.6°, p=0.17) (Figs. 2, 3).
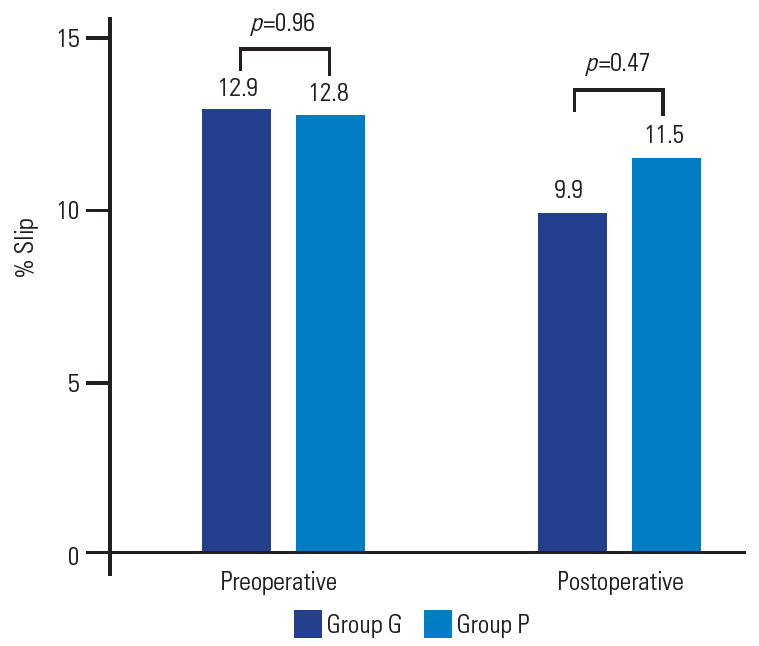
Percentage of slip (% slip). There were no significant differences in preoperative % slip and postoperative % slip between the two groups.

Segmental lordosis. No significant differences are found in preop, immediate postop, and 2-yr postop segmental lordosis between the two groups. Preop, preoperative; Postop, postoperative; 2-yr postop, 2-year postoperative. a)p=0.77. b)p=0.22. c)p=0.63.
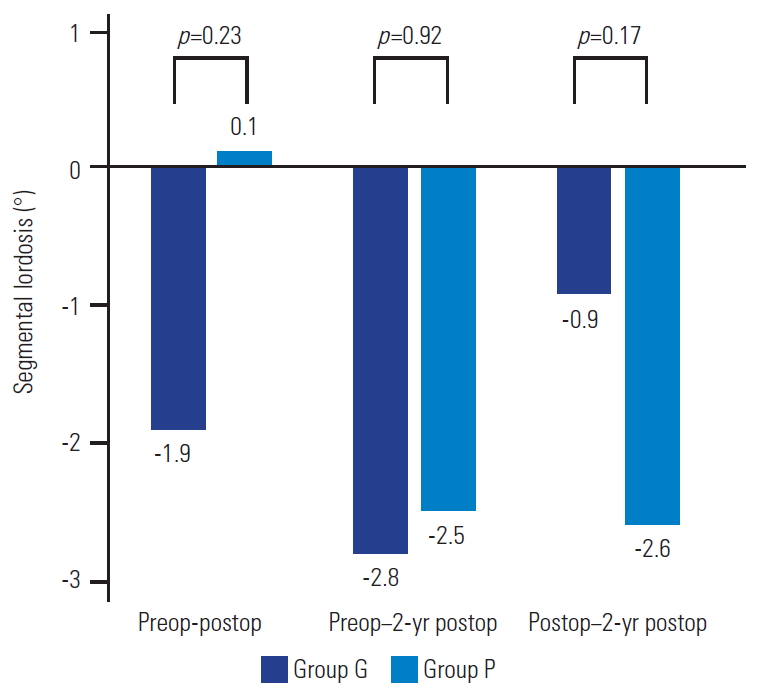
Changes of segmental lordosis. There were no significant differences in changes of segmental lordosis from before surgery (preop) to immediately after surgery (postop), from before surgery (preop) to 2-yr postop follow-up, and from immediately after surgery to 2-yr postop follow-up between the two groups. Preop, preoperative; Postop, postoperative; 2-yr postop, 2-year postoperative.
Segmental range of motion at 2-year follow-up was not significantly different between the two groups either (group G: 4.9° versus group P: 5.8°, p=0.41) (Fig. 4). Neither the incidence of screw loosening at the 2-year follow-up (group G: eight patients versus group P: four patients, p=0.38) nor the extent of subsidence of cages (group G: 0.97 mm versus group P: 1.01 mm, p=0.63) showed significant differences (Table 4). In contrast to postoperative loss of SL, postoperative 2-year LL tended to be more lordotic in group G compared to group P, although no significant differences were found (group G: 37.1° versus group P: 28.3°, p=0.099) (Fig. 5). Although the changes of LL from before surgery to immediately after surgery showed no significant difference between the two groups (group G: −1.7° versus group P: −4.1°, p=0.28), the changes of LL from before surgery to 2-year follow-up and the changes over the postoperative 2 years were significantly better in group G (mean changes of LL: +3.5° and +5.1°, respectivey) than in group P (mean changes of LL: −4.6° and −0.5°, respectively) (p<0.01 and p=0.042, respectively) (Fig. 6).

Segmental range of motion. Segmental range of motion at 2-year follow-up is not significantly different between the two groups.

Screw loosening and extent of cage subsidence
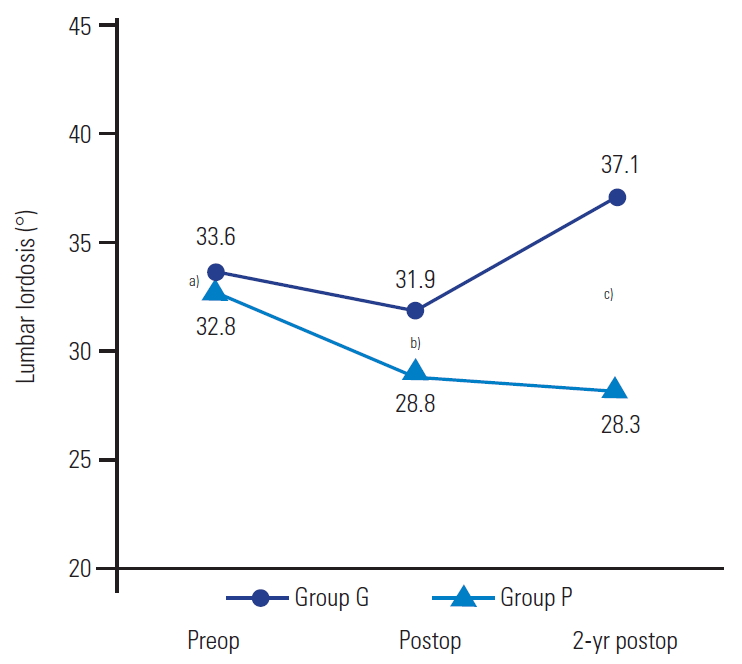
Lumbar lordosis. 2-yr postop lumbar lordosis tends to be more lordotic in the group G than in the group P, although no significant difference is found between the two groups: a)p=0.86, b)p=0.43, and c)p=0.099. Preop, preoperative; Postop, postoperative; 2-yr postop, 2-year postoperative.

Changes of lumbar lordosis. Whereas the change of lumbar lordosis from before surgery (preop) to immediately after surgery (postop) shows no significant difference between the two groups, the change of lumbar lordosis from before surgery to 2-yr postop follow-up and the change over the 2 postoperative years are significantly better in the group G than in the group P. Preop, preoperative; Postop, postoperative; 2-yr postop, 2-year postoperative.
Discussion
Although pseudoarthrosis after lumbar fusion surgery is a known complication that should normally be avoided, it does occur quite frequency. The impacts of pseudoarthrosis following lumbar fusion surgery on clinical outcomes remain controversial. Previous studies have found an unfavorable impact of pseudoarthrosis on clinical outcomes [1,2]. Makino et al. [1] reported that patients with pseudoarthrosis after PLIF had lower ambulatory ability evaluated by the Japan Orthopaedic Association Back Pain Evaluation Questionnaire (JOABPEQ) at 2-year follow-up [10]. In contrast, other surgeons have reported statistically comparable clinical outcomes of patients with pseudoarthrosis after PLF to those of patients with rigid fusion [4,11]. In fact, clinical symptoms improve satisfactorily after surgery in some patients with pseudoarthrosis after PLIF. However, there have been no previous studies analyzing prognostic factors for clinical outcomes of patients with pseudoarthrosis after lumbar fusion surgery, excluding those with fusion status. Currently, this is the first report of its kind to investigate relationships between clinical outcomes and radiographic parameters in patients who had developed pseudoarthrosis after single-level PLIF.
ODI was adopted to estimate whether operations were effective in this study, although the minimum acceptable change of clinical outcome remains controversial. Research has been conducted previously to determine MCID of the ODI have been carried out and these values were reported in a range of 5.2–24 points. Of course, MCID values vary widely depending on research subject and/or methods applied. It was decided that mean improvement of the ODI of 22 points in this study was an appropriate threshold to determine effectiveness of lumbar fusion surgery as this value has a stricter threshold compared to the MCID for the ODI of 15 points recommended by the FDA for lumbar fusion surgery.
In the present study, LL increased significantly after surgery in patients with good clinical outcomes, whereas patients with a lower improvement of ODI lost LL during the postoperative 2 years. In respect to the changes of LL after lumbar spine surgery, LL reportedly increased after decompression surgery including lumbar laminectomy [12]. Cheng et al. [10] found improved LL after single-level TLIF resulting from spontaneous restoration of lordosis at the unfused lumbar levels, even when an increased segmental lordotic angle could not be obtained at the fused segment. In addition, the effects of LL after lumbar arthrodesis on clinical outcomes have been reported in previous studies. Makino et al. [1] reported that postoperative loss of LL after PLIF induced pain-related disorders led to social life disruption and psychological disorders upon JOABPEQ evaluation. Matsumoto et al. [13] showed that the risk of adjacent segment disease increased in patients without postoperative restoration of LL. Another issue with decreased LL that has previously been reported is persistent low back pain that afflicts patients postoperatively [3] and can make day-to-day life activities more difficult. These results indicate that the same reactive improvement of LL at the unfused lumbar levels after single-level CBT-PLIF may lead to positive clinical outcomes even in patients with pseudoarthrosis.
As a matter of course, pseudoarthrosis after lumbar fusion surgery should be prevented, and development of surgery, instrumentations and materials may help to decrease incidences of pseudoarthrosis; however, it cannot be prevented completely yet. This study may help for decision-making regarding reoperation for pseudoarthrosis after lumbar fusion surgery.
The study is not without its limitations. First, it was retrospective in nature. Second, the number of patients enrolled in this study was relatively small, which may have resulted in lower statistical power. Third, the follow-up period of 2 years was relatively short. Fourth, the effects of global spinal parameters on clinical outcomes were not examined using radiographs of the whole spine, and neither health-related quality of life (HRQOL), such as the Short Form-36, nor Visual Analog Scale (VAS) scores for low back and leg pain were examined. Fifth, it was not possible to determine whether the improvement of clinical outcomes resulted from increasing lordosis. A further long-term prospective study is necessary with a larger patient population and evaluation of whole spine radiographs, HRQOL, and VAS scores for low back and leg pain to gain further insight.
Conclusions
From the 27 patients with pseudoarthrosis following single-level CBT-PLIF, it was seen that the lumbar spine became increasingly lordotic during the 2 postoperative years in a total of 15 patients with better postoperative improvement of the ODI, whereas 12 patients with poor postoperative improvement of the ODI lost LL during the 2 postoperative years. These results indicate that postoperative loss of LL is significantly associated with clinical outcomes even in patients with pseudoarthrosis after single-level CBT-PLIF.
Notes
No potential conflict of interest relevant to this article was reported.