Risk Factors for 30- and 90-Day Readmission due to Intestinal Bowel Obstruction after Posterior Lumbar Fusion
Article information
Abstract
Study Design
A retrospective analysis of data from the Healthcare Cost and Utilization Project Nationwide Readmissions Database (HCUP-NRD).
Purpose
To identify the perioperative characteristics associated with 30-day and 90-day readmission due to intestinal bowel obstructions (IBOs) following posterior lumbar fusion (PLF) procedure.
Overview of Literature
PLF procedures are used to repair spinal injuries and curvature deformities. IBO is a common surgical complication and its repair often necessitates surgery that increases the readmission rates and healthcare costs. Previous studies have identified the preoperative risk factors for 30-day readmissions in PLF; however, no study has specifically investigated IBO or identified risk factors for 90-day readmissions.
Methods
Data on demographic characteristics and medical comorbidities of patients who underwent PLF with subsequent readmission were obtained from the HCUP-NRD. The perioperative characteristics that were significantly different between patients readmitted with and without an active diagnosis of IBO were identified with bivariate analysis for both 30-day and 90-day readmissions. The significant characteristics were then included in a multivariate analysis to identify those that were independently associated with 30-day and 90-day readmissions.
Results
Drug abuse (odds ratio [OR], 4.00), uncomplicated diabetes (OR, 2.06), having Medicare insurance (OR, 1.65), age 55–64 years (OR, 2.42), age 65–79 years (OR, 2.77), and age >80 years (OR, 3.87) were significant risk factors for 30-day readmission attributable to IBO after a PLF procedure.
Conclusions
Of the several preoperative risk factors identified for readmission with IBO after PLF surgery, drug abuse had the strongest association and was likely to be the most clinically relevant factor. Physicians and care teams should understand the risks of opioid-based pain management regimens, attempt to manage pain with a multimodal approach, and minimize the opioid use.
Introduction
Postoperative pain management has been associated with improved patient satisfaction, decreased hospital costs, and a lower complication rate [1]. Unrelieved postoperative pain can contribute to a wide range of adverse clinical complications, such as pulmonary embolism, pneumonia, coronary ischemia, deep vein thrombosis, myocardial infarction, poor wound healing, stress, anxiety, and depression [2]. Commonly, orthopedic physicians prescribe opioid-based pain-relief medications after the surgery [3]. These opioid prescriptions are associated with significant adverse effects, including sedation, vomiting, physical dependence, respiratory dependence, depression, and constipation [4]. Opioid-induced bowel dysfunction (OIBD) has been heavily studied owing to its debilitating complications, such as constipation, bloating, and gastroesophageal reflux [5]. Constipation is the most common adverse effect, and patients rarely develop tolerance to the constipation-inducing effect of opioids [6]. About 40% of all non-cancer patients on opioid therapy develop constipation, defined as <3 complete bowel movements per week [7]. OIBD complications can act as a significant barrier to effective pain management, leading to poorer outcomes [8].
In spite of these complications, opioids are the mainstay of pain management in many patients who are undergoing spine surgery; 66% of all postoperative patients are on an opioid regimen [9]. Posterior lumbar fusion (PLF) surgery is a commonly performed procedure that is used to treat a wide array of spinal pathologies with a dramatic 30% increase in the number of procedures from 2007 to 2015 [10].
Intestinal bowel obstructions (IBOs) have been reported following spine surgery, especially after the implementation of an opioid-dependent pain management program [11]. This complication worsens with heavy postoperative opioid pain management regimens, often needs to be corrected with surgical repair, and compounds the complications associated with the initial PLF procedure [12]. Multiple studies have demonstrated that opioid regimens are not superior in terms of patient outcome compared to a multimodal analgesia approach [13]. Thus, identifying PLF patients at risk for IBO to help build an appropriate perioperative pain regiment may improve outcomes, decrease the hospital stay, and lower the rate of chronic pain [14].
This study aimed to identify risk factors associated with 30-day and 90-day readmission due to IBO following PLF procedures using a National Readmission Database (NRD) and discuss the possible clinical options in order to improve patient outcomes.
Materials and Methods
This retrospective analysis used the Healthcare Cost and Utilization Project (HCUP) NRD, a nationwide readmissions dataset that includes information about over 17 million discharges (36 million weighted readmission events) and demographic information from 27 states, accounting for >50% of the resident population of the United States and >50% of all US hospital readmissions. This analysis included data from 2012 to 2014 and the International Statistical Classification of Disease, ninth revision, clinical modification (ICD-9-CM) codes for procedure and diagnostic billing. The years 2015 to 2016 were not included due to a transition period within the HCUP-NRD dataset of ICD-9 to ICD-10 and inconsistent procedural billing nomenclature that resulted from this transition [10]. Institutional Review Board approval was not required for the submitted work at Icahn School of Medicine at Mount Sinai.
1. Patient demographics
Individuals aged ≥18 years who underwent PLF between 2012 and 2014 based on the ICD-9 procedure codes 81.05, 81.07, and 81.08 were included in the analysis. Patients were additionally required to have a diagnosis of disc disorder, spinal stenosis, or degeneration upon index admission that was identified using the following ICD-9-CM codes: 722.00–722.90 (intervertebral disc disorders), 724.0 (ankylosing spondylitis), and 738.4 (acquired spondylolisthesis).
Patient demographics included age, sex, insurance status, and urban/rural location. Age was bucketed into the following five categories as per age ranges: ≤45, 45–54, 55–65, 65–79, or ≥80 years. Sex was defined as a dichotomous variable, classified as male or female. Insurance status was divided into the following five categories: private, Medicare, Medicaid, uninsured, and other. Urban/rural location was divided into the following six categories: central counties of metropolitan areas of ≥1 million population, fringe counties of metropolitan areas of ≥1 million population, counties in metropolitan areas with 250,000–999,999 population, counties in metropolitan areas with 50,000–249,999 population, micropolitan counties, and others.
Preoperative patient characteristics were defined using the Agency for Healthcare Research and Quality Comorbidity Measure that was based on the ICD-9-CM diagnosis codes and diagnosis-related group codes. Comorbidities included in the analysis were diabetes (uncomplicated or complicated with chronic complications), alcohol or drug abuse, pulmonary comorbidity (chronic pulmonary disease or pulmonary circulation disease), cardiovascular comorbidity (congestive heart failure, hypertension, peripheral vascular disease, or valvular disease), gastrointestinal comorbidity (liver disease or peptic ulcer excluding bleeding), renal comorbidity (fluid and electrolyte disorders or renal failure), hematological comorbidity (acquired immune deficiency syndrome, deficiency anemia, chronic blood loss anemia, coagulopathy, or lymphoma), and other comorbidities (rheumatoid arthritis, collagen vascular diseases, depression, hypothyroidism, paralysis, or psychoses). Further details about the specific definitions of variables were present in the NRD database.
Patients discharged against medical advice, those who underwent non-elective surgery, those with a length of hospital stay >365 days, and those died during hospitalization were excluded. Moreover, patients who had undergone procedures during October, November, or December of each respective calendar year were excluded because their patient outcomes could not be tracked for 90 calendar days. Individuals with missing data, those with a diagnosis of cancer of the brain or the nervous system, those who were currently on maintenance chemotherapy or radiotherapy, and those who were discharged to a court/law enforcement or unknown locations were also excluded.
2. Baseline patient characteristics and comparisons
Only patients with the aforementioned PLF codes were analyzed and categorized into the following two groups for 30-day and 90-day analysis: IBO readmissions group and non-readmissions group. The IBO group included all patients who had an active diagnosis of IBO upon readmission, and the non-IBO group included all the remaining patients in the cohort who were readmitted for all other reasons except IBO.
Bivariate analysis was performed to compare the patient demographics and preoperative comorbidities, including diabetes and drug abuse, of the two groups using Pearson’s chi-square test to determine the significance of differences in the baseline variables. Statistical significance was set at a level of p<0.05 and adjusted for multiple testing using Bonferroni correction based on the subset population size. Any variables with <5% minority class were excluded from the analysis to maintain the statistical integrity of the model. Characteristics that resulted in a p-value <0.05 on bivariate analysis were included in a weight-adjusted multivariate regression (MVR) analysis, adjusting for patient demographics and comorbidities to identify the independent predictors of 30-day and 90-day readmissions related to PLF. All the statistical analyses were performed using R ver. 3.4.4 (open source; The R Foundation for Statistical Computing, Vienna, Austria).
Results
1. Study population
Total 65,121 patients fulfilled our selection criteria. Of these patients, 3,788 (5.8%) were readmitted within 30 days, and 156 (0.24%) were readmitted with an active diagnosis of IBO. At 90 days after discharge, 6,092 patients (9.3%) were readmitted and 226 (0.35%) were readmitted with an active diagnosis of IBO.
2. Bivariate analysis
Baseline values for demographic and perioperative characteristics for 30-day and 90-day readmissions due to IBO after PLF are summarized in Tables 1 and 2, respectively. Bivariate analysis for 30-day readmission due to IBO demonstrated a significant difference (p<0.001) between the control group and outcome for the payment type, age range, and renal failure (p<0.001). Bivariate analysis for 30-day readmission attributable to IBO also demonstrated a significant difference between the control group and outcome group in terms of uncomplicated diabetes, chronic hypertension, drug abuse, fluid and electrolyte disorders, and coagulopathy (p<0.01). Further, obesity and weight loss were found to be significant predictors of 30-day readmission attributable to IBO following PLF (p<0.05). There were no significant differences in any of the remaining baseline variables. The results have been summarized in Table 1.
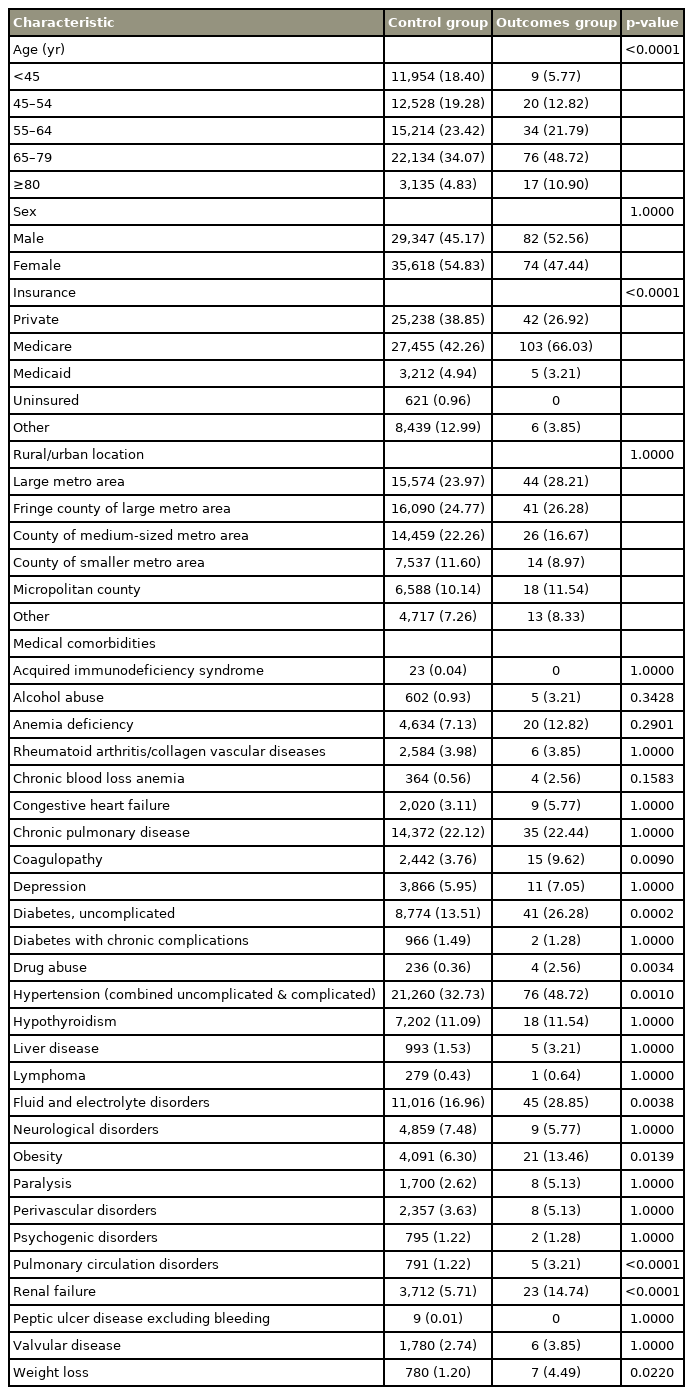
Baseline patient variables in the 30-day readmission cohort

Baseline patient variables in the 90-day readmission cohort
Bivariate analysis for 90-day readmission due to IBO demonstrated that there were significant differences in terms of the payment type, age range, obesity, chronic hypertension, weight loss, and renal failure (p<0.001) (Table 2). Bivariate analysis for 90-day readmissions attributable to IBO showed significant differences (p<0.01) between the control group and outcome group for uncomplicated diabetes, drug abuse, as well as fluid and electrolyte disorders (p<0.01). Moreover, preoperative deficiency anemia was a significant predictor of 90-day readmission attributable to IBO following PLF (p<0.05). All other comorbidities were non-significant factors. The results have been summarized in Table 2.
3. Multivariate analyses
Results of the MVR analysis for 30-day and 90-day readmissions related to IBO post-PLF are outlined in Tables 3 and 4, respectively. In the 30-day analysis, the following variables were independent predictors of IBO-related readmissions: drug abuse (odds ratio [OR], 4.00; 95% confidence interval [CI], 1.76–9.09; p<0.001), weight loss (OR, 3.27; 95% CI, 2.08–5.14; p<0.001), and uncomplicated diabetes (OR, 2.06; 95% CI, 1.62–2.60; p<0.001). Furthermore, age was a significant independent predictor of IBO-related 30-day readmissions: 55–64 years (OR, 2.42; 95% CI, 1.42–4.13; p<0.01), 65–79 years (OR, 2.77; 95% CI, 1.57–4.08; p<0.001), and >80 years (OR, 3.87; 95% CI, 2.04–7.33; p<0.001). In this analysis, Medicare insurance was a significant risk factor for 30-day readmission after PLF with an IBO (OR, 1.65; 95% CI, 1.18–2.29; p<0.01). Other significant predictor variables were also identified (Table 3).

Multivariate regression analysis of independent predictors of intestinal bowel obstruction-related 30-day readmission

Multivariate regression analysis of independent predictors of septicemia-related 90-day readmission
In the 90-day analysis, the following variables were independent predictors of IBO-related readmissions: drug abuse (OR, 3.94; 95% CI, 1.91–8.15; p<0.001), weight loss (OR, 3.19; 95% CI, 2.16–4.71; p<0.001), uncomplicated diabetes (OR, 1.53; 95% CI, 1.24–1.88; p<0.001), Medicare insurance (OR, 1.76; 95% CI, 1.33–2.32; p<0.001), and obesity (OR, 1.71; 95% CI, 1.31–2.23; p<0.001). Furthermore, age was a significant independent predictor of IBOrelated 90-day readmissions: 55–64 years (OR, 2.01; 95% CI, 1.35–2.98; p<0.001), 65–79 years (OR, 2.23; 95% CI, 1.46–3.42; p<0.001), and >80 years (OR, 4.11; 95% CI, 2.54–6.63; p<0.001). Other significant predictor variables were also identified (Table 4).
Discussion
We found that drug abuse, uncomplicated diabetes mellitus, higher age, having Medicare insurance, and weight loss were the most important independent risk factors for IBO-related readmissions at both 30-days and 90-days after discharge following PLF.
1. Drug abuse
Of the studied variables, drug abuse before PLF had the strongest correlation with the 30-day and 90-day readmissions attributable to IBO. Patients with a history of drug abuse had an almost 4 times higher readmission risk at 30-days and 90-days because of IBO than other patients. Opioid-tolerant patients frequently present with increased postoperative complications and worse clinical outcomes owing to their higher perioperative opioid requirements. These patients are at a significant risk of physiologic withdrawal because their daily opioid intake may be significantly greater than their therapeutic prescription strength. Long-term opioid users also undergo neuroadaptation that prevents the ability of the opioids to provide a long-term analgesic effect and can produce the opposite effects of “opioid-induced hyperalgesia [15].” Thus, it is critical for physicians to preoperatively screen patients for drug abuse and consider an opioid rotation to improve analgesia with close monitoring for its efficacy [16].
Perioperative prescriptions of opioids and opioid abuse and addiction have been important topics for the medical community and media for more than a decade. Several solutions have been proposed to reduce the impact of prescribers on the opioid epidemic. The enhanced recovery after surgery pathway (ERAS) is one of the largest movements for preventing the over-prescription of opioids and improving postoperative patient outcome. The implementation of a multimodal analgesic pathway to reduce opioid dependence is a pillar of ERAS. The multimodal analgesic regiment begins preoperatively with a combination of cyclooxygenase-2 (COX-2) inhibitors, nonsteroidal antiinflammatory drugs (NSAIDs), and a gabapentinoids in patients without contraindications.
NSAIDs and COX-2 are used as safe and effective postoperative pain management drugs (unless contraindicated) because they increase patient satisfaction and decrease the opioid requirements and the development of opioid-induced adverse effects [17]. Furthermore, the use of gabapentinoids in spine surgery reduces postoperative pain, total morphine consumption, and morphine-related complications, such as constipation [18]. Similar to any medication, gabapentinoids exert several significant adverse effects, such as increased postoperative sedation, dizziness, and visual disturbances; the optimal dosing regimen and administration duration require further exploration [19]. Another class of pain medications, NDMA inhibitors, such as ketamine and dextromethorphan, are effective in decreasing intravenous patient morphine use, postoperative nausea, and postoperative vomiting when administered at lower doses post-operatively [20]. Finally, lower-dose tramadol (1 mg/kg) with acetaminophen can be used in combination to treat postoperative pain owing to its comparable analgesic effects and lower nausea than higher-dose tramadol (1.5 mg/kg) and acetaminophen. It is noteworthy that methadone and buprenorphine are not frequently used because of the high prevalence of constipation and reduced patient quality of life [21].
It is vital that patient-care teams build an effective perioperative multimodal analgesic pathway to reduce the requirement of opiates and thus lower the occurrence of opiate-induced complications. This may prevent readmissions because of IBO; alternative opioid substitutes are not the optimal option for patients unless absolutely necessary.
2. Uncomplicated diabetes
Patients with uncomplicated diabetes had 2.06 times and 1.53 times higher risk of readmission at 30 days and 90 days, respectively, following PLF. Diabetes has been associated with numerous complications after PLF surgery in other studies, including a higher risk of needing a blood transfusion and developing surgical site infection during their inpatient stay. Diabetic patients present a challenging patient cohort because of the variety of pre- and postoperative complications, ranging from intense neuropathy and end-stage renal disease to bowel obstruction [22]. Constipation is one of the most common gastrointestinal symptoms in diabetic patients. Serious symptoms in these diabetic patients are treated with opioids. One study showed that nearly 24% of 400,000 diabetic community patients were on an opioid-regiment for symptom and pain management [23]. Despite these high numbers, the administration of high-dose opioids in diabetic patients is associated with poorer blood glucose control. Few studies have suggested that diabetic drugs do not increase the risk of constipation, and preoperative blood glucose control improves outcomes in diabetic patients [24]. Reducing opioid usage, controlling blood glucose, and prescribing probiotics to improve gut motility can lower the patient readmission rate and reduce the rates of bowel obstruction in diabetic patients after PLF.
3. Medicare
At both 30 days and 90 days after PLF, patients with Medicare insurance had 1.65 times and 1.76 times higher risk, respectively, of being readmitted with an active diagnosis of IBO. Medicare insurance is associated with an older population compared to other forms of insurance, who also have an increased risk of IBO. In 2017, about 75% of Medicare enrollees were aged ≥55 years, the same age at which we observed an increased risk of IBO after PLF [25]. More recently, there has been an increasing trend in drug intake for chronic pain management in elderly patients (9.0% in 2010 versus 4.1% in 1999), most commonly hydrocodone combined with acetaminophen or ibuprofen [26]. Furthermore, nursing patients, often the elderly, are more likely to be enrolled in Medicare insurance and receive higher potency opioids (e.g., oxycodone) than their community-dwelling counterparts (who are mostly administered tramadol) [27]. In spite of the widespread use of powerful opioids for pain management, there is no conclusive evidence in the favor of the long-term (>1 year) use of opioids over that of non-opioid-based analgesics [28]. Furthermore, age-based pharmacokinetic changes in opioid elimination from the body are well-known owing to decline in hepatic and renal functions with increasing age [29]. Thus, for patients aged >55 years, surgeons must accurately reconcile their current drug use and prescribe limited opioid dosing when appropriate. Further, non-pharmacologic modalities, such as Tai Chi, mindfulness-based stress reduction, yoga, and other strength exercises help reduce pain in this population and may decrease the pharmacologic needs [30].
4. Weight loss
At both, the 30-day and 90-day time points, after PSF surgery, drug abuse had the highest effect on IBO-related readmission, following by a medical comorbidity of known weight loss. At 30 days, the OR of readmission was 3.27 (95% CI, 2.08–5.14; p<0.0001) and at 90 days, it was 3.19 (95% CI, 2.16–4.72; p<0.0001). Malnutrition is a known independent risk factor for readmission to the hospital after discharge at both, the early and late time points and for death after hospital discharge. The immediate postdischarge period has been described as a fragile period with respect to patient vulnerability owing to impaired physiologic systems after hospital discharge, decreased mobility, and possible new post-surgical pain. When combined with the added physiologic stress of surgery, these factors may worsen the nutritional status in elderly patients. Special care is required to maintain a healthy nutritional status among patients before the surgery and during index hospitalization, especially in elderly subjects who are most likely to develop malnutrition. Inpatient or community-based consultation and collaboration with certified dieticians, when available, may help patients who are at the highest risk of nutritional deficits that can lead to concomitant comorbidity after surgery.
5. Limitations
There were certain limitations of this study. First, the NRD only included data from the participating HCUP partners; thus, the data from the remaining 50.7% hospitalizations from non-participating states were not included in the analysis. Second, the coding system used in the NRD lacks granular data and does not indicate the etiology of the comorbidity variables. Thus, it is difficult to establish whether comorbidity variables are independent of each another or have a causal relationship. Furthermore, the NRD did not break down drug abuse by substance, length, or severity of the addiction; this classification would have helped in narrowing down more specific risk factors for IBO after PLF.
Conclusions
This study utilized the HCUP-NRD to identify the independent risk factors for 30-day and 90-day readmission with IBO after PLF. Variables that were significantly associated with an increased risk of both 30-day and 90-day readmission attributable to IBO were drug abuse, diabetes, and Medicare insurance. It is crucial for physicians and care teams to understand the risks of opioid-based pain management regiments and attempt to manage pain with non-opioid solutions first. If these approaches prove ineffective in pain management, the lowest tolerated dosage of opioids should be used with careful monitoring. Changing habitual practices related to opioid prescription is crucial for reducing the readmissions attributable to IBO after PLF.
Notes
No potential conflict of interest relevant to this article was reported.