Postoperative Epidural Fibrosis Prevention: Which Is Better–Autologous Fat versus Gelfoam
Article information
Abstract
Study Design
Prospective, randomized study of 100 patients with prolapsed intervertebral disc with an average of 12- to 18-month follow-up postoperatively.
Purpose
To compare the role of Gelfoam and autologous fat in the prevention of postoperative epidural fibrosis (EF) after lumbar spine surgery.
Overview of Literature
EF is a possible sequelae of lumbar disc surgery. Different treatments and surgical strategies have been attempted to prevent postoperative fibrosis without providing consistent long-term results.
Methods
The study was conducted on 100 adult patients. The patients were randomly allocated into two groups of 50 patients each: group A, autologous fat group, and group B, Gelfoam group. The postoperative follow-up was conducted at intervals of 6 weeks, 3 months, 6 months, and 12 months. Both groups were evaluated clinically (Oswestry Low Back Pain Disability Questionnaire [ODI], Visual Analog Scale [VAS], Straight Leg Raising Test [SLRT]) and radiologically (using Ross grading by contrast magnetic resonance imaging [MRI]) for development of radicular pain and hence EF.
Results
Based on the analysis, improvement in mean values of ODI score, VAS score, and SLRT were found to be statistically significant postoperatively at intervals of 6 weeks, 3 months, 6 months, and 12 months when compared individually in both groups. However, improvement was greater in the autologous fat group than in the Gelfoam group. Based on contrast-enhanced MRI, the number of patients who developed EF was smaller in the autologous fat group than in the Gelfoam group.
Conclusions
In the present study, on clinical and radiological assessment, we conclude that both groups prevent radicular pain and postoperative EF individually but relatively autologous fat was found to be more effective than Gelfoam in the prevention of EF and hence radicular pain.
Introduction
Although spine surgery has proved its unambiguous application in the management of prolapsed intervertebral disc (PIVD) in the lumbar spine in the last 20 years, some patients still develop radiating leg pain or other symptoms after surgery for PIVD. The formation of fibrosis (also known as epidural fibrosis [EF]) and adhesion to the dura mater of spinal cord are the most common causes. The formation and repair process of scar tissue can be classified into three phases [1]. The first phase is local inflammatory reaction (first 3–5 days postoperatively), which includes hemostasis and coagulation process and chemokine release, such as phospholipase A2, which cause aggregation of macrophagocytes, fibroblasts, mastocytes, and endotheliocytes [2]. The second phase (2–3 weeks) includes fibroblast proliferation and differentiation into fibrocytes, which secrete collagenous fibers in the defect lesion and form granulation tissues. Gradually, fibroblast proliferation, immigration, and extracellular matrix synthesis are regulated by various cytokines, such as transforming growth factor (TGF)-β1, interleukin-6 (IL-6), and fibroblast growth factor (FGF). Fibroblasts can also secrete TGF-β1, IL-6, and FGF-2 and help improve fibroblast proliferation and extracellular matrix synthesis [3]. During the third phase, there is tissue reconstruction (months to years). Fibrillar connective tissues deposit around the defect lesion and transform into scar tissues or EF [4].
In fact, it commonly develops after 6–12 months even in patients with satisfactory surgical outcomes and patients with failed surgical outcomes. This is usually preceded by an initial period of pain relief, after which the patient gradually develops radiating leg or back pain. Scar tissue (EF) is one of the causes of postoperative pain, which is a component of failed back surgery syndrome [5–7].
EF is a possible sequelae of lumbar spine surgery. Symptoms of EF are moderate to severe pain in the back, gradual and noticeable increase in pain few weeks to months postoperatively, and radiating pain in one or both legs [8]. There is no absolute effective technique that is currently available to reduce EF after lumbar disc surgery. Many methods have been attempted to minimize postoperative EF, but none of the techniques have been found to be ideal. EF still forms even in minimally invasive interventions. Theoretically speaking, decreasing the amount of postoperative hematoma and, hence, transforming it into fibrous tissue or creating a barrier between the dura mater and overlying structure are the possible methods of reducing the risk of EF [2].
Various methods have been attempted to prevent postoperative radiculopathy, e.g., continuous drainage of wound hematoma using vacuum suction drain technique for 48 hours postoperatively, autologous fat, silastic, Gelfoam, carbohydrate polymers, Dacron, methacrylate, and steroids injected locally by providing a barrier in epidural space and preventing fibrosis [3].
Hence, the present study was conducted to compare the role of Gelfoam and autologous fat in the prevention of postoperative EF in lumbar spine surgery.
Materials and Methods
A total of 100 patients of lumbar disc prolapse admitted in the orthopedics department who fulfilled the inclusion criteria were included. They were divided into two groups of 50 patients each: group A, autologous fat, and group B, Gelfoam (Fig. 1). The institutional review board of Guru Gobind Singh Medical College approved this study (IRB approval no., Trg/2019/8348-44). Informed consent was obtained from all individual participants included in the study.
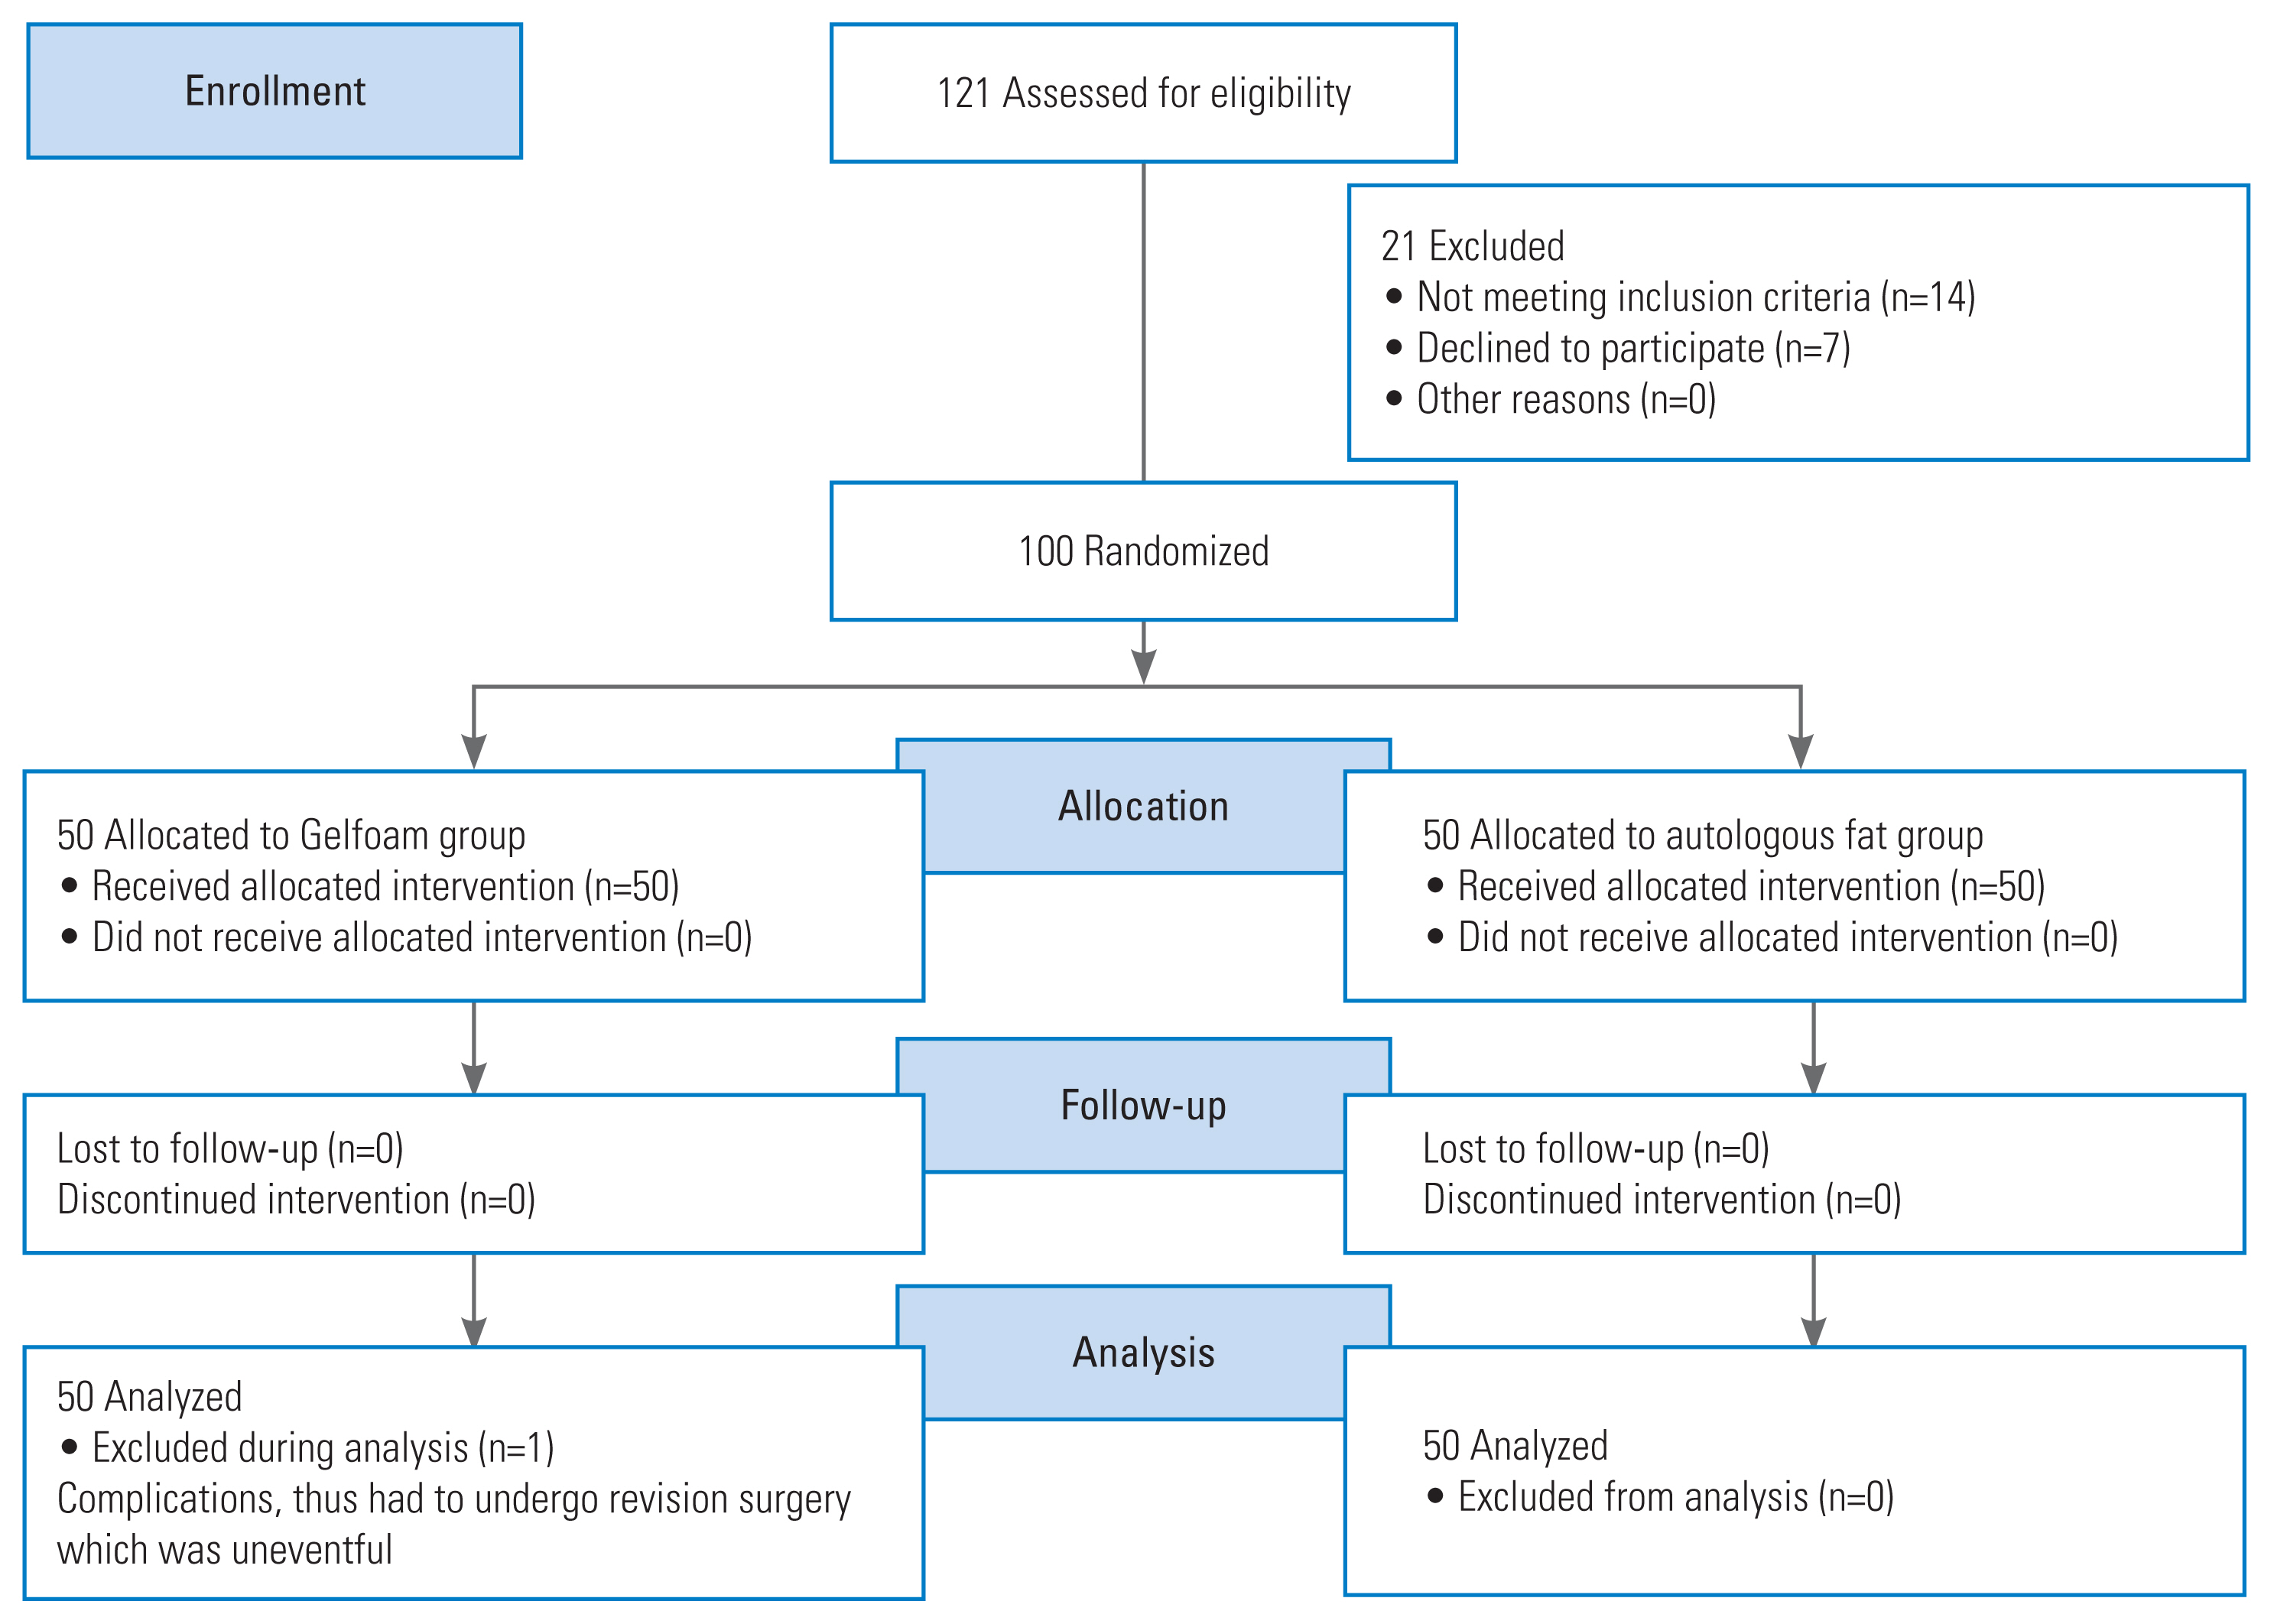
CONSORT (Consolidated Standards of Reporting Trials) 2010 flow diagram.
The inclusion criteria were as follows: (1) age between 20 and 60 years; and (2) single-level PIVD with lack of significant response to conservative treatment, manifesting as persistent or recurrent pain with or without neurological deficit, despite adequate analgesic use, use of anti-inflammatory and muscle relaxant medication, and absolute bed rest for at least 3 months.
The exclusion criteria were as follows: (1) refusal for procedure; (2) multilevel lumbar canal stenosis, symptomatic lumbar canal stenosis, lumbar instability, arachnoiditis or deformity, and severe medical illnesses, including active infection, and other chronic conditions that interfered with clinical or radiological assessments; (3) history of allergy to contrast media, steroids, and local anesthetic agents; (4) previous lumbar spine surgeries; and (5) active cancer, history of substance abuse, current psychiatric comorbidity, pregnancy, diabetes mellitus, and congestive cardiac failure.
Diagnosis was clinically and radiologically confirmed, and posterior decompression and discectomy were performed. Clinical follow-up of patients was conducted at intervals of 6 weeks, 3 months, 6 months, and 12 months; pain and functional outcome were evaluated; and contrast-enhanced magnetic resonance imaging (MRI) was performed between 12 and 18 months. All patients underwent surgery under general anesthesia. Antibiotic prophylaxis with 1.5 g intravenous cefuroxime was administered, and the patient was placed in supine position on the table and then rolled over to prone position. Operative field was cleaned and draped. The level of the surgery was marked under fluoroscopy. Posterior midline incision was made, and posterior decompression was performed for the required level of PIVD. Gelfoam or free autologous fat graft obtained from incision site was placed over the dura mater after laminectomy (Fig. 2). Hemostasis was achieved intraoperatively. The postoperative clinical follow-up was conducted at intervals of 6 weeks, 3 months, 6 months, and 12 months. Clinical assessment was conducted followed by evaluation through Oswestry Low Back Pain Disability Questionnaire (ODI; also known as Oswestry Disability Index), which is considered a “gold standard” tool to measure the patient’s permanent functional disability. For each section (10 sections), the statements were marked 0 to 5. The scores were marked as follows: 0%–20%, minimal disability; 21%–40%, moderate disability; 41%–60%, severe disability; 61%–80%, crippled; and 81%–100%, bed-bound or exaggerating symptoms. It indicates how patients’ back or leg pain is affecting patients’ ability to manage daily life [9]. Clinically assessment for activity-related pain, backache, and radicular pain and Straight Leg Raising Test (SLRT) were performed. In SLRT, the patient is placed in supine position with one leg either straight or flexed at the knee and the other affected leg raised in a straight position, and the test is positive when the raised leg between 30° to 70° causes pain to occur and radiate down the leg to at least below the knee or up to the great toe (sensitivity=91%, specificity=26%). Visual Analog Scale (VAS) is a pain rating scale based on symptoms reported by the patient that is recorded with a mark placed at one point along the length of a 10-cm line from left to right “no pain,” 0 cm, and “worst pain,” 10 cm [10]. Radiological assessment through the modified Ross grading using contrast-enhanced MRI performed between 12 and 18 months of follow-up [11]. Quantification by MRI in a single slice at the level of laminectomy is performed by dividing the spinal canal into four quadrants by drawing perpendicular lines from the center of the dural sac. Quadrants a and b represent anterior epidural spaces to the right and left, respectively, and include the lateral recesses and spinal nerve roots. Quadrants c and d represent the posterior epidural spaces to the right and left, respectively. The posterior border of the evaluation area is demarcated by drawing the line between the most posterior bony remnants. Each quadrant is quantified separately using a scale of 0–4: 0, no/trace EF; 1, 1%–25%; 2, 26%–50%; 3, 51%–75%, and 4, 76%–100% of quadrant affected by EF. Therefore, for each operative level, including two to three imaging slices centered around the intervertebral disc, a minimum of 0 and a maximum of 16 scores can be obtained. According to the modified Ross grading, looking at the complete slice as a whole, each quarter of the quadrants actually represents sixteenth of the slice. Thus, the result, number 1, which in Ross’s model represents 1/4 of the quadrant affected by fibrosis, will correspond to 1/16 or 6.25% of fibrosis per level. Similarly, number 2, which in Ross’s model stands for 2/4 of the quadrant affected by fibrosis, will represent 2/16 or 12.5% of fibrosis per level, and number 3 will represent 3/16 or 18% of fibrosis per level, while number 4 would mean 4/16 or 25% of fibrosis per level. For example, if two slices are obtained, slice 1—a=1, b=2, c=3, and d=4. Therefore, the total is a+b+c+d=10/16=0.625×100=62.5% and slice 2—a=1, b=0, c=0, d=4. Therefore, the total is a+b+c+d=5/16=0.325×100=31.25%. Thus, the total amount of EF is (slice 1+slice 2)/2, i.e., 62.5+31.25/2=46.875 (Fig. 3). The collected data were tabulated, coded, and then analyzed using SPSS software ver. 16.0 (SPSS Inc., Chicago, IL, USA). Continuous variables were presented as mean and standard deviation (unpaired Student t-test), while categorical variables were presented as percent (chi-square test, analysis of variance, and Fisher’s exact test).
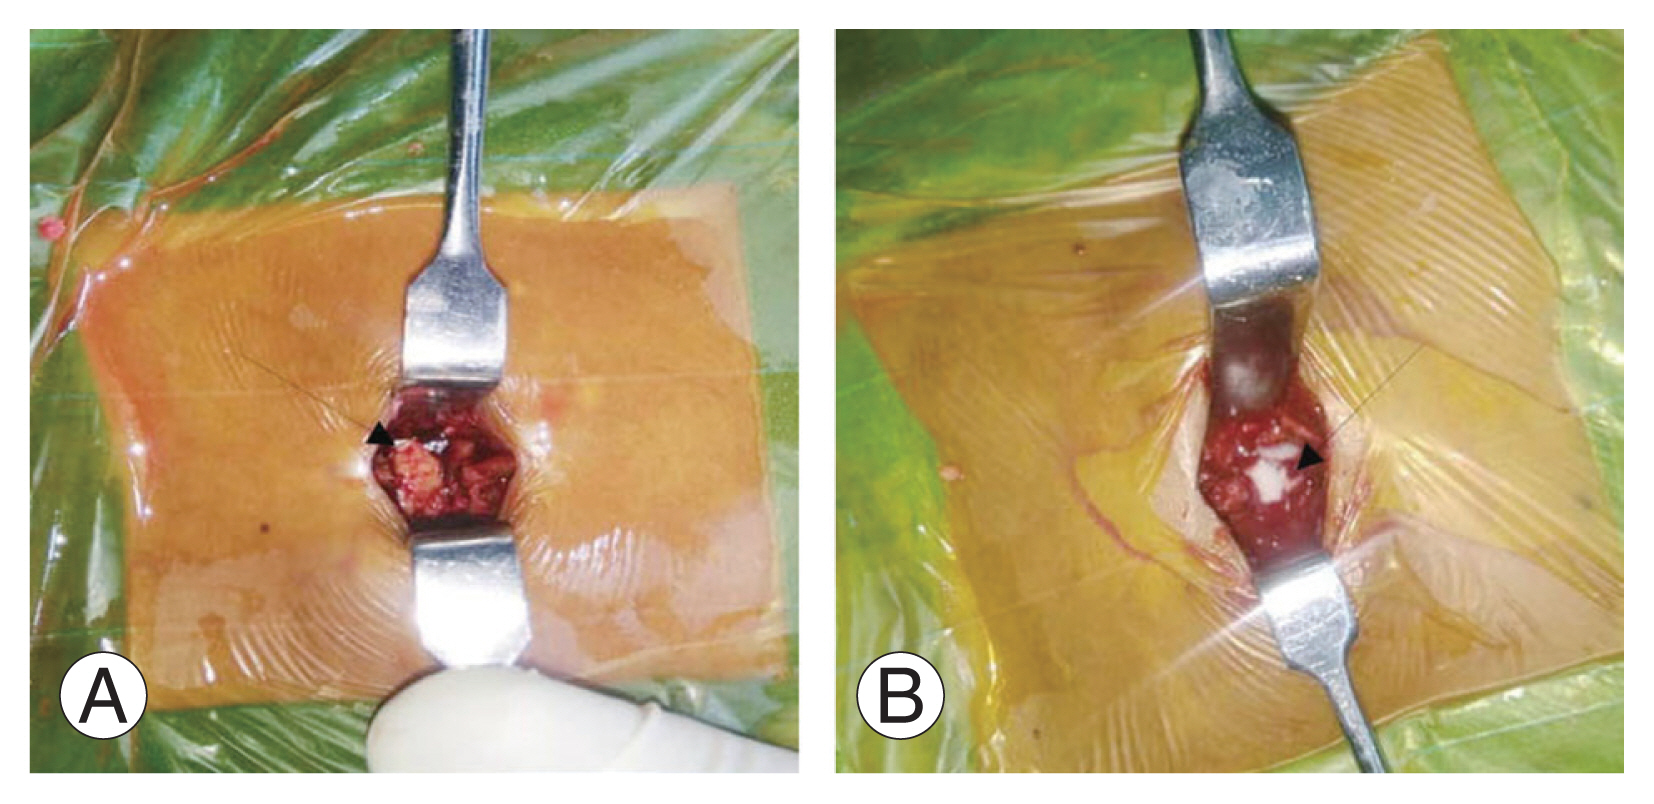
(A) laminectomy placement of autologous fat (arrow) on dura mater post-laminectomy. (B) Intraoperative placement of Gelfoam (arrow) on dura mater post-laminectomy.
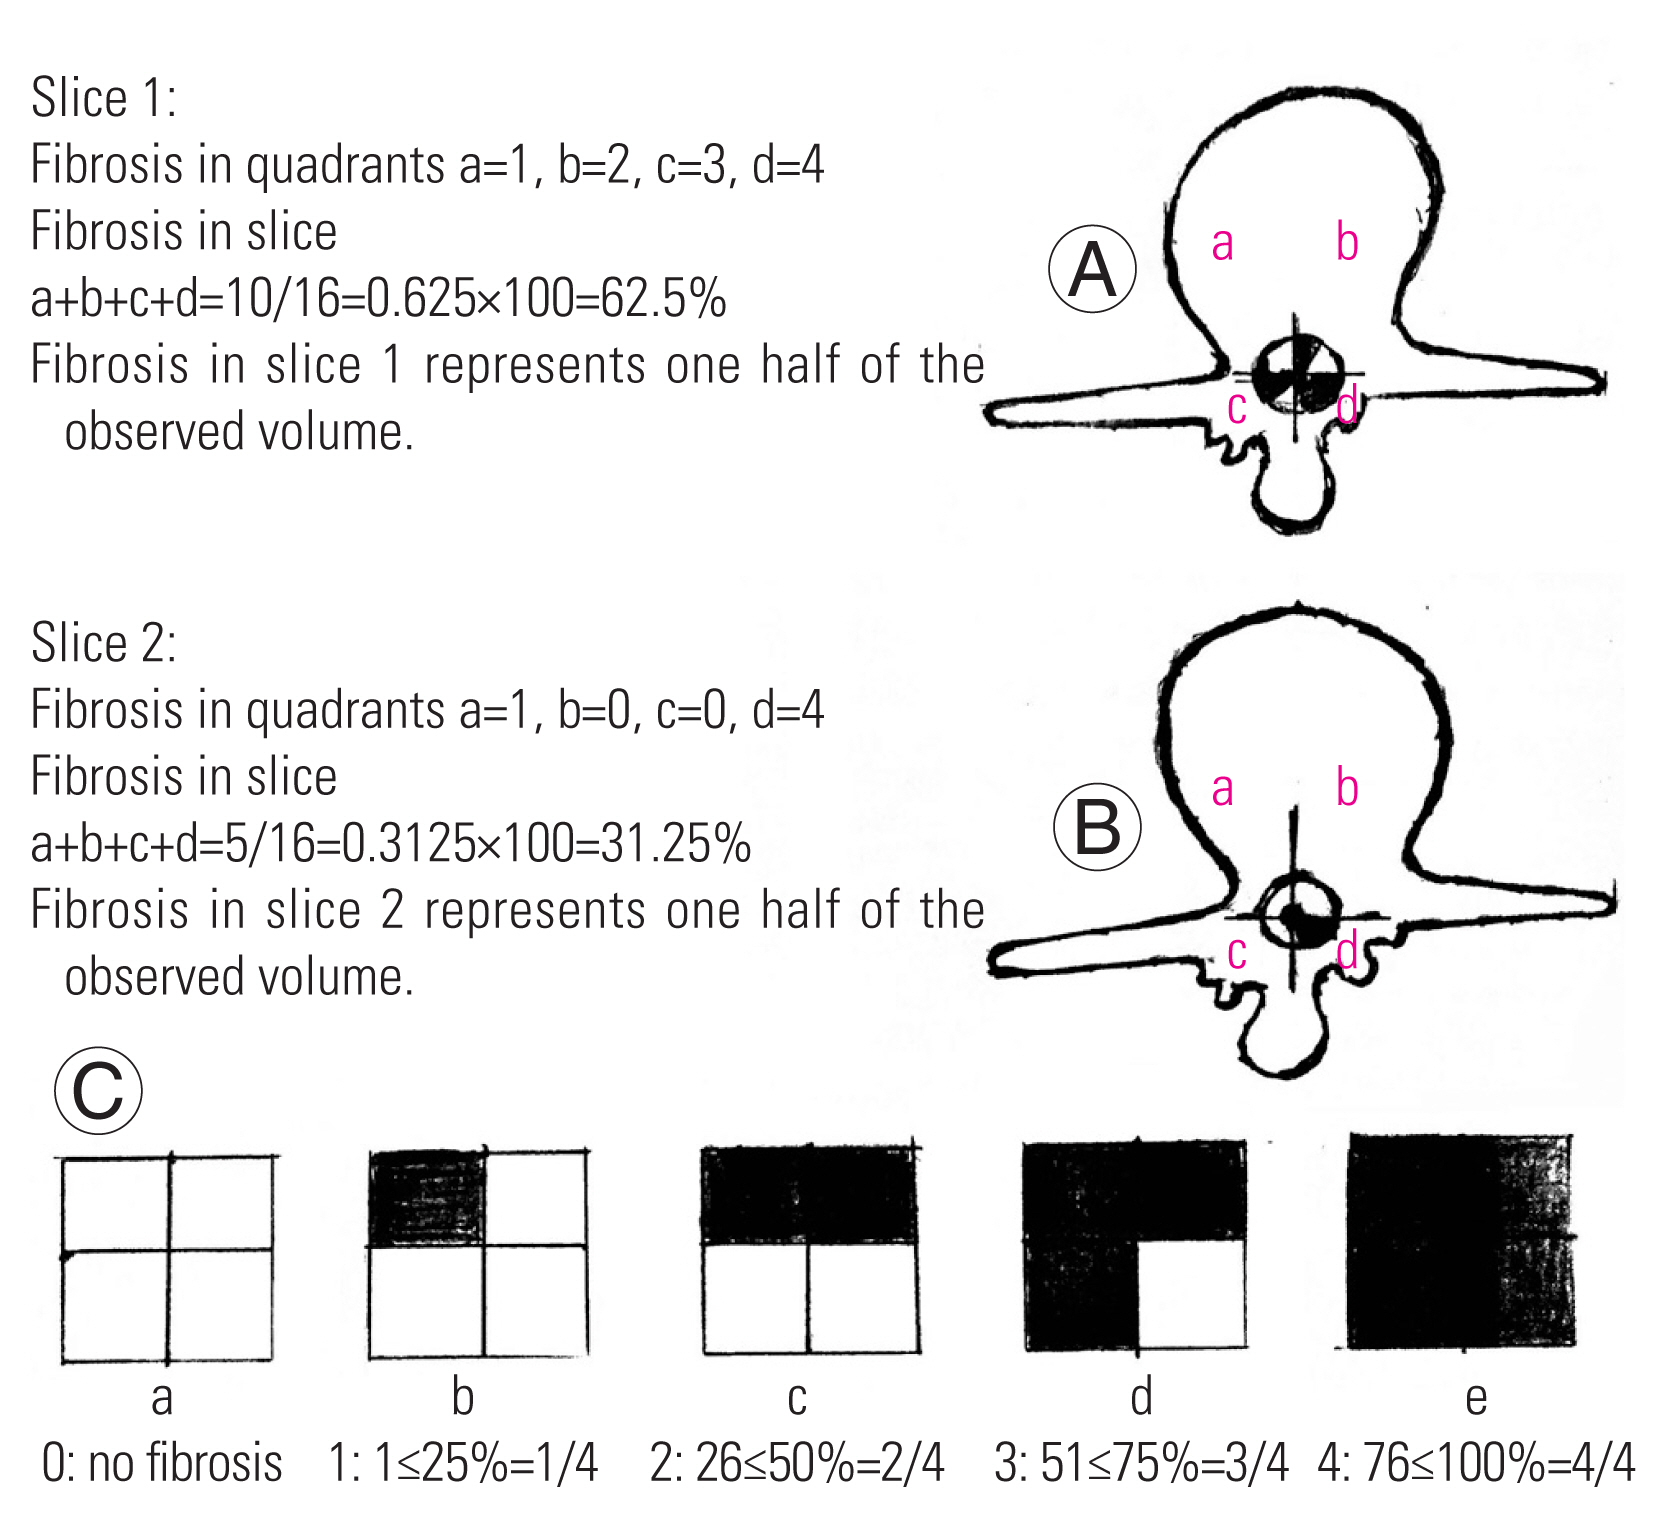
(A, B) Modified Ross grading: (A) slice 1 showing 62.5% (A); slice 2 showing 31.25% of epidural fibrosis (B). (C) Schematic representation of the Ross grading.
Results
The results were compiled and compared statistically in terms of demographic variables, clinical parameters (level of PIVD, ODI score, VAS score, SLRT), and radiological parameters.
1. Demographic variables
In our study on 100 patients, the mean age of patients in autologous adipose tissue group (50 patients) and Gelfoam group (50 patients) were 41.20±8.01 years and 41.60±7.75 years, respectively, which was comparable between the groups at a p-value >0.05. The male-to-female patient ratios were 27:23 in the autologous fat group and 29:21 in the Gelfoam group, and there was no statistically significant difference observed (p>0.05) in each group. The level of PIVD in the autologous fat and Gelfoam groups were mostly L4–L5 and L5–S1, respectively (Table 1).
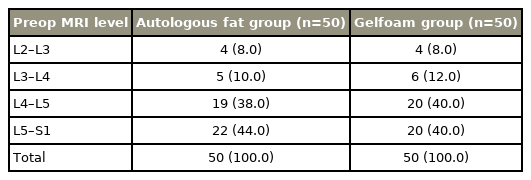
Baseline comparison of both groups according to level of prolapsed intervertebral disc level
2. Clinical assessment
In the present study, based on the mean ODI score, VAS score, and SLRT result, it was observed that both autologous fat and Gelfoam prevented radicular pain and postoperative EF individually. The difference obtained between the preoperative and postoperative follow-up mean values at intervals of 6 weeks, 3 months, 6 months, and 12 months were found to be highly significant at a p-value <0.001 (Table 2).
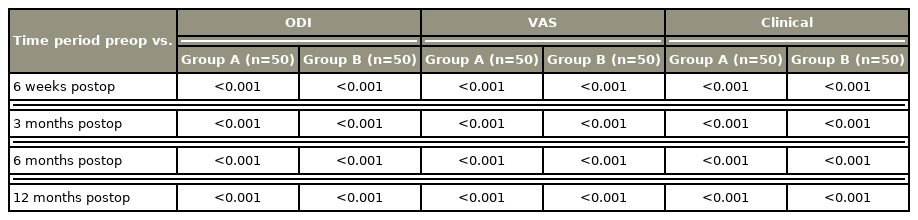
Baseline comparison of ODI score, VAS score, and SLRT preoperatively and postoperatively for group A as well as for group B individually
Based on the statistical analysis, improvement in mean ODI score, VAS score, and SLRT result was statistically significant at intervals of 6 weeks, 3 months, 6 months, and 12 months between the groups. Improvement was greater in the autologous fat group than in the Gelfoam group (p<0.05, which is significant) (Table 3).
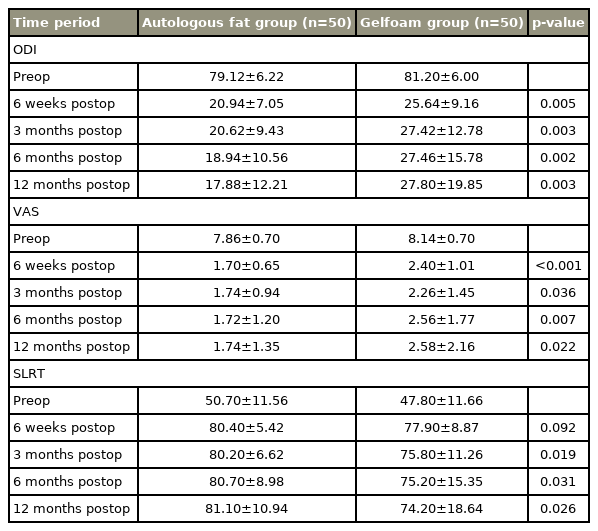
Baseline comparison of both groups according to ODI score, VAS score, and SLRT
According to the radiological assessment, in the present study, on contrast MRI performed between 12 and 18 months, the difference in number of patients who did not develop EF between both groups and in each group individually was statistically significant (Figs. 4, 5).
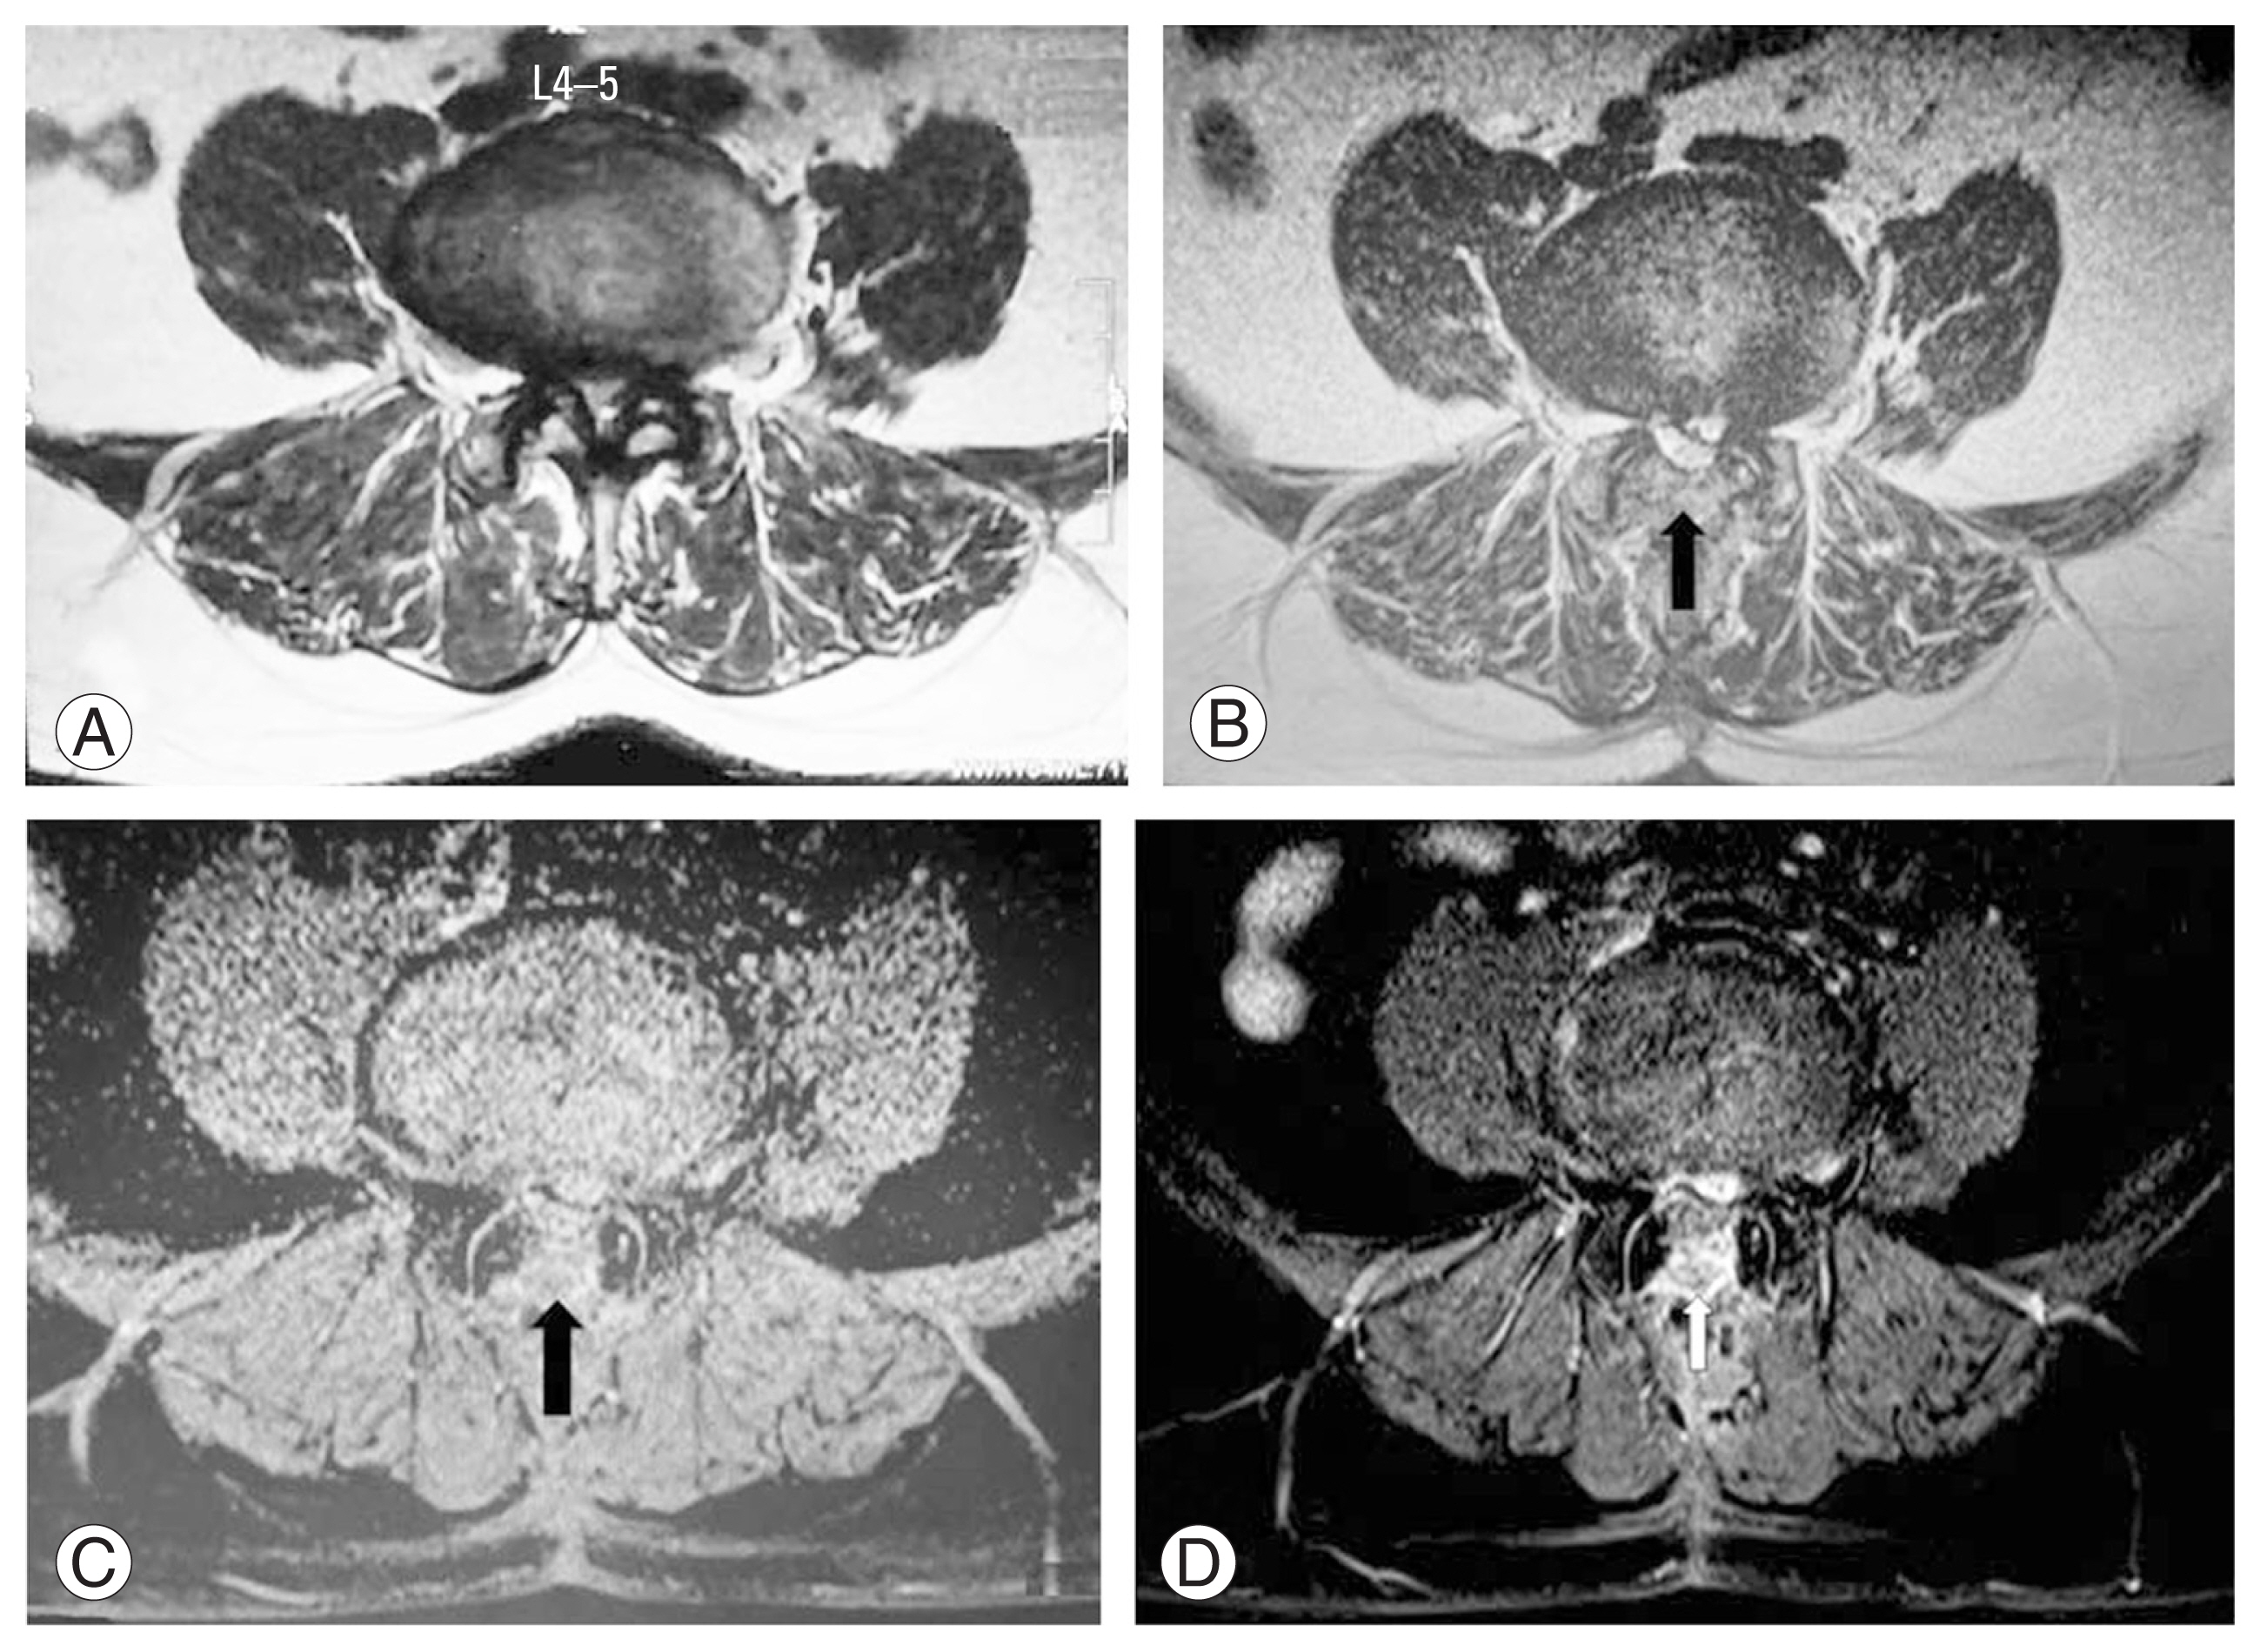
Patient who underwent laminectomy with introduction of autologous fat, showing magnetic resonance imaging (MRI) images preoperative (A), postoperative MRI images T2 weighted (B), short-TI inversion recovery (C), with contrast (D) at the level of laminectomy 1-year follow-up showed no evidence of abnormal signal intensity nor enhancing epidural fibrosis. Notice the autologous fat in the epidural space in place (arrows).

Patient who underwent laminectomy with introduction of Gelfoam, showing magnetic resonance imaging (MRI) images preoperative (A), postoperative MRI images T2 weighted with contrast (B) with contrast at the level of spinolaminectomy 1-year follow-up showed no evidence of abnormal signal intensity nor enhancing epidural fibrosis. Notice the Gelfoam in the epidural space in place (arrow).
It was found that 94% of patients had none to mild (up to grade 1 by Ross grading) EF in the autologous fat group, while 80% of patients had none to mild EF in the Gelfoam group. The number of patients who developed EF were smaller in the autologous fat group than in the Gelfoam group (p<0.05) (Table 4).

Baseline comparison of both groups according to presence of epidural fibrosis based on MRI
One patient who underwent revision surgery developed a complication, that is, infection, within a month and recovered uneventfully after revision surgery.
Discussion
EF is a possible postoperative complication after lumbar spine surgery, in which normal epidural fat is replaced by scar tissue. EF has been implicated as a factor contributing to continuing or recurrent radicular and/or low back pain. The association of EF and pain is controversial.
Recurrent radiculopathy is reported to occur in approximately 40% of patients who have undergone surgical treatment for primary lumbosacral disc herniation. Postoperative fibrosis is a consequence of most surgical procedures and may cause clinically important sequelae due to formation of adhesions between tissues or compression of adjacent anatomic structures by dense fibrotic scar.
Because the removal of peridural and periradicular scar is a complicated task, it is desirable to try to prevent the formation of fibrosis and adhesions in the first place. Different treatments and surgical strategies have been attempted to prevent postoperative fibrosis without providing consistent long-term results. Dense and solid fibrous scar surrounding devices or biological implants used to prevent EF following laminectomy procedures or severe adverse events in relation to their use have been reported.
Thus, the search for a safe and effective device to protect patients with lumbar disc from detrimental peridural fibrosis has long been the subject of considerable research. Approaches including using the minimally invasive technique, drugs, and biomaterial and non-biomaterial barriers to prevent postoperative epidural adhesion were intensively investigated. Lexer [12] was the first to report the use of free fat grafts for prevention of scar formation. Our study also demonstrated that both Gelfoam and autologous fat are capable of preventing postoperative EF with significant improvement in clinical parameters in regular follow-up in both groups also. Our results are also supported by previous studies. Petrie and Ross [13] evaluated the use of ADCON-L (anti-adhesion barrier gel; Gliatech, Cleveland, OH, USA) to inhibit peridural fibrosis and reduce fibrosis-related symptoms after lumbar discectomy and demonstrated that ADCON-L was safe and effective for not only inhibiting postoperative peridural fibrosis but, importantly, improving patient outcome by reducing the incidence of activity-related pain. Further, this study demonstrated for the first time that there was a relationship between peridural scar and postoperative clinical sequelae, i.e., recurrent radicular pain [13]. Porchet et al. [14] compared 20 patients who underwent reoperation for recurrent radiculopathy after lumbosacral discectomy and were treated with ADCON-L to inhibit EF following secondary surgery. Outcomes after reoperation were assessed at intervals of 6 and 12 months using VAS. He concluded that the long-term clinical results showed a significant improvement in all clinical parameters [14].
Another study conducted by Mohi Eldin et al. [15] on a group of 290 patients with symptomatic unilateral or bilateral, single-level lumbar disc herniation clearly demonstrated that the use of suction drainage alone or combined with only fat grafts, fats grafts and local steroid application, or only local steroids application significantly improved patient outcome with respect to pain relief and functional outcome. However, in the present study, we did not use any suction drain and steroids along with fat to prevent EF; therefore, our study further emphasized the precise role of autologous fat in the prevention of EF.
In the present study, we have found that the improvement and prevention of EF was greater in the autologous fat group than in the Gelfoam group. There is paucity of data in the whole literature showing this comparison as there is only one study conducted by Sobti et al. [16] on a smaller scale of 30 patients and a shorter follow-up of 6 months. Our findings in the present study for VAS score and SLRT correlate with the study conducted by Sobti et al. [16] on 30 patients previously unoperated with symptoms and radiological features of lumbar spinal canal stenosis. Fifteen patients were assigned to group A (free fat group) and 15 patients to group B (Gelfoam group). Postoperatively, pain relief at 3 and 6 months in both groups was found to be statistically insignificant, although relief of pain was greater in group A than in group B. Moreover, the study by Sobti et al. [16] observed that improvement in SLRT was not statistically significant at 3 and 6 months between both groups, but improvement was greater in group A. Based on contrast-enhanced MRI, Sobti et al. [16] inferred that use of free fat graft was more effective than Gelfoam in reducing EF. In comparison, our study has a much larger sample size of 100 patients with a longer follow-up of 12 to 18 months and includes more variables (ODI score, VAS score, SLRT, and contrast-enhanced MRI grading) to compare the autologous fat group and Gelfoam group in preventing postoperative EF, thus making our study more authentic.
However, there are a few studies in the literature that contradict our results; for example, Dobran et al. [17] conducted their study on patients and evaluated that the use of peridural free fat grafts following lumbar microdiscectomy did not change the clinical outcome. Magnetic resonance images indicated free autologous fat grafts did not prevent postoperative scar formation. Thus, this study results do not correlate with those of the present study. Another study was conducted by Jensen et al. [18] on 99 patients with the use of free fat transplantation for operation for lumbar disc herniation. There was no difference observed between two groups regarding the individual parameters (e.g., low back pain, leg pain, disability, and physical impairment). There was no difference in the clinical outcome between the two groups [18]. From the abovementioned discussion, we can conclude that literature is divided on the use of these barrier methods. Thus, further studies should be conducted to explore the role of these barrier methods to prevent postoperative EF.
In most studies in the literature, there were no complications observed postoperatively with use of barriers (biomaterials and non-biomaterials). In our study, complication was observed in only one patient in the Gelfoam group who underwent revision surgery as the patient developed infection within a month and recovered eventually after revision surgery, which is insignificant for the study results. This was also observed in the previously conducted study by Sobti et al. [16], in which two patients developed wound infection but both patients were diabetic and were assigned in the Gelfoam group.
The limitation of the study was the short follow-up duration, that is, 12 to 18 months; longer follow-up period should be conducted. Second, there is no control group for comparison, which would have further emphasized the effectiveness of use of barriers to prevent EF.
Conclusions
The use of autologous fat grafts compared with Gelfoam application significantly improved patients’ outcome with respect to short- and long-term pain relief clinically based on ODI score, VAS score, and SLRT and radiologically based on grading done for EF using contrast MRI. Thus, it was observed that there is a clear relationship between radiating pain and EF. Furthermore, it was observed that both the autologous fat group and Gelfoam group prevent radicular pain and postoperative EF individually, but autologous fat was found to be more effective than Gelfoam in the prevention of radicular pain and hence EF.
Notes
Conflict of interest
No potential conflict of interest relevant to this article was reported.
Author Contributions
Study concept and design: KR, JS, RB; analysis and interpretation of data: KR, JS, RB, RS, KK; drafting of the manuscript: KR, JS; critical revision of the manuscript for important intellectual content: JS, RB, KB, KK; manuscript editing: KR, JS, KB; and guarantor: KR.
Acknowledgements
I wish thank my Institute Guru Gobind Singh Medical College and Hospital, Faridkot for providing this opportunity to conduct this exercise, and also wish to thank all my seniors for their valuable inputs during the study. I also wish to thank all the support staff for their help in doing MRI and all other required investigations.