Preoperative Less Right Shoulder Elevation Had a Higher Risk of Postoperative Shoulder Imbalance When Main Thoracic Curve Shows Higher Correction Regardless of the Upper Instrumented Vertebra Level for Patients with Adolescent Idiopathic Scoliosis Lenke Type 1
Article information
Abstract
Study Design
This is a retrospective study.
Purpose
This study aimed to investigate the incidence of and risk factors for postoperative shoulder imbalance (PSI) in patients with Lenke type 1.
Overview of Literature
PSI is a complication resulting in poor self-image and satisfaction in adolescent idiopathic scoliosis (AIS) patients.
Methods
We examined the data of AIS patients with Lenke type 1 curves who underwent posterior fusion surgery in a retrospective manner. PSI was defined as a 2-year postoperative absolute radiographic shoulder height (RSH) of ≥2 cm. Patients were divided into two groups based on the presence of PSI and the level of their upper instrumented vertebra (UIV) (UIV at T2 or T3 [U-UIV] or UIV below T3 [L-UIV]). The radiographic parameters and clinical outcomes were compared, and the cutoff values of risk factors were identified by multivariate analysis.
Results
Of 104 patients, 21 (20.2%) had left shoulder elevation PSI. The PSI group had a significantly greater preoperative RSH (−5.1 mm vs. −14.3 mm) and main thoracic (MT) curve correction rate (77.3% vs. 69.1%) than the non-PSI group. The PSI incidence did not differ between the U-UIV and L-UIV groups. Multivariate analysis identified preoperative RSH and the MT curve correction rate as independent risk factors for PSI. The receiver operating characteristic curve analysis identified the preoperative RSH cutoff value as −6.5 mm and MT curve correction rate cutoff value as 76.9%.
Conclusions
Even in AIS patients with Lenke type 1 curves, the incidence of PSI was relatively high (20.2%). Patients with preoperative lower right shoulder elevation (i.e., RSH >−6.5 mm) had a higher risk of PSI regardless of UIV level when the MT curve showed a higher correction rate (i.e., correction rate >76.9%).
Introduction
Surgery is used for treating patients with adolescent idiopathic scoliosis (AIS) to maintain overall alignment, correct the spinal deformity, and prevent further progression. Postoperative shoulder imbalance (PSI) is a significant complication that occurs following surgical correction, especially in AIS patients with Lenke type 1 and 2 curves; it can affect the patient’s appearance and satisfaction [1]. Lee et al. [2] reported that patients with PSI had significantly lower scores on the revised 22-item Scoliosis Research Society Questionnaire (SRS-22r) in the self-image, mental, satisfaction, and total average domains than those with balanced shoulders.
Recent segmental instrumentation systems and correction maneuvers have enabled significant improvement in three-dimensional correction. However, PSI remains prevalent, and it is reported in up to 25% of patients with AIS [3]. PSI commonly occurs in patients with double thoracic curve deformity (Lenke type 2). However, a systematic review reported that the incidence of PSI was up to 20% in AIS patients with Lenke type 1 curve having a nonstructural proximal thoracic (PT) curve [3]. Several risk factors of PSI have been reported, including PT curve stiffness, positive T1 tilt, preoperative shoulder imbalance, upper instrumented vertebra (UIV) selection, PT correction rate, and main thoracic (MT) curve hypercorrection [1,3–16]. Most of these studies primarily focused on Lenke type 2 curves or on combination of types 1 and 2. Thus, available data regarding Lenke type 1 curve are limited. There is general consensus on Lenke type 2 treatment: shoulder balance should be adjusted by including the PT curve in a fusion range and setting UIV to T1 or T2 [9,11,12,16–18]. In contrast, in Lenke type 1, the nonstructural PT curve is usually excluded from the fusion range because spontaneous PT curve correction occurs after MT curve correction [19].
Therefore, understanding of the risk factors of shoulder imbalance and proper selection of UIV in Lenke type 1 curve are crucial. To the best of our knowledge, only a few studies have determined a clear cutoff value for each risk factor by including proper UIV selection to prevent PSI. This study aimed to clarify the PSI incidence and risk factors and develop a surgical strategy for preventing PSI in AIS patients with Lenke type 1 curve.
Materials and Methods
1. Patient enrollment
This retrospective study was conducted following the Declaration of Helsinki and approved by the institutional review board of our institution (IRB no., 18–226). The requirement for informed consent from individual patients was omitted because of the retrospective design of this study. Eligible AIS patients with Lenke type 1 curves—defined as a major MT curve with nonstructural PT curves (Cobb angle <25° on side bending film) [20]—who underwent posterior spinal fusion surgery between March 2011 and August 2019 at our department and had a minimum postoperative follow-up period of 2 years were included in this study. Patients with congenital scoliosis, syndromic scoliosis, or anterior or revision surgery were excluded from the study.
2. Surgical intervention
All surgeries were performed by board-certified spine surgeons at Hamamatsu University School of Medicine. For determining the UIV, the PT curve magnitude and shoulder elevation were considered. When patients had right shoulder elevation, one level cranial to end vertebra (EV) (EV+1) was usually selected as the UIV. If the patient had a relatively large PT curve or left shoulder elevation, we extended fusion to T2 or T3. Patients were mainly treated using pedicle screw constructs, expect when a narrow pedicle was confirmed on preoperative computed tomography images. Sublaminar wiring using high-molecular-weight polyethylene cable (Nespron cable system; Alfresa Pharma Co., Osaka, Japan) was performed at the level that skipped pedicle screw. Rod rotation and translation on the concave side were used as correction maneuvers. Compression and distraction forces were applied around the UIV level to adjust shoulder balance followed by confirming whole spine radiographs intraoperatively.
3. Radiographic assessment and clinical outcome
The demographic and radiological data were reviewed retrospectively. Standing whole spine anteroposterior scans that were obtained before the surgery, immediately after the surgery, and at 2 years after the surgery were used to determine the radiological parameters. The Risser sign and Cobb angle of the PT, MT, and thoracolumbar/lumbar (TL/L) curves; flexibility of each curve (as determined by the lateral bending radiographs) (Fig. 1); UIV and T1 tilt; radiographic shoulder height (RSH); cervical axis; and coronal balance (CB) measurements were obtained. The UIV tilt, T1 tilt, and RSH were found to be positive when they were measured in left-side-up position. The CB was measured as the horizontal distance between the C7 plumb line and the center sacral vertical line, and it was considered to be positive when the C7 plumb line was located on the right side of the central sacral vertical line.
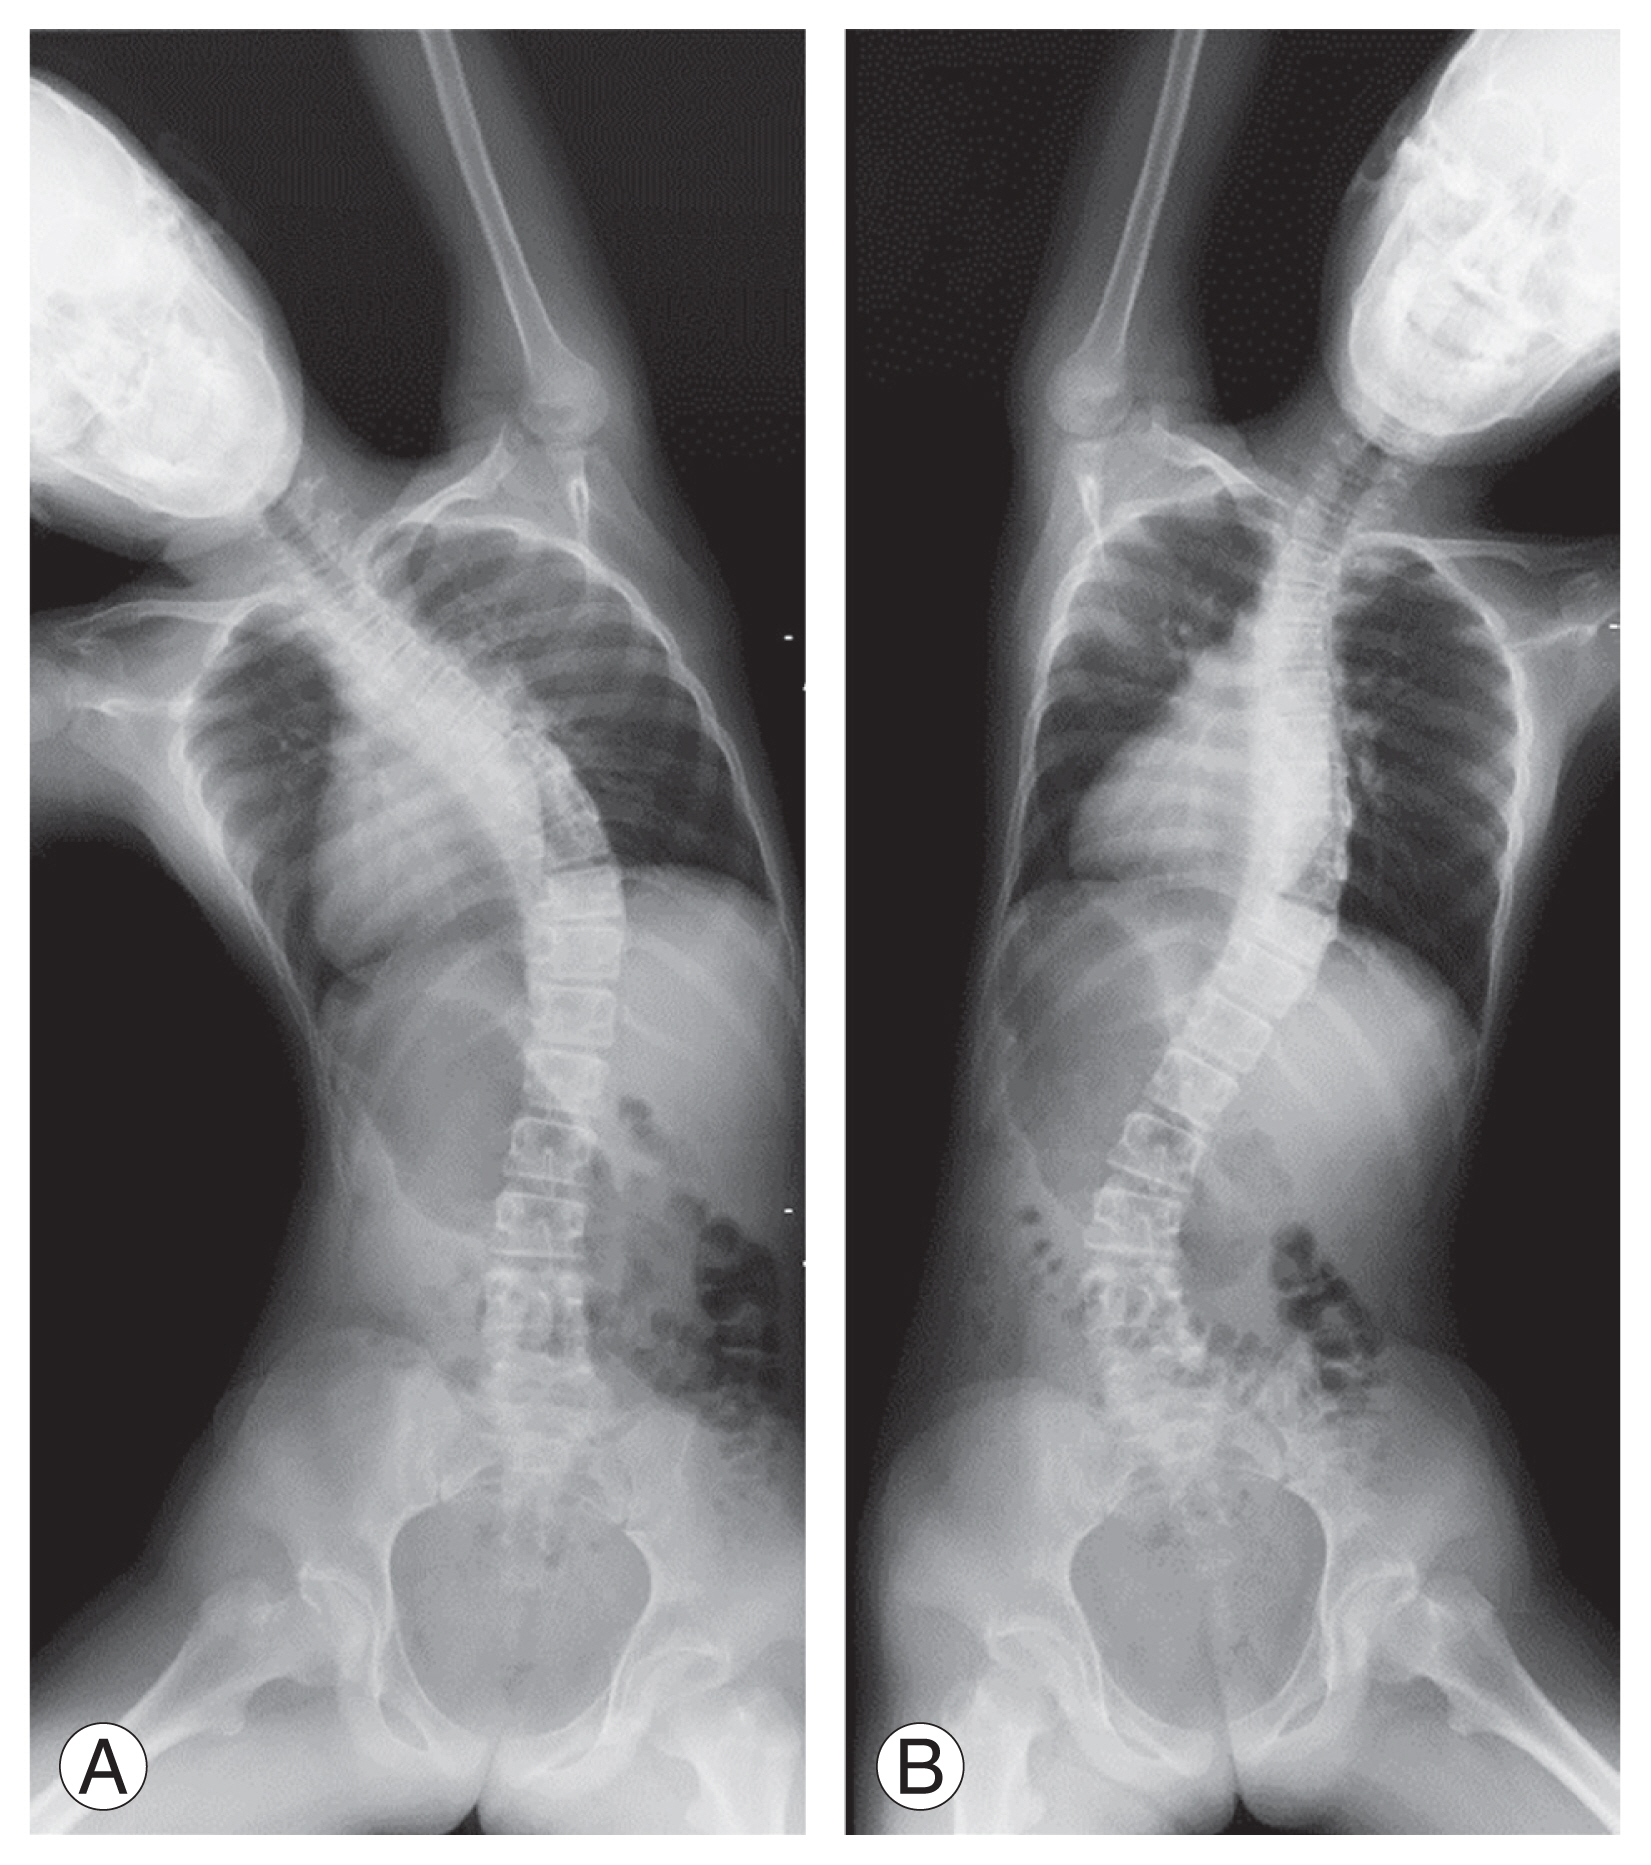
(A, B) Side bending radiographs were obtained by bending the spine maximally to the right and left in the supine position while maintaining the head and neck in neutral rotation.
For sagittal parameters, thoracic kyphosis (T5–T12 kyphosis) and lumbar lordosis (L1–S1 lordosis) were determined using whole spine lateral standing radiographs, and they were evaluated by three spine surgeons. The SRS-22r was administered to assess clinical outcomes before the surgery and at 2 years after the surgery.
4. Statistical analyses
PSI was defined as a postoperative absolute RSH value of ≥2 cm at 2 years after the surgery [1]. Patients with PSI were classified into PSI (RSH ≥2 cm) and non-PSI (RSH <2 cm) groups as well as U-UIV (UIV at T2 or T3) and L-UIV (UIV below T3) groups based on the UIV level. For univariate logistic regression analysis, demographic and radiographic parameters were compared between these groups using the Student t-test, Mann-Whitney U test, chi-square test, and Fisher’s exact test. A subsequent logistic regression analysis with stepwise model selection was conducted to determine the risk factors of PSI. The sensitivity, specificity, and receiver operating characteristic (ROC) curves were measured to identify valuable indices for predicting PSI. All statistical analyses were performed using IBM SPSS ver. 23.0 (IBM Corp., Armonk, NY, USA). A p-value of <0.05 was considered statistically significant.
Results
In total, 104 AIS patients with Lenke type 1 curve (including 99 women and five men) were included in this study. At the time of operation, the mean age and Risser grade were 15.8±2.8 years (range, 11–24 years) and 3.8±0.9 (range, 1–5), respectively. Regarding the lumbar modifier, 56 patients had type A modifier, 20 had type B, and 28 had type C. The UIVs were found to be T2, T3, T4, T5, and T6 in eight, 17, 42, 33, and four patients, respectively.
PSI was found in 21 patients (20.2%) at 2 years after the surgery, and all patients with PSI presented with left shoulder elevation. The PSI group had significantly greater preoperative RSH (−5.1 mm versus −14.3 mm) than the non-PSI group; however, there were no differences in the magnitude and flexibility of each curve between the two groups (Table 1). Postoperatively, the magnitude and correction rate of the MT curve (77.3% versus 69.1%), UIV tilt (−2.4° versus −4.8°), and RSH (22.5 mm versus 11.5 mm)were significantly higher in the PSI group than in the non-PSI group; however, there were no differences in PT correction rate between the two groups (Table 1). Moreover, patients with PSI had significantly higher UIV tilt, T1 tilt, RSH, cervical axis, and CB at 2 years after the surgery than before the surgery (Table 1). Compared with before surgery, the sagittal parameters (Table 1) and SRS-22r scores in any domain (Table 2) remained unchanged at 2 years after the surgery.

Demographic characteristics and radiographic parameters of PSI and non-PSI groups

SRS-22r scores of the PSI and non-PSI groups
Overall, 25 and 79 patients were classified as having U-UIV and L-UIV, respectively. Preoperatively, the U-UIV group had a significantly greater PT curve, smaller TL/L curve, higher T1 tilt, and higher cervical axis than the L-UIV group (Table 3). However, the PT and MT curve correction rates and radiographic parameters at 2 years after the surgery did not differ between the two groups (Table 3). Moreover, the PSI incidence did not differ between the two groups (Table 3).
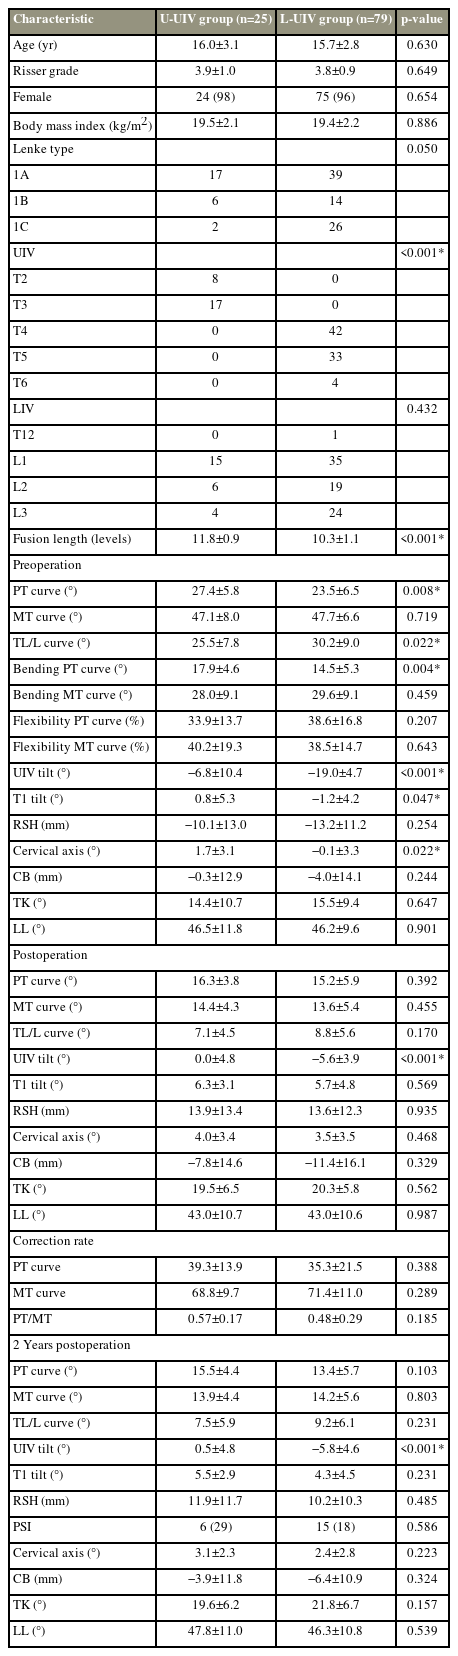
Demographic characteristics and radiographic parameters of U-UIV and L-UIV groups
Multivariate analysis identified preoperative RSH (odds ratio [OR], 1.098; 95% confidence interval [CI], 1.035–1.165; p=0.002) and the MT curve correction rate (OR, 1.092; 95% CI, 1.033–1.153; p=0.002) as independent risk factors of PSI. The ROC analysis determined cutoff value for preoperative RSH was −6.5 mm, with a sensitivity and specificity of 71% and 77%, respectively. The area under the ROC curve (AUC) was 0.731 (95% CI, 0.598–0.865; p=0.001). The cutoff value for MT curve correction was 76.9%, with a sensitivity and specificity of 67% and 80%, respectively (AUC, 0.732; 95% CI, 0.623–0.842; p=0.001) (Fig. 2). Overall, 11 of 17 patients (65%) with preoperative RSH of >−6.5 mm and MT curve correction rate of >76.9% experienced PSI, whereas only two of 53 patients (3.8%) without both the risk factors experienced PSI (Figs. 3, 4).
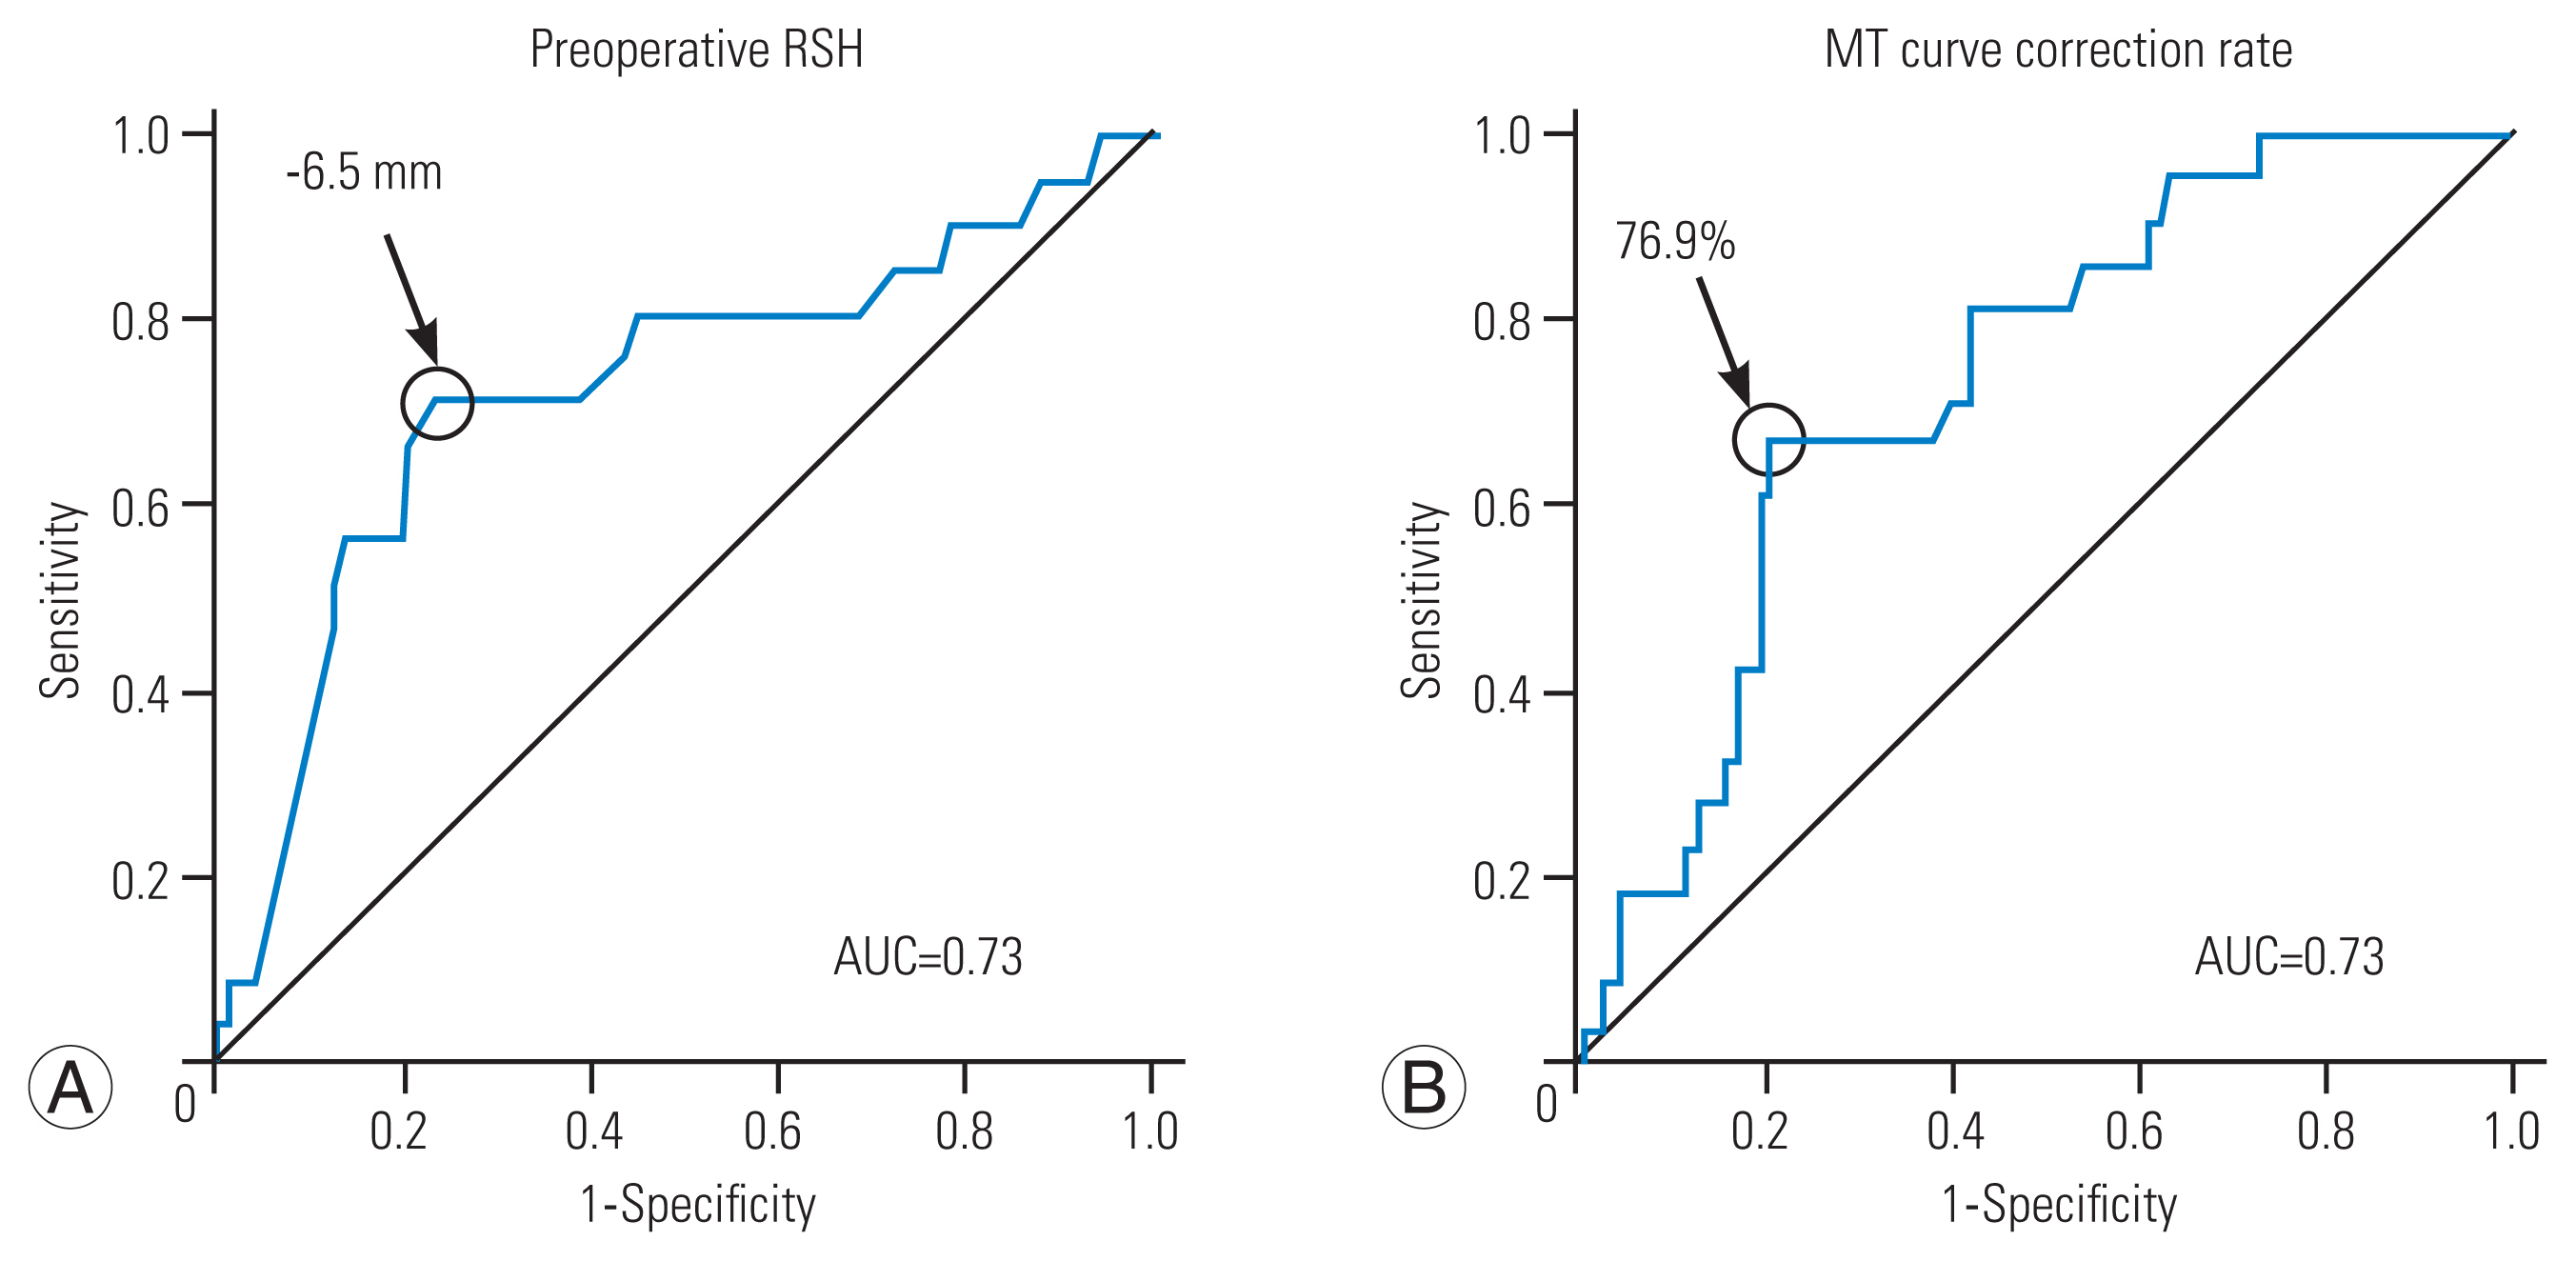
Receiver operating characteristic curves of the preoperative radiographic shoulder height (RSH) (A) and the main thoracic (MT) curve correction rate (B) for postoperative shoulder imbalance 2 years after the operation. AUC, area under the receiver operating characteristic curve.
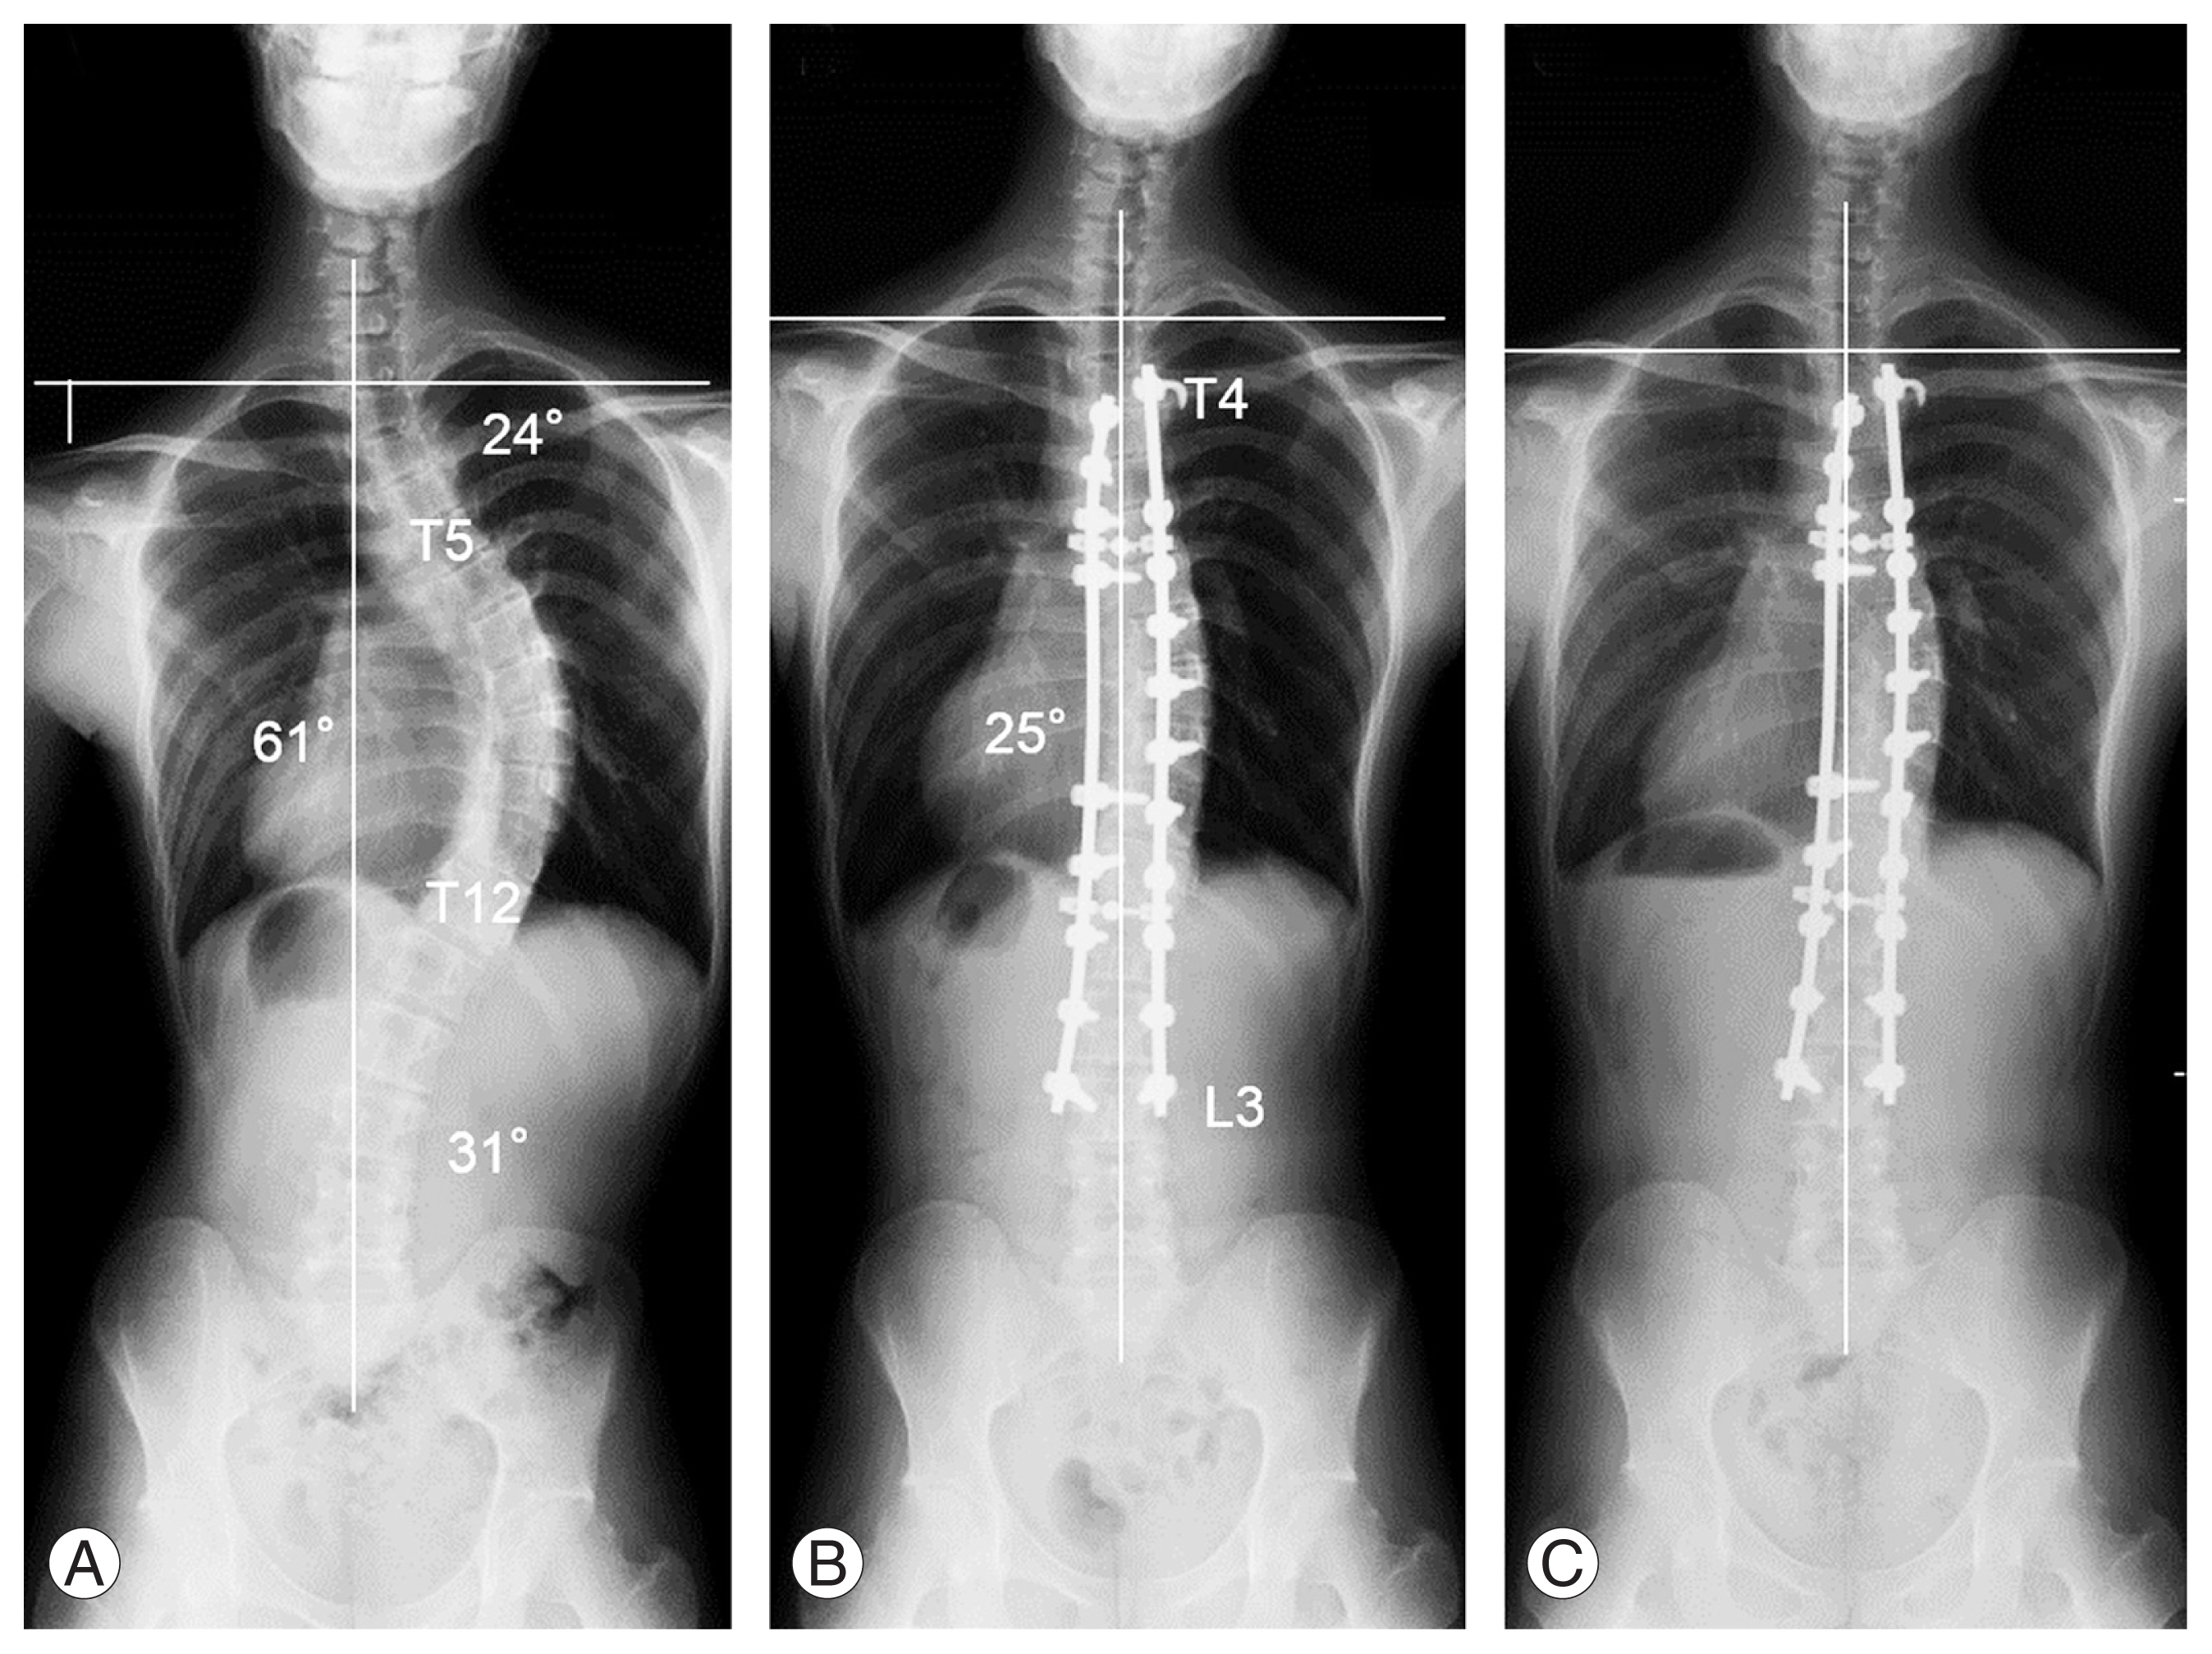
A 17-year-old male with type 1A curve. (A) Preoperative standing whole spine radiograph. (B) Standing whole spine radiographs just after operation. (C) Standing whole spine radiographs at 2 years after operation. The preoperative Cobb angles of the proximal thoracic (PT) curve, main thoracic (MT) curve, and thoracolumbar/lumbar (TL/L) curve were 24° (T1–5) and 61° (T5–T12), and 31° (T12–L4), respectively. Preoperative right shoulder elevation was observed (radiographic shoulder height [RSH]=−32 mm) (A). T4–L3 fusion was performed. The MT curve was corrected to 25° (correction rate=59%) (B). No postoperative shoulder imbalance was observed (RSH=6 mm) (C).
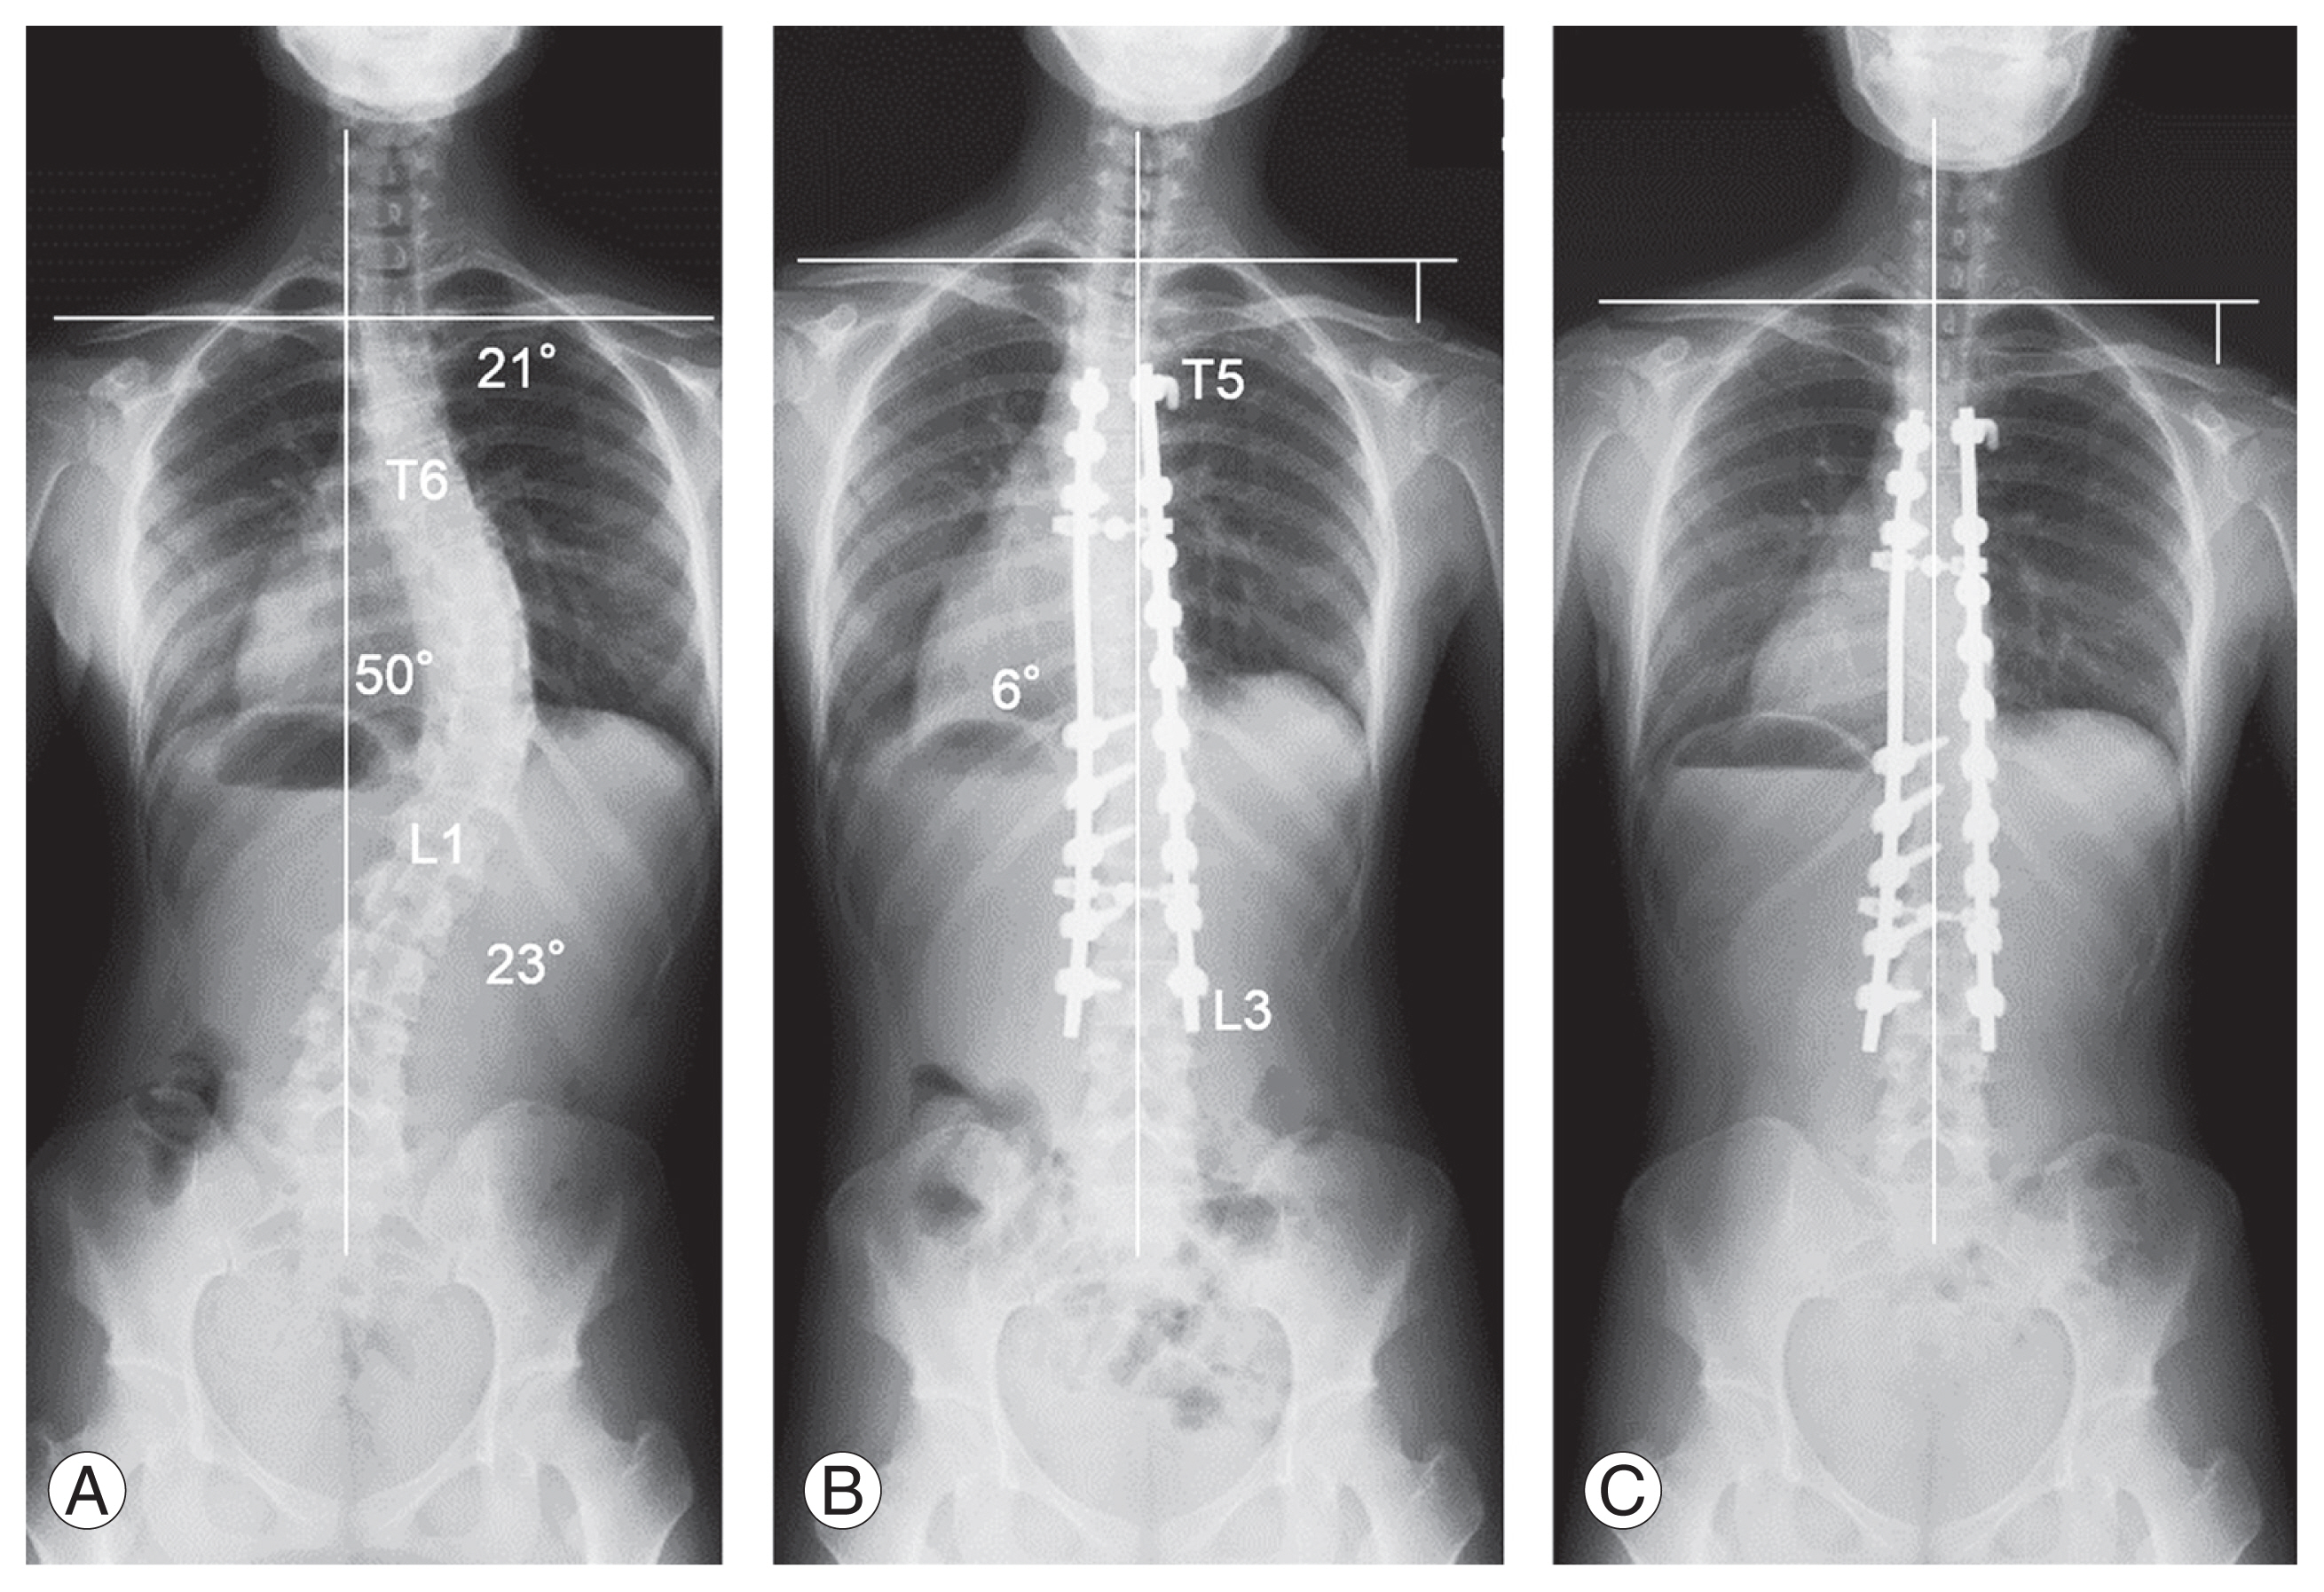
A 16-year-old female with type 1A curve. (A) Preoperative standing whole spine radiograph. (B) Standing whole spine radiographs just after operation. (C) Standing whole spine radiographs at 2 years after operation. The preoperative Cobb angles of the proximal thoracic (PT) curve, main thoracic (MT) curve, and thoracolumbar/lumbar (TL/L) curve were 21° (T1–6) and 50° (T6–L2), and 23° (L2–L5), respectively. No preoperative shoulder imbalance was observed (radiographic shoulder height [RSH]=0 mm) (A). T5–L3 fusion was performed. The MT curve was corrected to 6° (correction rate=88%) (B). Postoperative shoulder imbalance was observed (RSH=29 mm) (C).
Discussion
For patients with AIS, clinical appearance after the surgery is a major concern, and poor self-image and low satisfaction are associated with the severity of deformities [21,22]. PSI is recognized as an important complication after corrective fusion surgery, and it can result in poor cosmetic outcomes; moreover, in some cases, it requires reoperation [1]. The most common type of scoliosis is a Lenke type 1 curve, which is characterized by a structural MT curve with a nonstructural PT curve. Hence, spine surgeons are experienced in treating this type of surgical correction. Shoulder imbalances can be spontaneously resolved intra- and post-operatively, owing to the PT curve flexibility, which might contribute to the low PSI incidence. However, the reported frequency of PSI in Lenke type 1 curve was not low. Zhang et al. [3] reported that the incidence of PSI in Lenke 1, 2, 5, and mixed types were 20% (9%–31%), 26% (15%–37%), 31% (17%–45%), and 27% (19%–35%), respectively. Based on a report by Smyrnis et al. [1], suggesting that the postoperative shoulder asymmetry of ≥2 cm was a potential cause of dissatisfaction, we defined PSI as a postoperative shoulder elevation of ≥2 cm in the left or right shoulder. We demonstrated that, in patients with AIS Lenke type 1 curve, the incidence of PSI was 20.2% at 2 years after the surgery; this finding is consistent with previous studies.
We found that preoperative RSH could be a risk factor of PSI in AIS patients with Lenke type 1 curve. According to several studies, preoperative shoulder balance influences postoperative shoulder balance [4,6]. Hong et al. [4] examined 89 AIS patients with six curvature types, and they reported that patients with a smaller preoperative shoulder imbalance were more likely to have greater postoperative shoulder imbalances. PSI may also occur in AIS patients with Lenke type 2 curve, which is characterized by preoperative positive RSH (left shoulder elevation) and a structural PT curve, followed by scoliosis correction. In contrast, in Lenke type 1 cases—characterized by preoperative negative RSH (right shoulder elevation) and a nonstructural PT curve—the postoperative RSH changes and PSI risks remain unclear. However, patients with lower right shoulder elevation (i.e., preoperative RSH >–6.5 mm) were found to have a potential PSI risk, even those with Lenke type 1 curve.
In this study, MT curve correction rate was another factor influencing PSI. Regarding Lenke type 2, Suk et al. [15] reported that hypercorrecting the MT curve was a risk factor of shoulder balance impairment. Moreover, several studies have suggested that a smaller correction of the PT curve and higher correction of the MT curve are associated with PSI, thereby emphasizing the importance of the relationship between PT and MT curve correction [3,10,23]. In contrast, Gotfryd et al. [24] reported no correlation between postoperative shoulder balance and the amount of PT and MT curve correction for Lenke type 1. In patients with Lenke type 1A curve, the nonstructural PT curve could spontaneously improve postoperatively along with MT curve correction [19,25]. A study indicated that postoperative spontaneous PT curve correction was related to preoperative bending PT curves [19]. However, predicting the behavior of postoperative nonfused PT curves remains difficult. Therefore, in this study, only MT curve correction was found to be a potential factor related to PSI. Similar to the findings of our study, Matsumoto et al. [26] demonstrated that the postoperative clavicle angle correlated with the preoperative clavicle angle and MT curve correction rate in patients Lenke type 1Acurve. However, they did not determine the cutoff values for each PSI risk factor. Our results suggest that patients with preoperative lower right shoulder elevation (i.e., preoperative RSH >−6.5 mm) have a risk of PSI when the MT curve shows a higher correction rate (i.e., a correction rate >76.9%). Recently, segmental instrumentation systems coupled with posterior column osteotomy techniques have allowed surgeons to achieve considerable scoliosis correction. However, as reported in the present study, high MT curve correction can easily lead to shoulder asymmetry with PT curve compensation failure.
In this study, the UIV levels did not affect the PSI incidence. Similar to the findings of our study, Amir et al. [8] demonstrated that the UIV level does not guarantee postoperative lateral shoulder balance. However, in cases of Lenke type 2 curves, double curve fusion and setting the UIV to T1 or T2 for achieving sufficient PT curve correction were recommended to avoid PSI, especially in patients with preoperative left shoulder elevation [12,15]. In contrast, the nonstructural PT curve is usually excluded from the fusion area because it spontaneously corrects with MT curve correction consistently [19]. Thus, in cases of Lenke type 1 curve, the selection of the most suitable UIV for preventing PSI remains controversial. Elfiky et al. [25] suggested considering fusion into the PT curve only when the PT Cobb angle was >45° because postoperative spontaneous PT curve correction is expected in such cases. Based on our findings regarding to Lenke type 1 curves, we recommend under-correcting the MT curve (76.9% correction rate) in patients with lower right shoulder elevation (i.e., RSH >−6.5 mm) rather than extending the UIV level to prevent PSI. We found no correlation between the SRS-22r scores and PSI. Most patients achieved sufficient scoliosis correction and satisfactory clinical outcomes. Therefore, PSI might not considerably affect patient satisfaction.
This study has some limitations. This was a retrospective study, and the UIV selection tended to extend UIV to T2 or T3 in cases with relatively large PT curves and a positive T1 tilt. These preoperative selection biases might have affected the incidence of PSI. A comparative study investigating the incidence of PSI based on the UIV level using similar baseline characteristics and deformities is required. However, the present study suggests that when the PT curve is included in the fusion area, it should be carefully corrected to optimize shoulder balance, especially when larger MT curve corrections are performed.
Conclusions
The incidence of PSI was relatively high (20.2%), even in patients with AIS Lenke type 1 curve. Patients with preoperative lower right shoulder elevation (preoperative RSH >−6.5 mm) had a higher risk of PSI when the MT curve was well corrected (correction rate >76.9%), regardless of the UIV level.
Acknowledgments
The authors would like to thank Ms. Nao Kuwahara, Ms. Tomoe Mabuchi, and Mr. Taku Nagao and Mr. Tomokazu Suzuki, secretaries of the Department of Orthopedic Surgery, for their excellence in technical assistance during data collection. We would like to thank Editage (www.editage.jp) for English language editing.
Notes
Conflict of Interest
No potential conflict of interest relevant to this article was reported. YY and SO belong to the division as follows: Donated Fund Laboratory (Division of Geriatric Musculoskeletal Health, Hamamatsu University School of Medicine, Shizuoka, Japan); Meitoku Medical Institute Jyuzen Memorial Hospital, Shizuoka, Japan; Japan Medical Dynamic Marketing Inc., Tokyo, Japan; and Medtronic Sofamor Danek Inc., Memphis, USA.
Author Contributions
Conception or design of the work: Tomohiro Banno, Yu Yamato, Tomohiko Hasegawa, Go Yoshida, Hideyuki Arima, Shin Oe, Yuki Mihara, Koichiro Ide, Yuh Watanabe, Kenta Kurosu, Keiichi Nakai, and Yukihiro Matsuyama; acquisition of data for the work: Tomohiro Banno, Yu Yamato, and Shin Oe; analysis of data for the work: Tomohiro Banno; interpretation of data for the work: Tomohiro Banno, and Yu Yamato; drafting the work or revising it critically for important intellectual content: all authors; final approval of the version to be published: all authors; and agreement to be accountable for all aspects of the work in ensuring that questions related to the accuracy or integrity of any part of the work are appropriately investigated and resolved: all authors.