Deformity Correction with Interbody Fusion Using Lateral versus Posterior Approach in Adult Degenerative Scoliosis: A Systematic Review and Observational Meta-analysis
Article information

Abstract
This study was designed to systematically review and meta-analyze the functional and radiological outcomes between lateral and posterior approaches in adult degenerative scoliosis (ADS). Both lateral (lumbar, extreme, and oblique) and posterior interbody fusion (posterior lumbar and transforaminal) are used for deformity correction in patients with ADS with unclear comparison in this cohort of patients in the existing literature. A literature search using three electronic databases was performed to identify studies that reported outcomes of lateral (group L) and posterior interbody fusion (group P) in patients with ADS with curves of 10°–40°. Group P was further subdivided into minimally invasive surgery (MIS-P) and open posterior (Op-P) subgroups. Data on functional, radiological, and operative outcomes, length of hospital stay (LOHS), fusion rates, and complications were extracted and meta-analyzed using the random-effects model. A total of 18 studies (732 patients) met the inclusion criteria. No significant difference was found in functional and radiological outcomes between the two groups on data pooling. Total operative time in the MIS-P subgroup was less than that of group L (233.86 minutes vs. 401 minutes, p<0.05). The total blood loss in group L was less than that in the Op-P subgroup(477 mL vs. 1,325.6 mL, p<0.05). Group L had significantly less LOHS than the Op-P subgroup (4.15 days vs. 13.5 days, p<0.05). No significant difference was seen in fusion rates, but complications were seen except for transient sensorimotor weakness (group L: 24.3%, group P: 5.6%; p<0.05). Complications, such as postoperative thigh pain (7.7%), visceral injuries (2%), and retrograde ejaculation (3.7%), were seen only in group L while adjacent segment degeneration was seen only in group P (8.6%). Lateral approach has an advantage in blood loss and LOHS over the Op-P subgroup. The MIS-P subgroup has less operative time than group L, but with comparable blood loss and LOHS. No significant difference was found in functional, radiological, fusion rates, pseudoarthrosis, and complications, except for transient sensorimotor deficits. Few complications were approach-specific in each group.
Introduction
Adult degenerative scoliosis (ADS) or de novo scoliosis is a spinal coronal deviation of over 10° and is prevalent in the elderly population [1]. The prevalence of ADS is estimated from 13% in <60 years of age to 36% in >60 years of age [2]. Patients present with a spectrum of neurological symptoms, including back pain, neurogenic claudication, radiculopathy, and generalized imbalance. Surgery is warranted when conservative treatment fails in providing relief to patients. The surgery mainly aimed for adequate decompression, stabilization, and restoration of both spinal coronal and sagittal alignment [3]. Interbody fusions have become increasingly popular due to their ability to restore the disc and foraminal height, thereby achieving indirect decompression, good fusion, lordosis restoration, and deformity correction [4]. Interbody fusion with a traditional posterior approach, such as posterior lumbar interbody fusion (PLIF) and transforaminal lumbar interbody fusion (TLIF), has been proven successful in ADS; however, iatrogenic muscle trauma, nerve root injury, and dural tear are few posterior approach complications [4,5].
Lateral lumbar interbody fusion (LLIF), extreme lateral interbody fusion (XLIF), and oblique lateral interbody fusion (OLIF) are new techniques performed from the lateral approach, which works on the principle of indirect decompression by increasing the foraminal height. The lateral approach is gaining popularity because of minimal trauma to muscles, large surface area for fusion, large size cages, and fusion segment saving [4]. However, the potential risk of damage to the psoas muscle, lumbosacral plexus, bowel injury, vascular injury, changing the position to prone for instrumentation, and difficult access to L5–S1 disc space need to be considered before selecting the lateral approach [4,6]. Still, no definite evidence is available regarding the superiority of one approach over another in patients with ADS in the existing literature. The authors aim to systematically review and analyze the existing literature regarding the safety and efficacy of interbody fusion from posterior and lateral approaches in ADS.
Materials and Methods
1. Literature search strategy
The Preferred Reporting Items for Systematic Reviews and Meta-Analyses (PRISMA) guidelines were used to conduct this systematic review [7]. An electronic literature search using PubMed, EMBASE, and Scopus databases was independently performed by two authors (S.M. and P.V.S.), from their dates of inception to May 20, 2021. The search aimed to identify the studies about the outcomes after deformity correction with interbody fusion performed from posterior or lateral approaches in patients with ADS. Both medical subject headings (MeSH) and non-MeSH/free text words for PICO (patient, intervention, comparator, and outcomes) framework were combined using the Boolean operators “AND” and “OR” to maximize the search sensitivity (Supplement 1). The search strategy was created by the first author (S.M.) and critically reviewed by all authors, and any discrepancies were resolved after discussion [8]. The references of all relevant studies were manually checked to include any additional studies. Duplicates were removed using Zotero citation manager software (https://www.zotero.org/) [9]. After a screening of titles and abstracts, full-text articles of potentially relevant studies were included.
2. Study selection criteria
The following are the inclusion criteria for the studies: (1) full-text articles published in English; (2) randomized controlled trials (RCT) or observational or cross-sectional study design; (3) adult cohort of >40 years of age, either sex, with primary or de novo ADS; (4) minimum of 10 patients; (5) mild to moderate curves with mean coronal Cobb’s of 10°–40°; (6) surgical procedure involving interbody fusion with lateral approach (LLIF, XLIF, and OLIF) or posterior approach (PLIF and TLIF); (7) open or minimally invasive surgery (MIS); (8) clinical outcome reported as Visual Analog Scale (VAS) or Oswestry Disability Index (ODI); and (9) minimum follow-up duration of 12 months.
The following are the exclusion criteria: (1) non-English articles, without full-text; (2) case reports, review articles, systematic reviews, experimental studies, biomechanical studies, and conference abstracts; (3) patients with age of <40 years; (4) idiopathic, secondary adult, and syndromic or iatrogenic scoliosis; (5) heterogeneous cohort of patients operated for degenerative disc disease or spondylolisthesis alone without any deformity; (6) severe curves requiring osteotomy or circumferential fusion; (7) surgical procedure involving decompression alone or interbody fusion with anterior approach (anterior lumbar interbody fusion, ALIF) as a primary procedure; and (8) clinical outcomes reported other than VAS and ODI.
3. Quality assessment
Critical appraisal of the selected studies was independently performed by two reviewers (S.M. and P.V.S.) using the National Institutes of Health (NIH) quality assessment tool that uses 12 objective criteria regarding study objectives, selection criteria, eligibility, representativeness of study participants, sample size, intervention, outcome measures, blinding, statistical analysis, outcome assessment, lost to follow-up, and group level assessment [10]. Criteria are rated as good, fair, or poor. We gave a maximum of 1 point for each criterion (0: poor, 0.5: fair, 1: good) with a total maximum NIH score of 12. Studies with >50% NIH scores were considered of good quality and were included in the quantitative analysis.
4. Data extraction
All data were extracted using text, tables, figures, and any supplementary material. Two authors (S.M. and P.V.S.) independently extracted the data from the selected articles, and any discrepancies were resolved after discussion with the senior authors (P.K. and B.S.). Data of each surgical procedure was separately extracted in the case of studies comparing the difference between two surgical procedures. Studies were divided into two groups as follows: group L (lateral approach, including LLIF/XLIF/OLIF) and group P (posterior approach, including PLIF and TLIF). Group P was further divided into two subgroups, the open posterior (Op-P) and MIS-posterior subgroups (MIS-P). The baseline characteristics included the first author’s name, country, year of publication, study design, sample size, gender, inclusion criteria, type of surgery, and duration of follow-up. The primary outcome included functional outcome reported as a change in VAS or ODI or both. Secondary outcome measures included the following: (1) radiographic outcomes, such as changes in Cobb’s angle, lumbar lordosis (LL), and sagittal vertical axis (SVA); (2) operative time and blood loss; (3) fusion rate; (4) length of hospital stay (LOHS); and (5) complications.
5. Statistical analysis
All statistical analyses were performed using Metafor package in R statistical software ver. 4.0.0 (The R Foundation for Statistical Computing, Vienna, Austria; 2020) [11]. Descriptive characteristics of pooled data were expressed as mean and standard deviation (SD) for continuous data and as percentages and proportions for categorical data. Forest plots were used to show the comparison between the groups. DerSimonian and Laird’s random-effects model was used when heterogeneity was high, otherwise fixed-effects model was used. The Higgins I2 test was used to assess the heterogeneity among the studies [12]. Standardized mean difference (SMD), 95% confidence intervals (CI), and probability values were used for the comparison of continuous data. Relative risk and 95% CI were used to analyze categorical or binary data. All p-values of <0.05 and no overlap within 95% CI was considered a statistically significant difference. Funnels plots were used to assess the publication bias by visual inspection of plots and Egger’s regression test [13].
Results
1. Study selection
The literature search used PubMed, Google Scholar, and Scopus and identified 288 articles. From selected articles, 158 additional records were identified [14–16]. A total of 182 articles were left after removing duplicates. Following initial screening of titles and abstracts, only 63 full-text articles in English were considered potentially eligible. After excluding 45 articles due to inadequate sample size (n=3), inadequate follow-up (n=3), review articles/case reports (n=10), outcome measures other than VAS/ODI (n=11), missing data like SD values (n=5), a heterogeneous cohort of patients (n=8), severe curves (n=2), and osteotomy/ALIF as a primary procedure (n=3), only 18 articles met the inclusion criteria and were included in quantitative analysis [17–34]. Fig. 1 shows the flow diagram of the study as per PRISMA protocol.
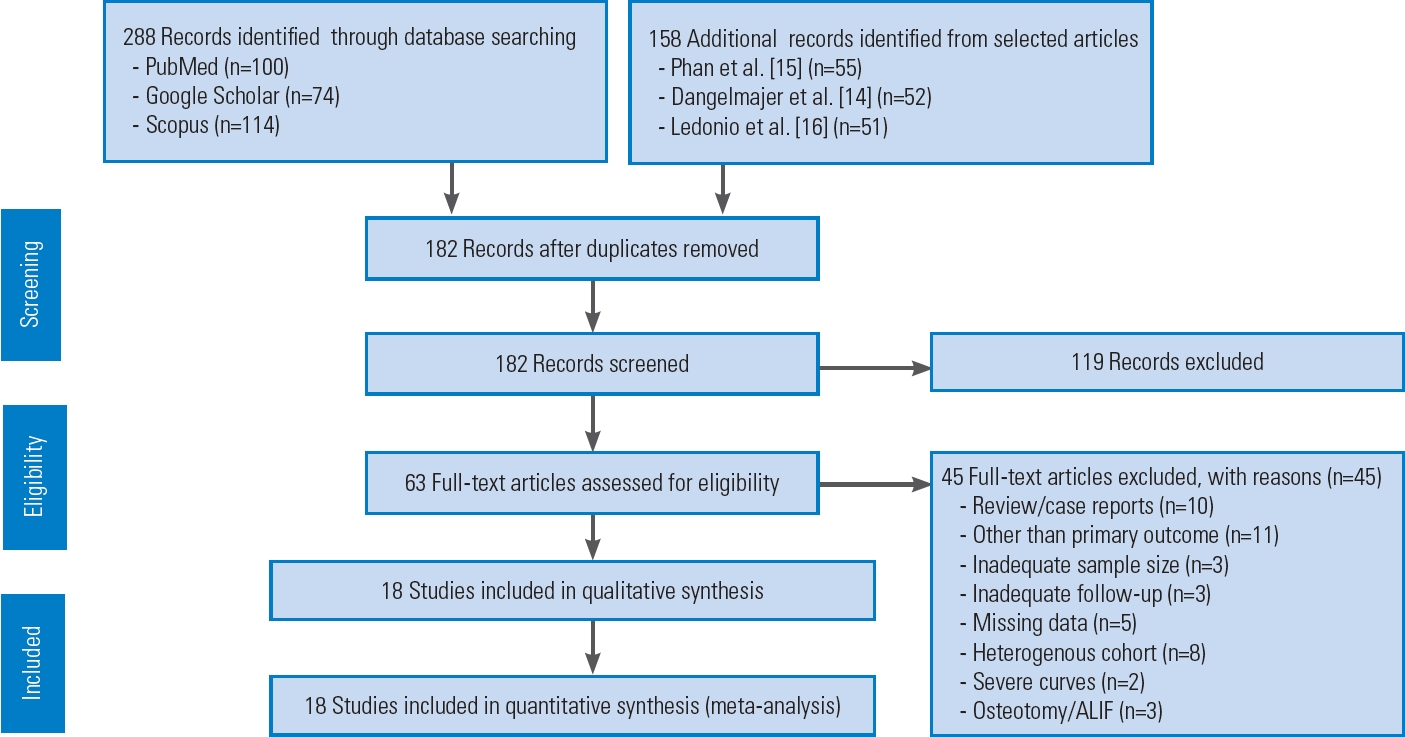
Flow diagram of the study as per PRISMA (Preferred Reporting Items for Systematic Reviews and Meta-Analyses) protocol. ALIF, anterior lumbar interbody fusion.
2. Study characteristics (Table 1)
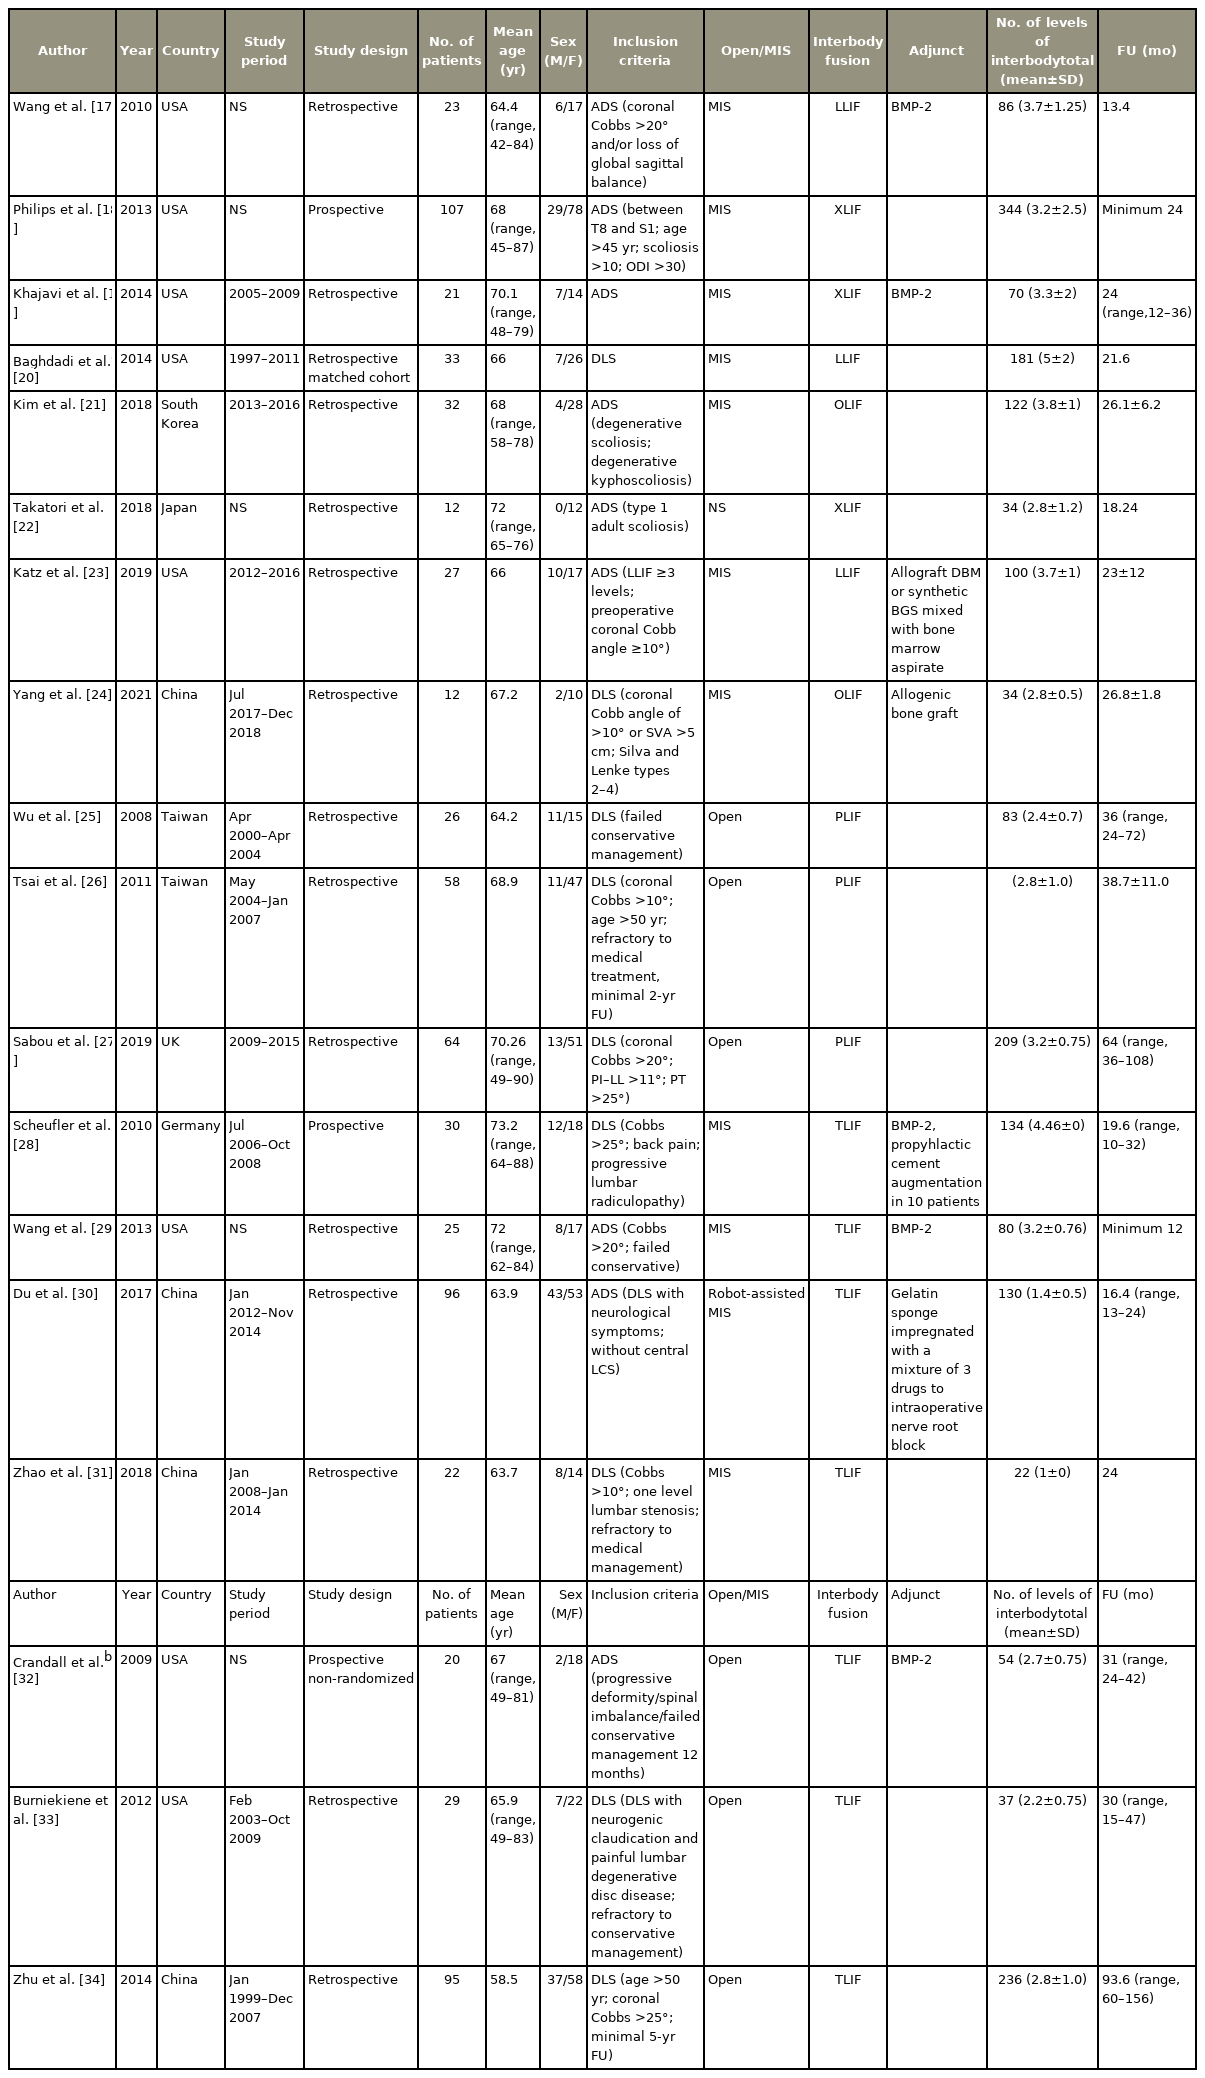
Study characteristics
A total of 18 studies (732 patients) were included in the quantitative analysis. Most of the studies were retrospective (n=15) while only three were prospective [18,28,32]. The mean age of the patients was 67.2±3.53 years. Out of the 732 patients, 515 were females while 217 were males. Follow-up period ranged from 12 to 156 months with a mean of 30.2 months. Out of 18 studies, eight belonged to group L (267 patients) and 10 belonged to group P (465 patients). In group L, interbody procedures included LLIF/XLIF in six studies and OLIF in two studies. In group P, four studies were MIS-TLIF while six were open posterior surgeries (O-TLIF and O-PLIF, three studies each). On NIH quality assessment, all studies were found of good quality with a mean score of 10.27, ranging from 9 to 11.5 (Supplement 2).
3. Functional outcomes (Table 2)
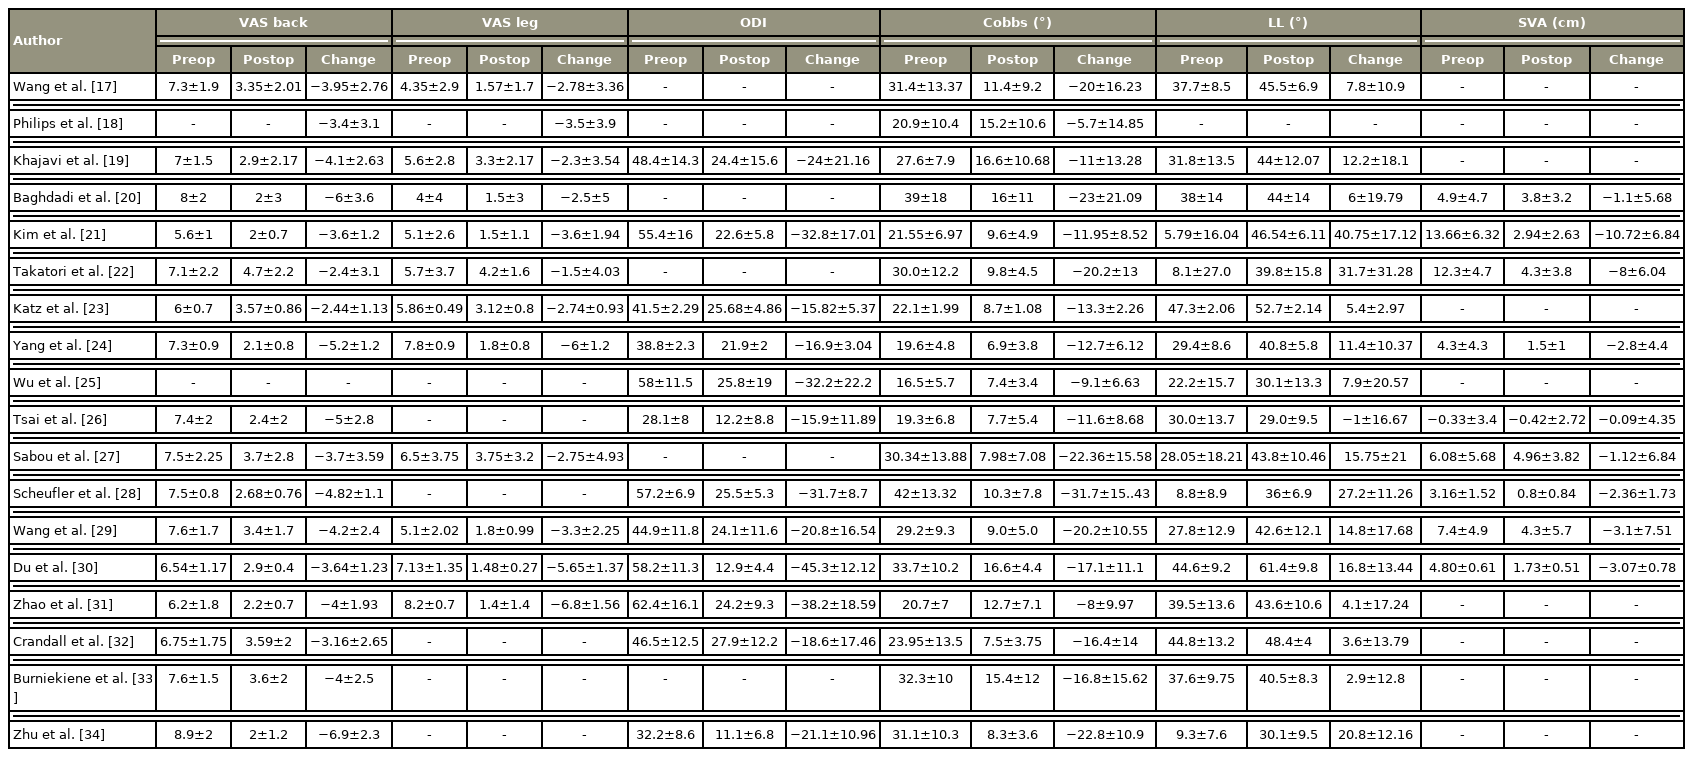
Clinical and radiographic outcomes
1) Visual Analog Scale back (Fig. 2)

Forest plot showing Visual Analog Scale (VAS) back (subgroup 1: group L, subgroup 2: group P). CI, confidence interval.
A total of 17 studies reported the pre- and post-intervention VAS scores for back pain. Eight and nine studies showed an SMD of −3.88 (95% CI, −4.67 to −3.09; I2=89.53%). and −4.41 (95% CI, −5.26 to −3.55; I2=95.03%) in groups L and P, respectively. Negative SMD shows VAS improvement after the intervention in both groups. The difference in subgroups was not significant (overlapping CI).
2) Visual Analog Scale leg (Fig. 3)
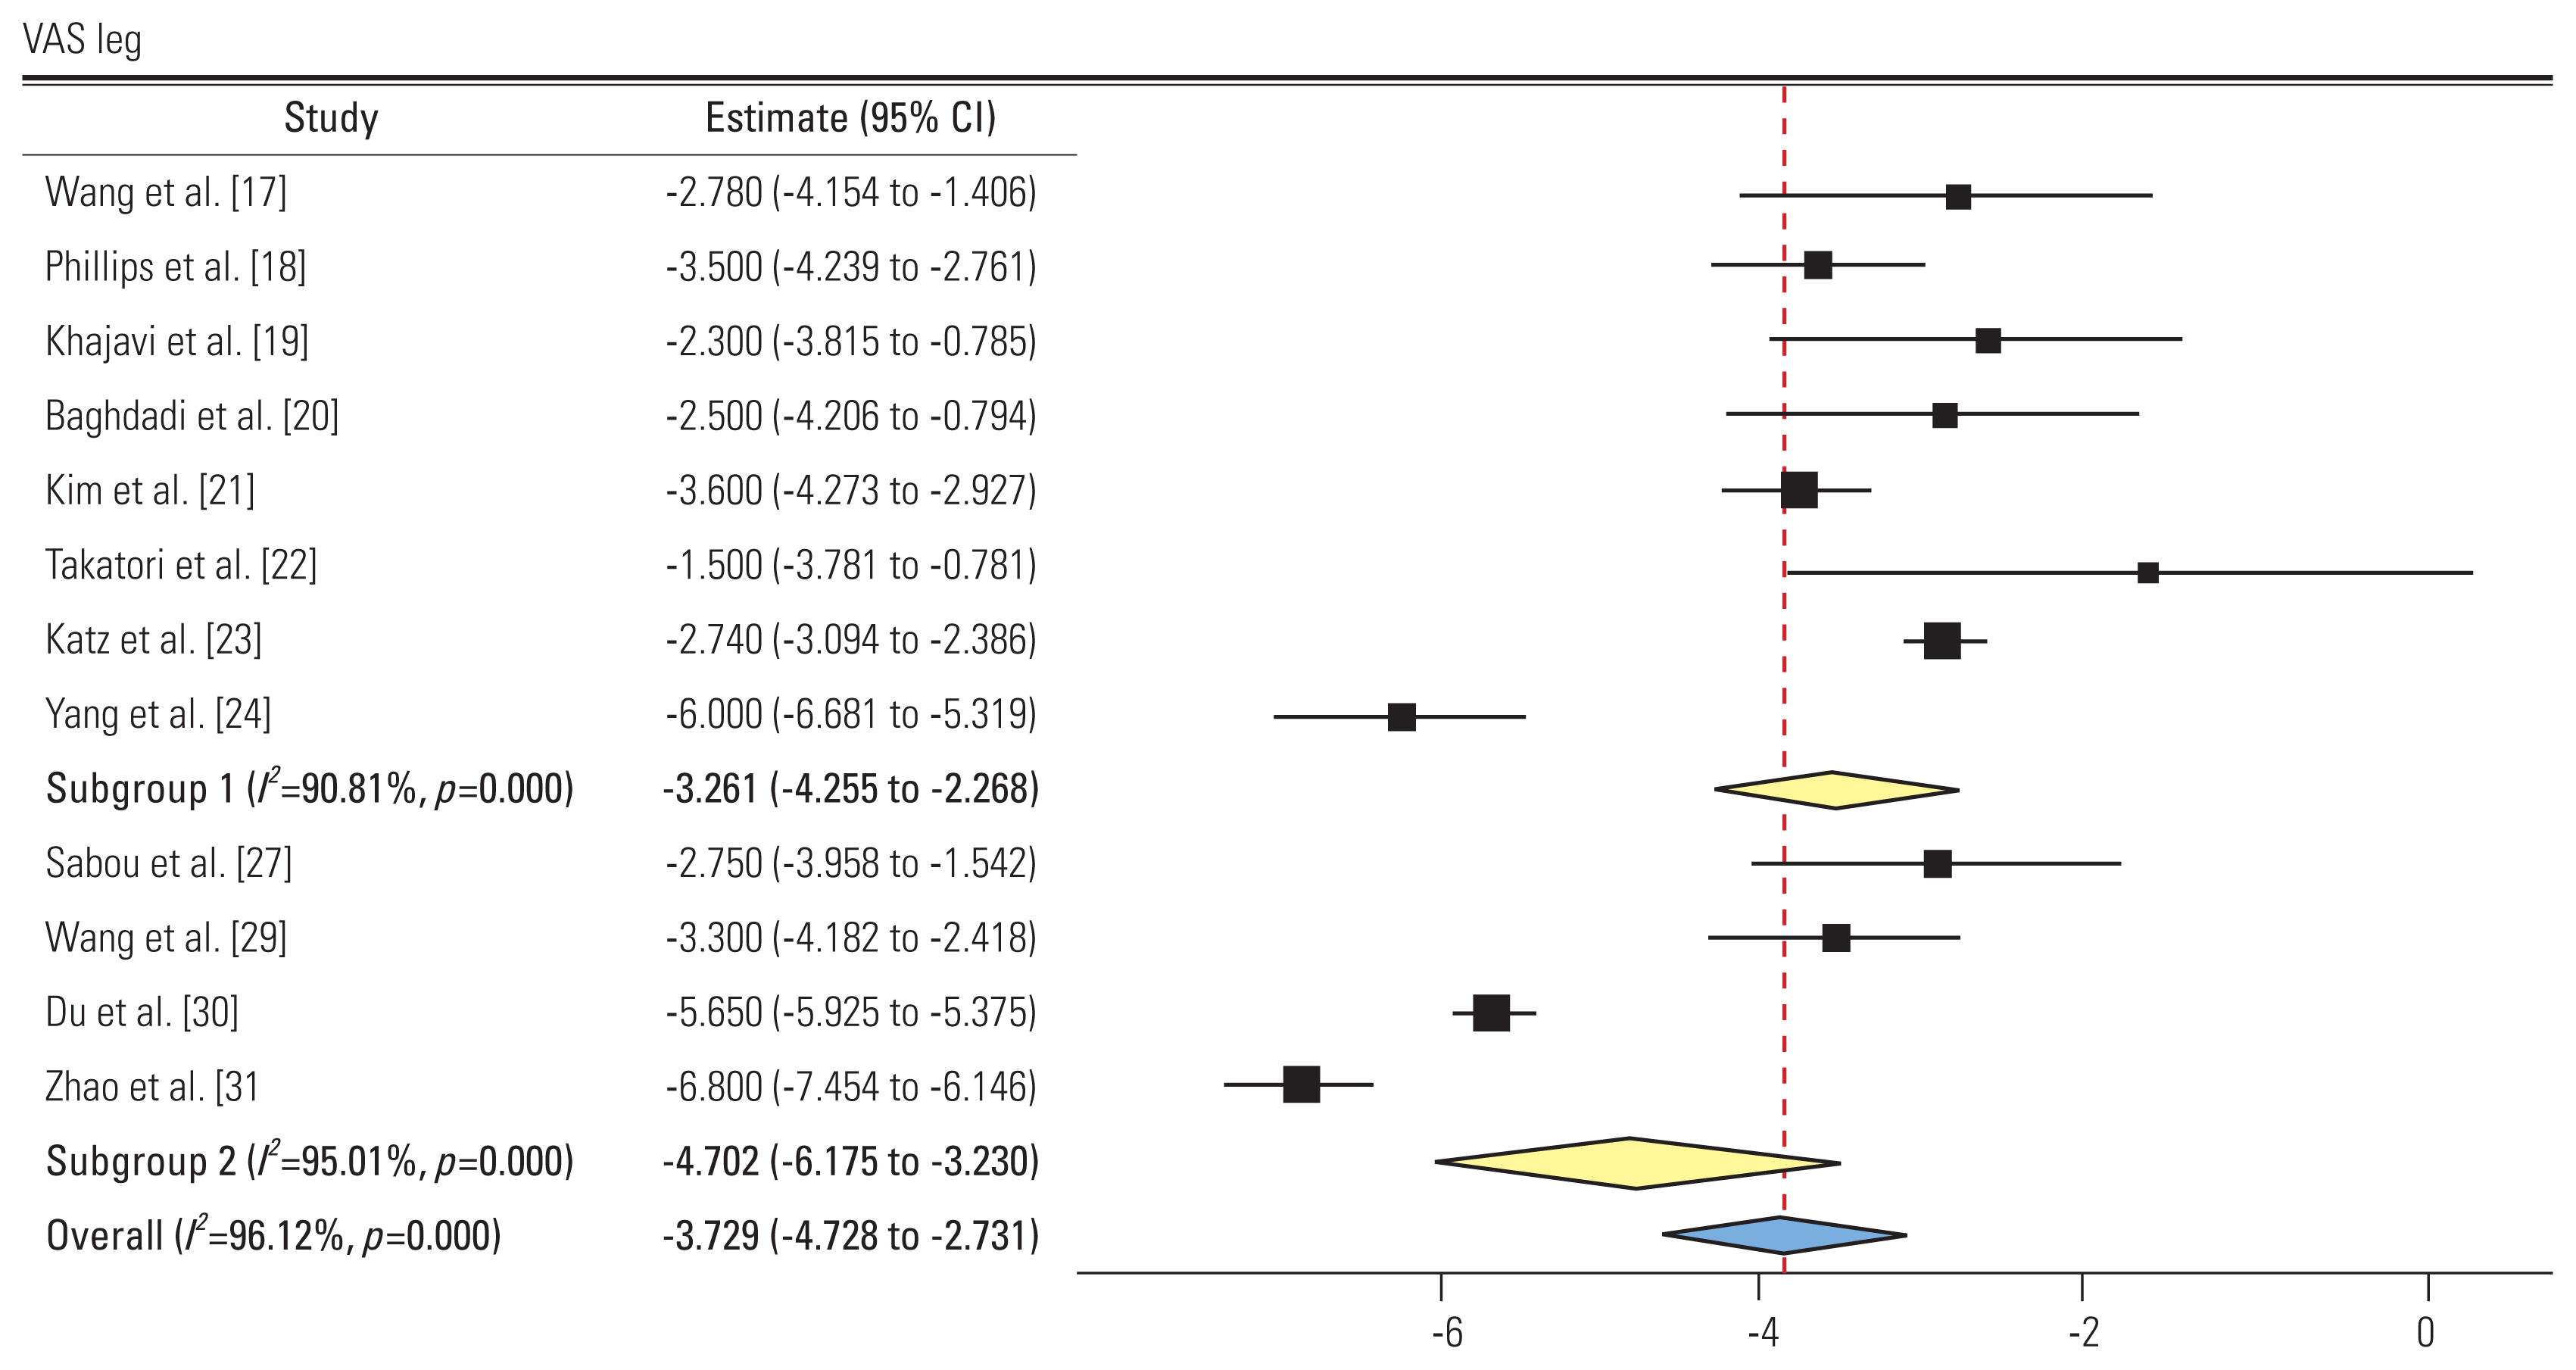
Forest plot showing Visual Analog Scale (VAS) leg (subgroup 1: group L, subgroup 2: group P). CI, confidence interval.
A total of 12 studies reported the pre- and post-intervention VAS scores for leg pain. Eight and four studies showed an SMD of −3.26 (95% CI, −4.25 to −2.26; I2=90.81%) and −4.7 (95% CI, −6.17 to −3.23; I2=95.01%) in groups L and P, respectively. All studies showed improvement in VAS scores postoperatively. The difference in subgroups was not significant.
3) Oswestry Disability Index (Fig. 4)
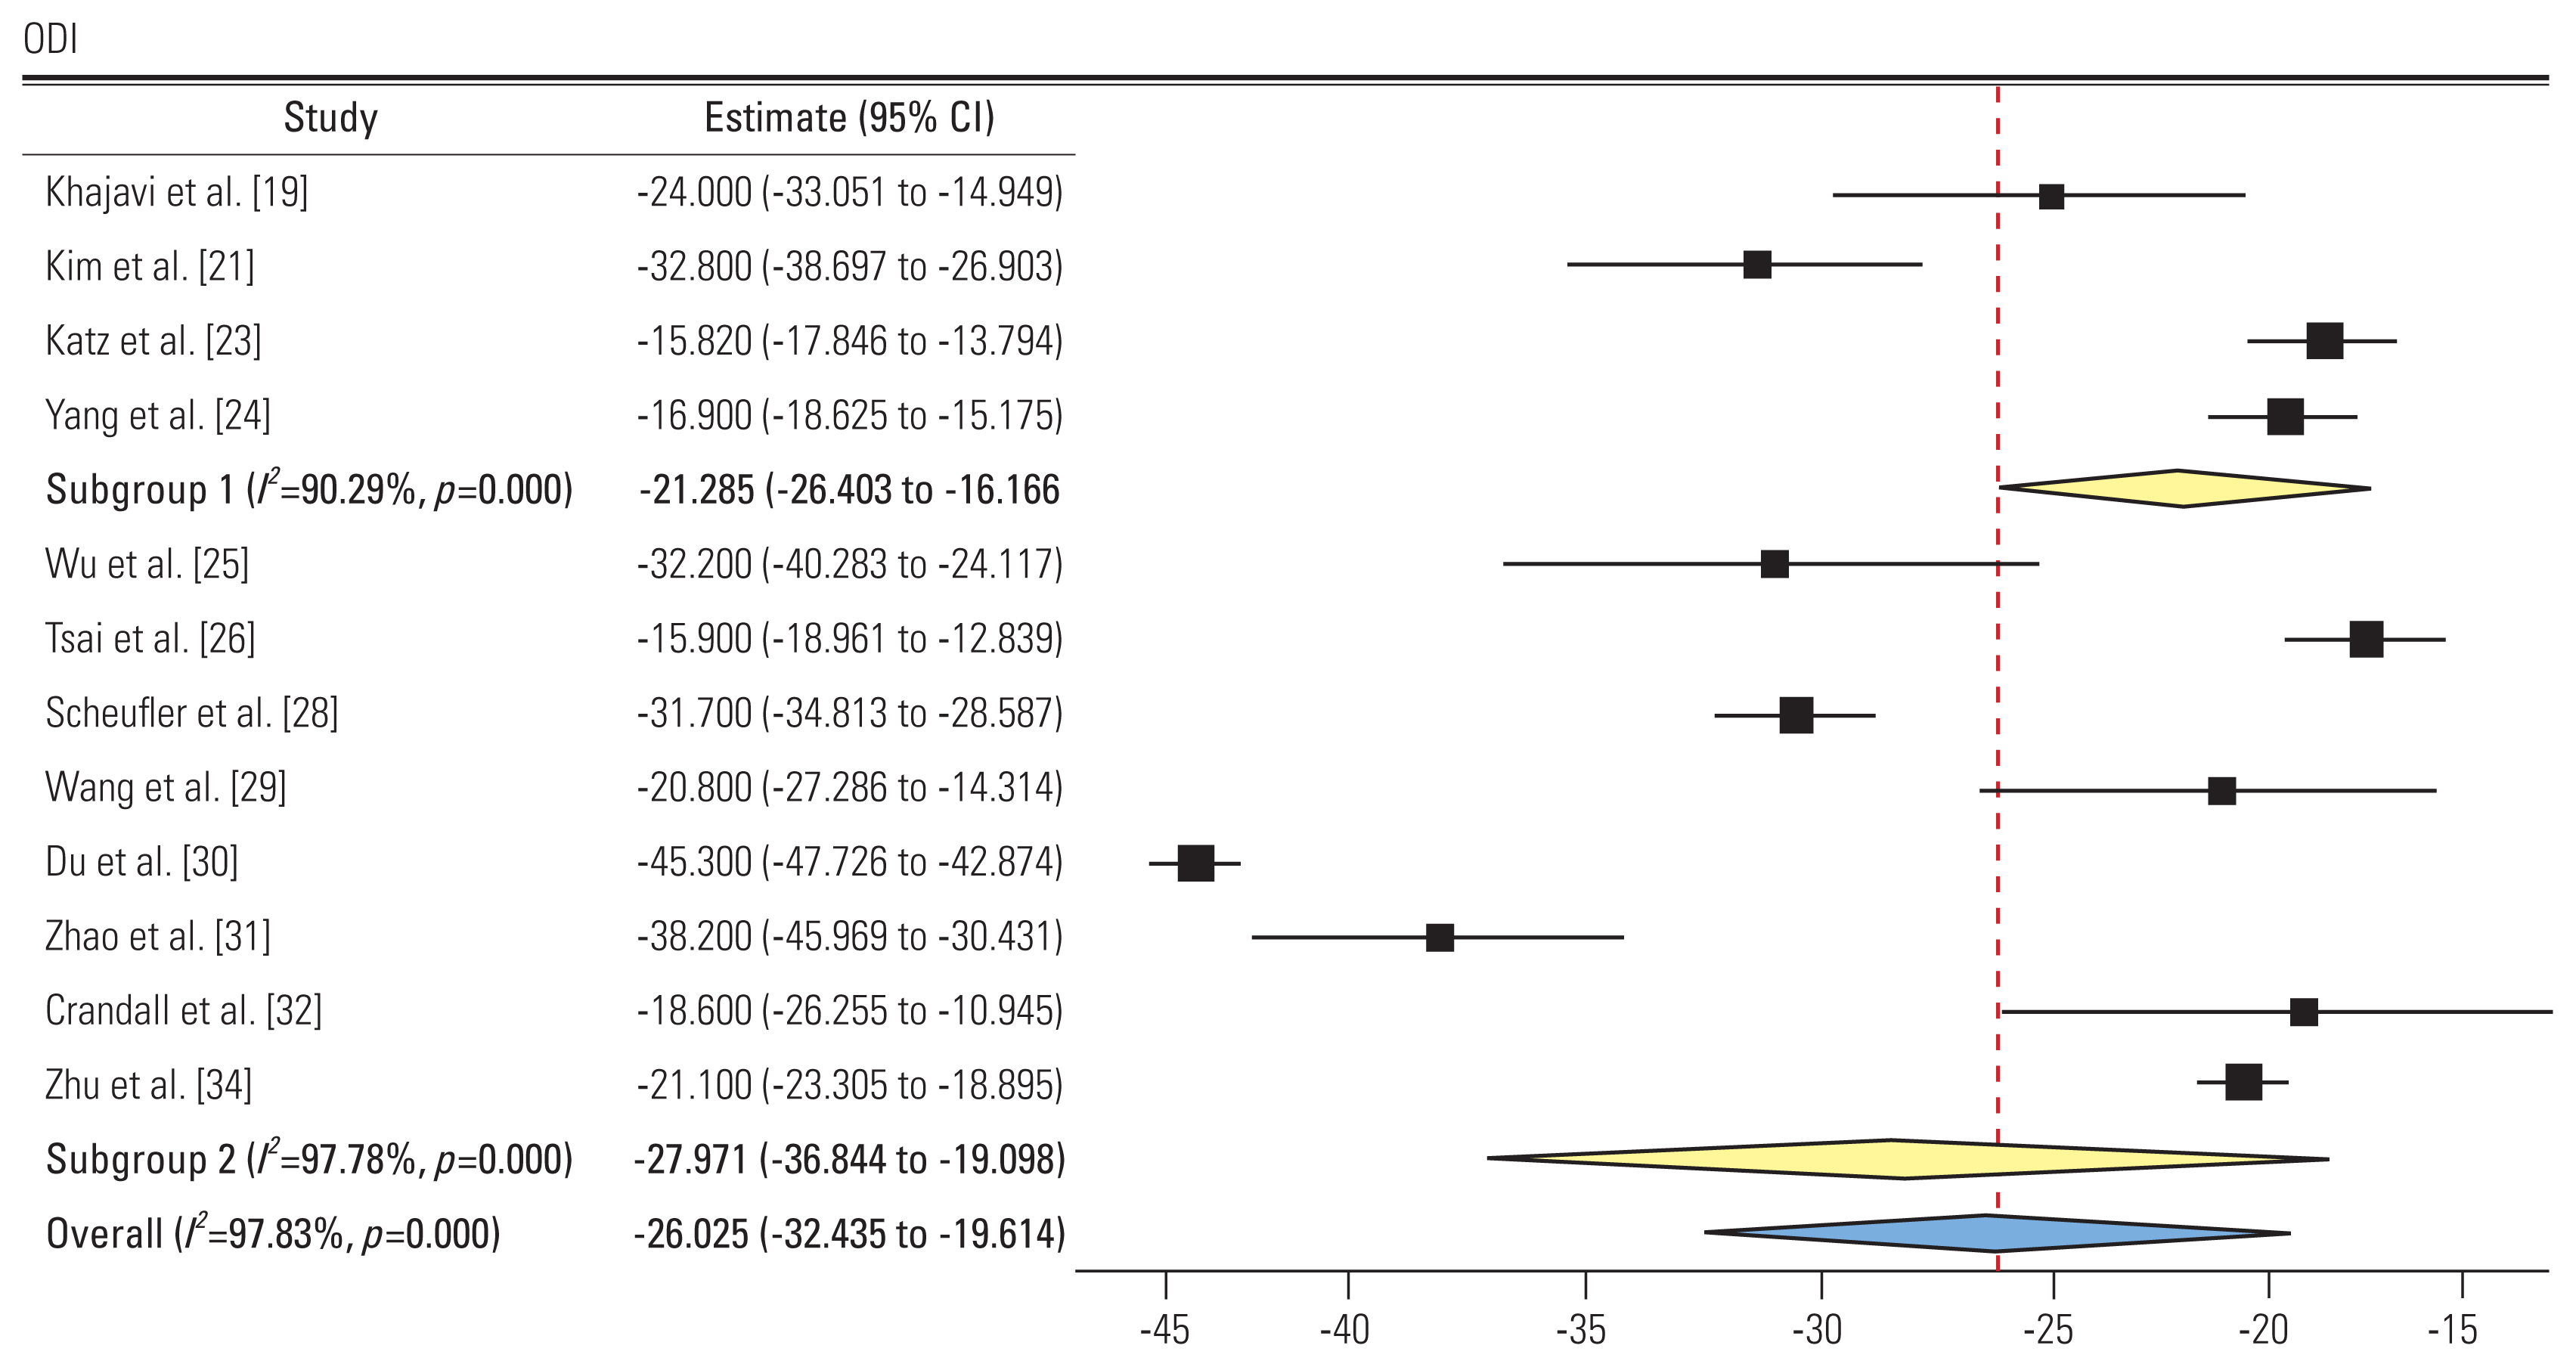
Forest plot showing Oswestry Disability Index (ODI) (subgroup 1: group L, subgroup 2: group P). CI, confidence interval.
A total of 12 studies reported the ODI score pre- and post-intervention. Four and nine studies showed an SMD of −21.28 (95% CI, −26.4 to −16.16; I2=90.29%) and −27.97 (95% CI, −36.84 to −19.09; I2=97.78%) in groups L and P, respectively. Negative SMD shows improvement in ODI postoperatively in both groups. The difference in subgroups was not significant.
4. Radiographic outcomes (Table 2)
1) Cobb’s angle (Fig. 5)
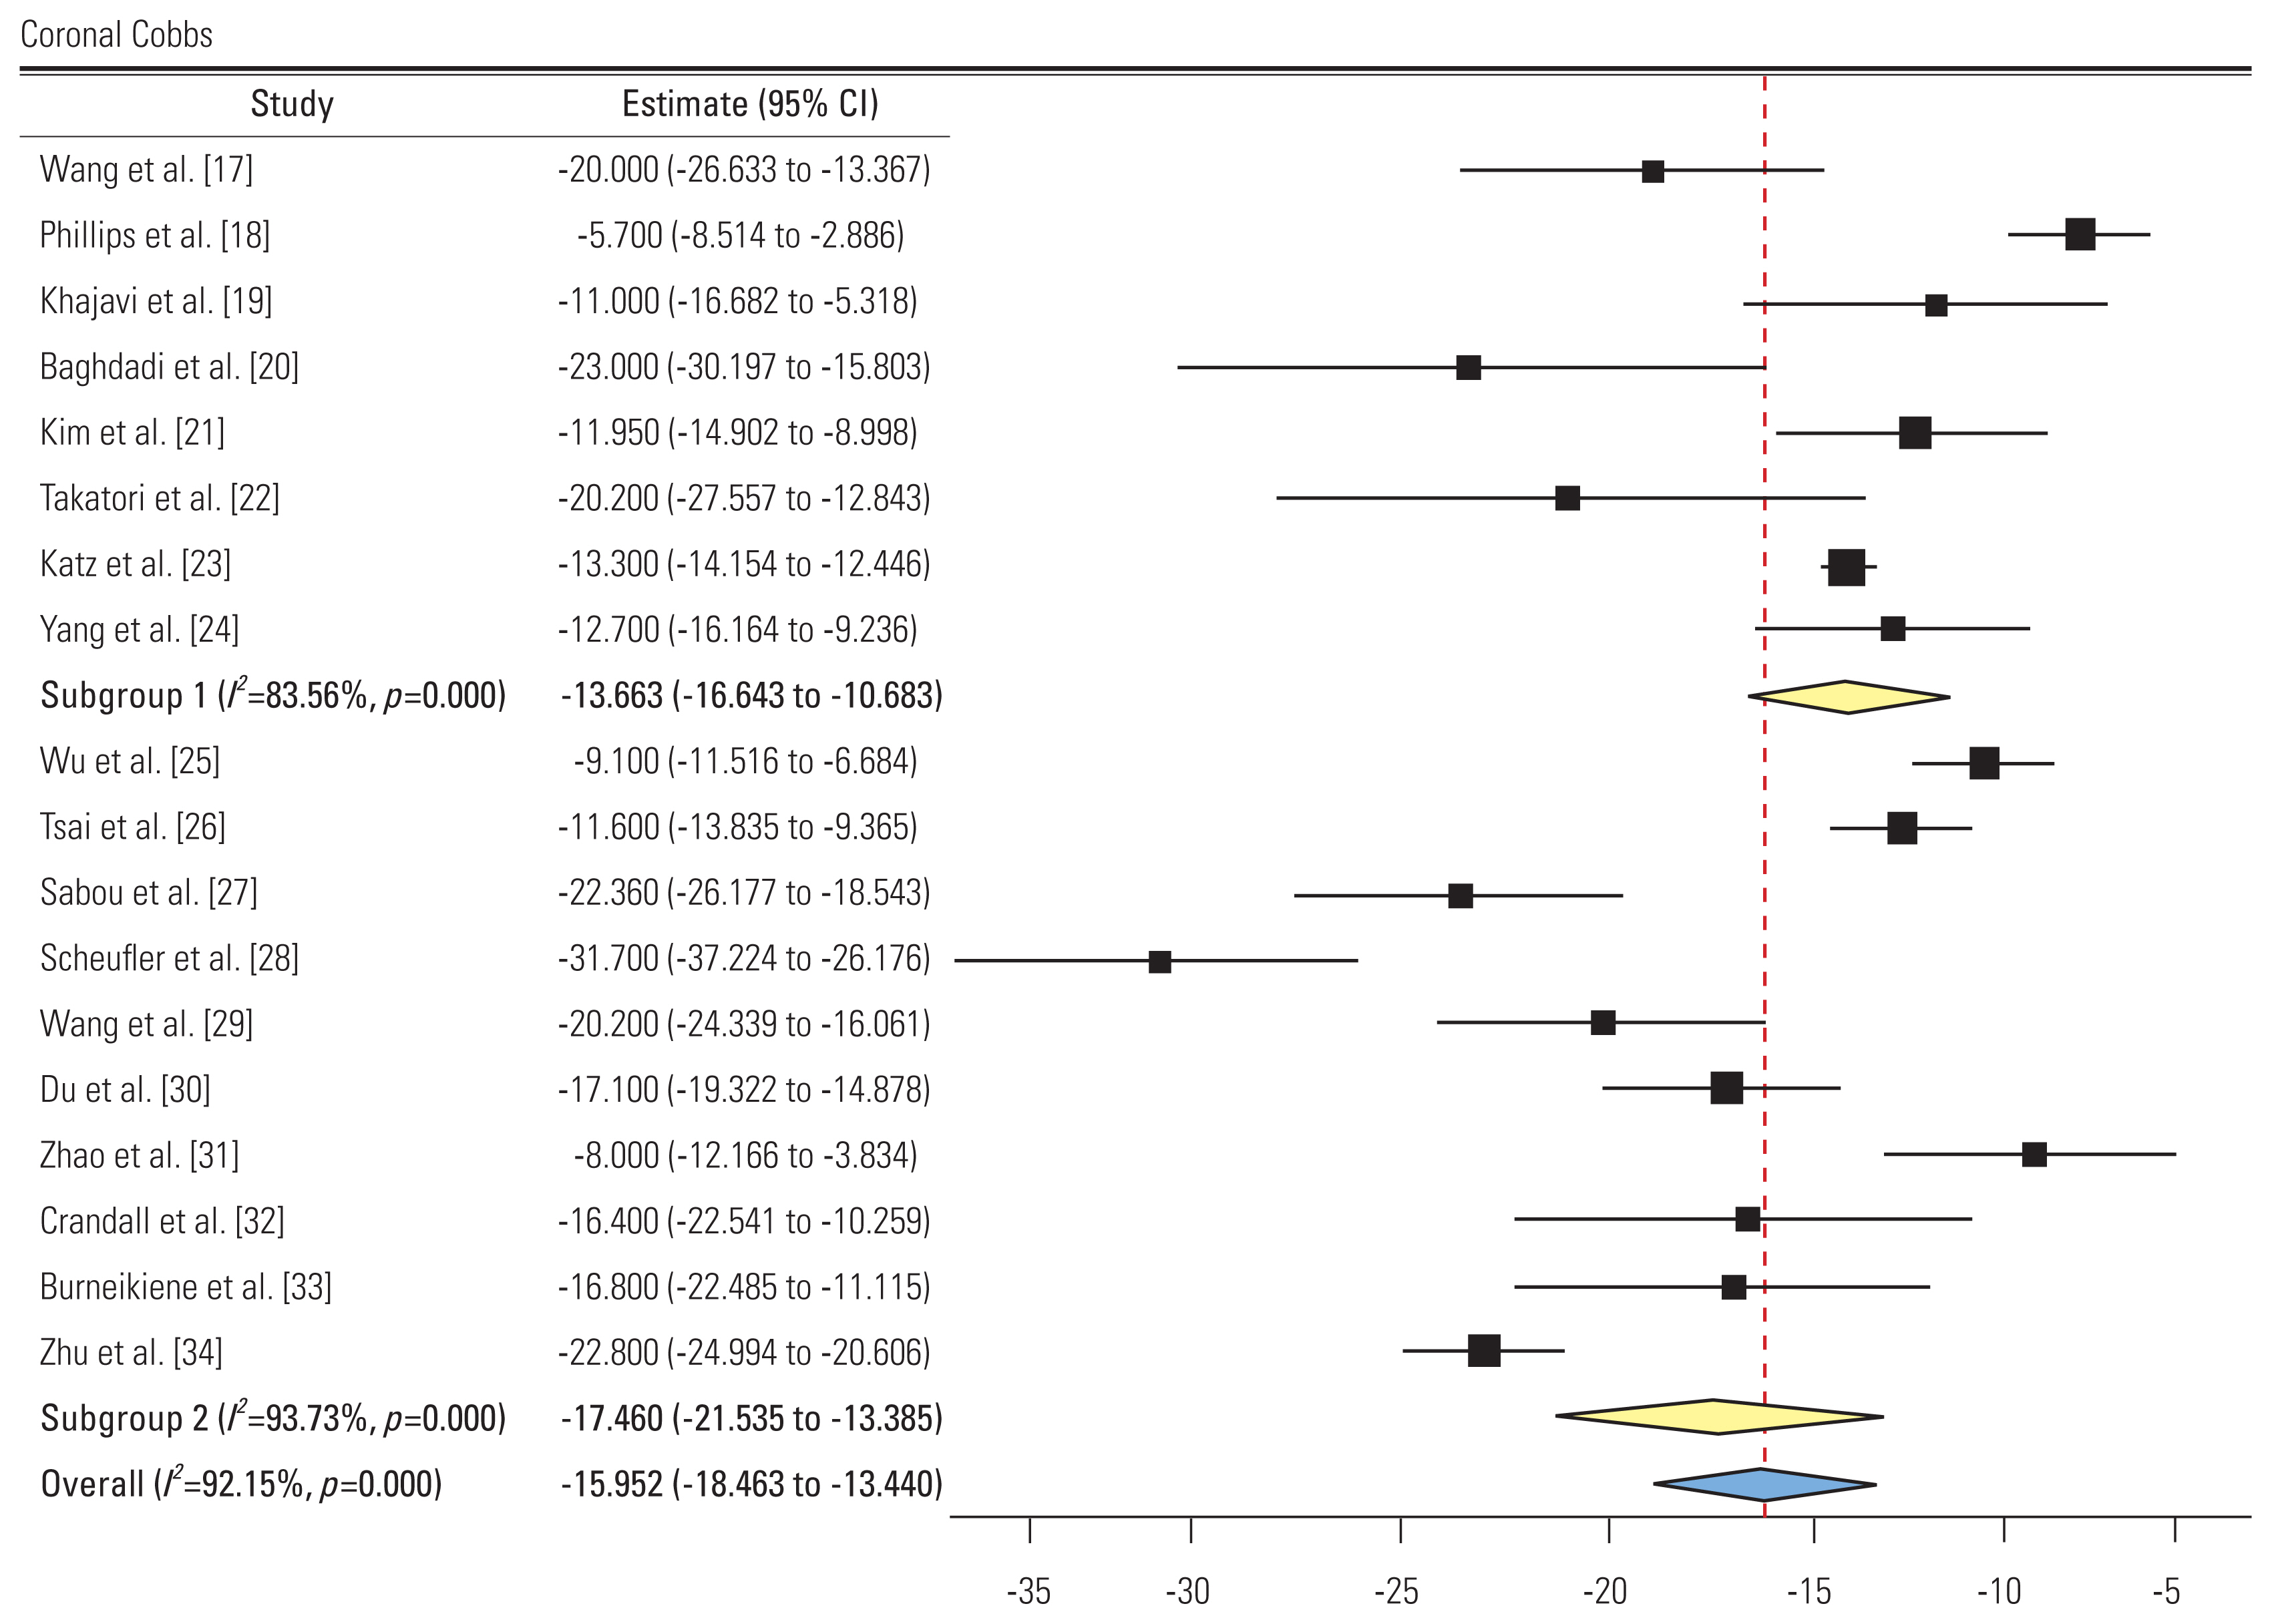
Forest plot showing coronal Cobbs (subgroup 1: group L, subgroup 2: group P). CI, confidence interval.
A total of 18 studies reported the pre- and post-intervention Cobb’s angle. Eight and 10 studies showed an SMD of −13.66 (95% CI, −16.64 to −10.68; I2=83.56%). and −17.46 (95% CI, −21.53 to −13.38; I2=93.73%) in groups L and, respectively. All studies showed a decreased Cobbs’ angle postoperatively. Subgroup difference was not significant.
2) Lumbar lordosis (Fig. 6)

Forest plot showing lumbar lordosis (subgroup 1: group L, subgroup 2: group P). CI, confidence interval.
A total of 17 studies reported the pre- and post-intervention LL angle. Seven and 10 studies showed an SMD of 15.6 (95% CI, 6.57 to 24.63; I2=95.82%) and 11.46 (95% CI, 5.6 to 17.32; I2=94.5%) in groups L and P, respectively. All studies except one showed an increased LL postoperatively [26]. The difference in subgroups was not significant.
3) Sagittal vertical axis (Fig. 7)
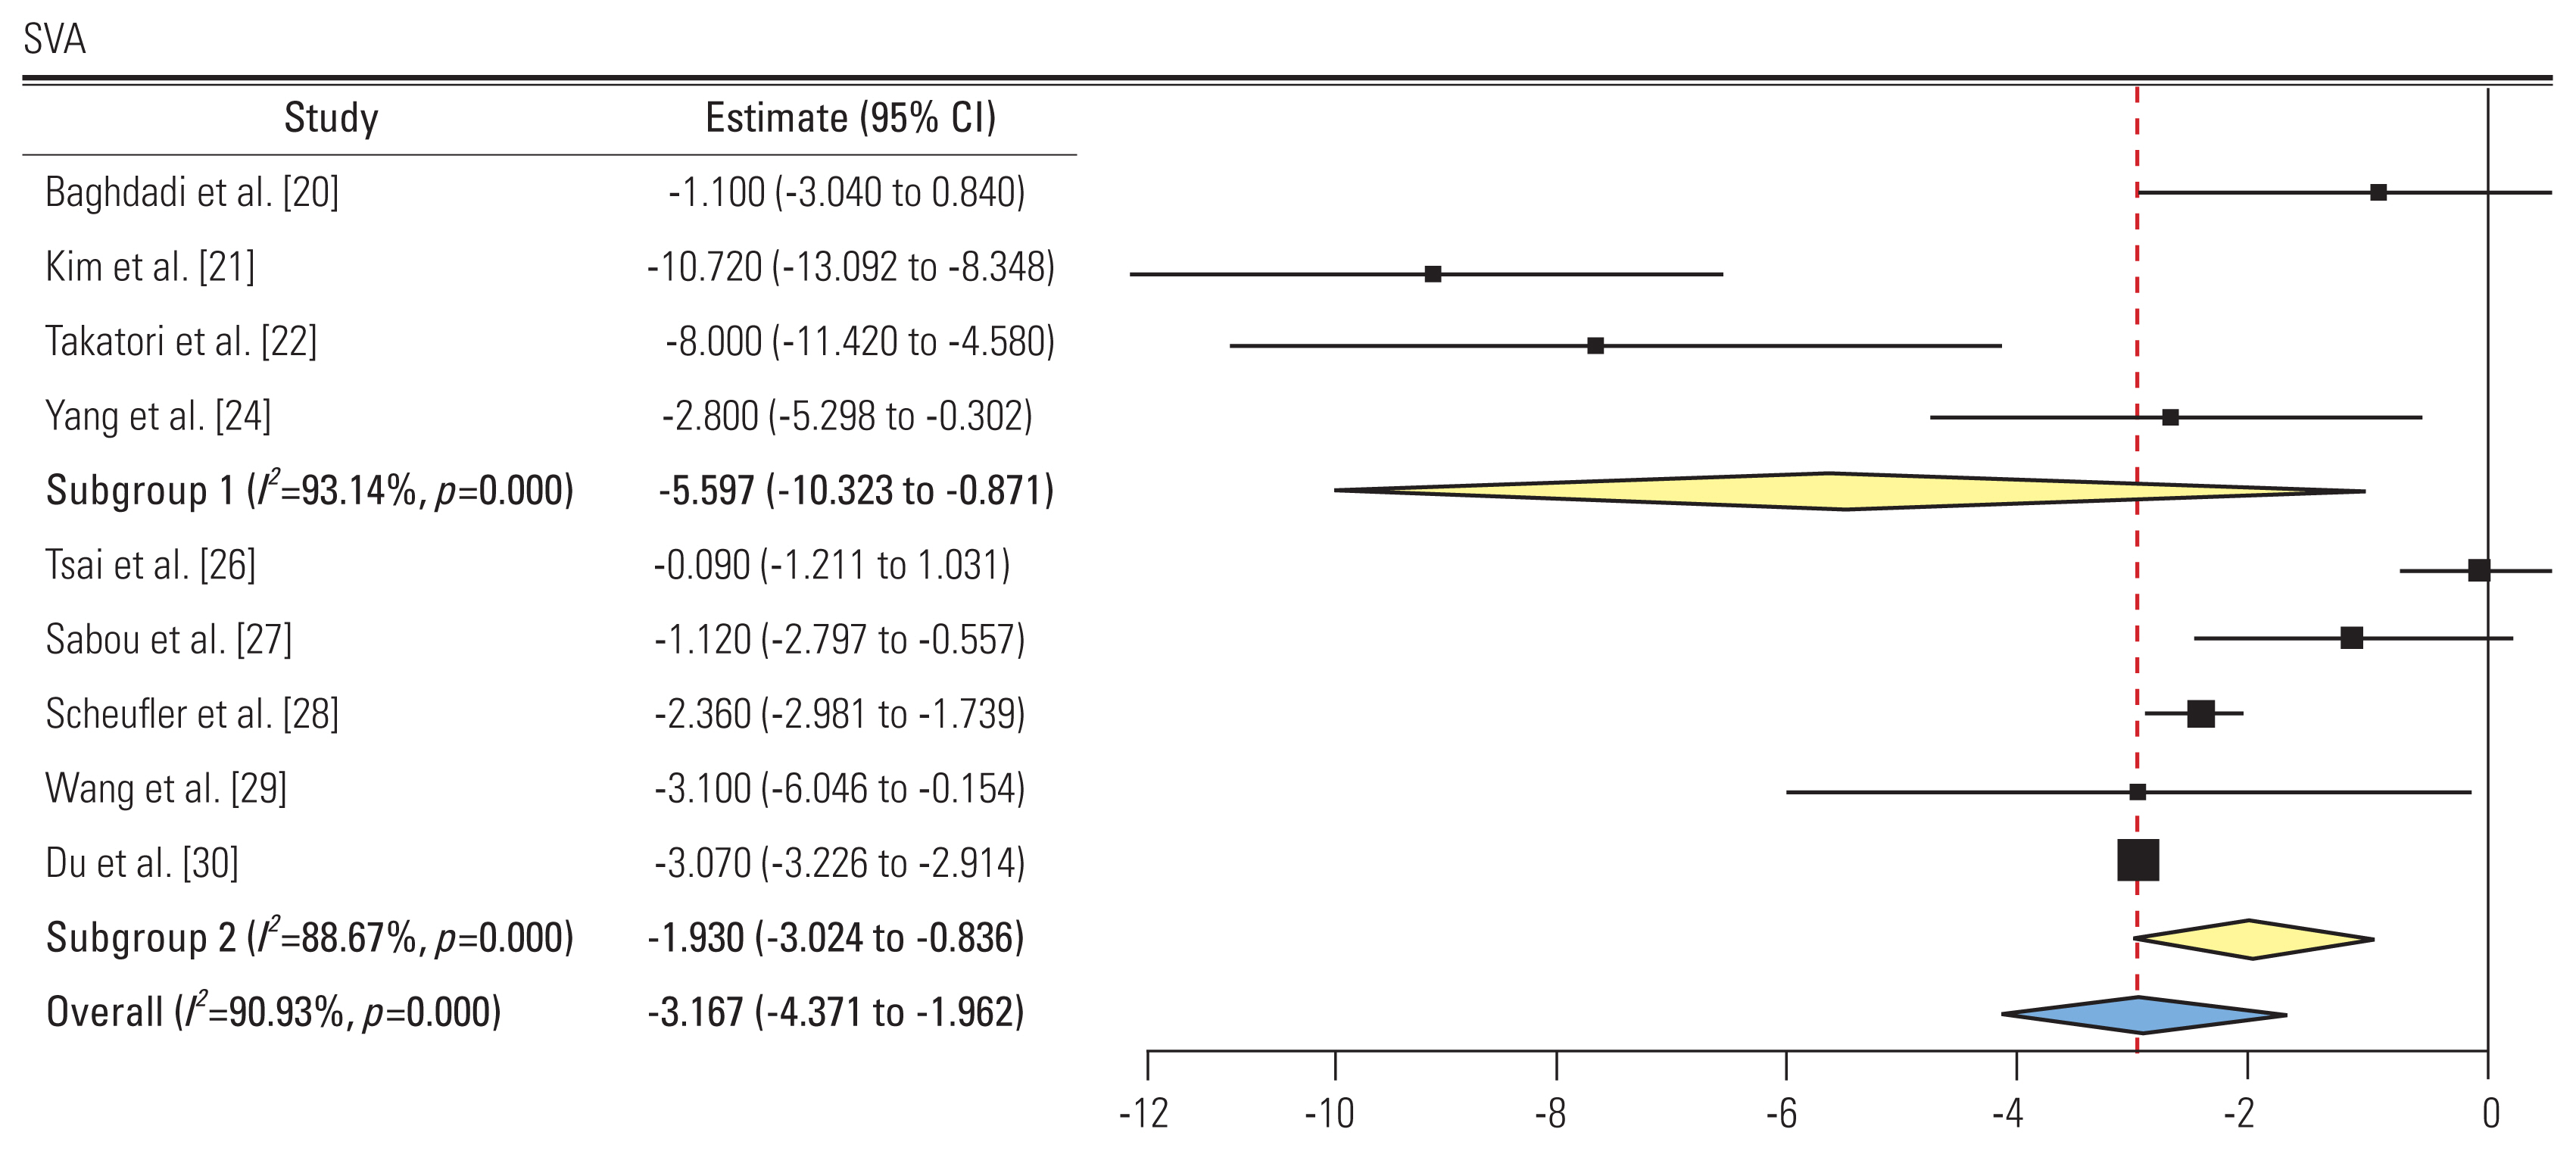
Forest plot showing sagittal vertical axis (SVA) (subgroup 1: group L, subgroup 2: group P). CI, confidence interval.
A total of nine studies reported the pre and post-intervention SVA. Four and five studies showed an SMD of −5.59 (95% CI, −10.32 to −0.87; I2=93.14%) and −1.93 (95% CI, −3.02 to −0.83; I2=88.6%) in groups L and P, respectively. All studies showed a decreased SVA postoperatively. The difference in subgroups was not significant.
5. Operative outcomes
Operative parameters were compared between group L, MIS-P subgroup, and Op-P subgroup. Only one study in group L [17], four studies in the MIS-P subgroup [28–31], and four studies in the Op-P subgroup [25,26,33,34] reported the total operative time and blood loss. The mean number of interbody fusion levels was 3.7 in group L (86 interbody fusions in 23 patients), 2.11 in the MIS-P subgroup (366 interbody fusions in 173 patients), and 2.49 in the Op-P subgroup (519 interbody fusions in 208 patients). Group L had significantly more interbody levels than both MIS-P and Op-P subgroups (p<0.05).
1) Operative time (Fig. 8)

Forest plot showing total operative time (subgroup 1: group L, subgroup 2: minimally invasive surgery [MIS] posterior subgroup, subgroup 3: open posterior subgroup). CI, confidence interval; NA, not available.
Only one study in group L reported total operative time with a mean of 401 minutes (95% CI, 351 to 450.9) [17]. Five studies in group L reported only lateral operative team (interbody fusion time), which was pooled to 170.14 minutes (95% CI, 114.5 to 225.6) [18,19,21,23,24]. In group P, the MIS-P subgroup (four studies) had pooled total operative time of 233.86 minutes (95% CI, 177.09 to 290.6; I2=98.4%) while the Op-P subgroup (four studies) had pooled total operative time of 380.23 minutes (95% CI, 283.5 to 476.9; I2=97.4%). A significant difference in total operative time was found between group L and MIS-P subgroup (p<0.05) while no difference was found between group L and Op-P subgroup.
2) Blood loss (Fig. 9)

Forest plot showing total blood loss (subgroup 1: group L, subgroup 2: minimally invasive surgery [MIS] posterior subgroup, subgroup 3: open posterior subgroup). CI, confidence interval; NA, not available.
Only one study in group L reported a mean total blood loss of 477 mL (95% CI, 201.7 to 752.2) [17]. Three studies in group L reported only lateral blood loss pooled at 86.93 mL (95% CI, 66.8 to 107) [19,21,24]. In group P, the MIS-P subgroup (four studies) had pooled total blood loss of 385.05 mL (95% CI, 224.4 to 545.7; I2=98.6%) while the Op-P subgroup (four studies) had pooled total blood loss of 1,325.6 mL (95% CI, 1,004.4 to 1,646.7; I2=91.6%). A significant difference was found between group L and the Op-P subgroup (p<0.05).
3) Fusion rate (Fig. 10)
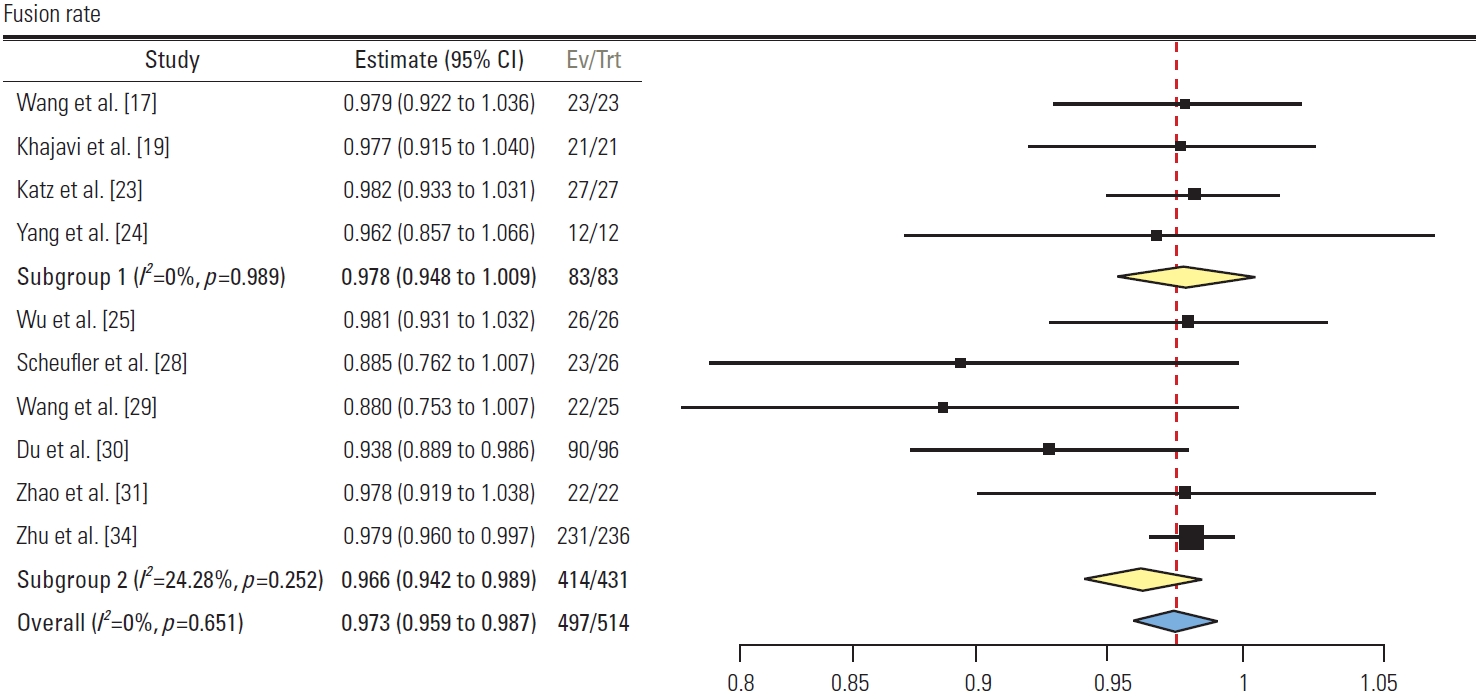
Forest plot showing fusion rates (subgroup 1: group L, subgroup 2: minimally invasive surgery [MIS] posterior subgroup, subgroup 3: open posterior subgroup). CI, confidence interval; Ev/Trt, number of events/number of treatments.
A total of 10 studies reported the fusion rate. Four studies in group L had pooled fusion rate of 97.8% (95% CI, 94.8 to 100; I2=0%). Six studies in group P had pooled fusion rate of 96.6% (95% CI, 94.2 to 98.9; I2=25.4%). No significant difference was found between the two groups.
4) Length of hospital stay (Fig. 11)
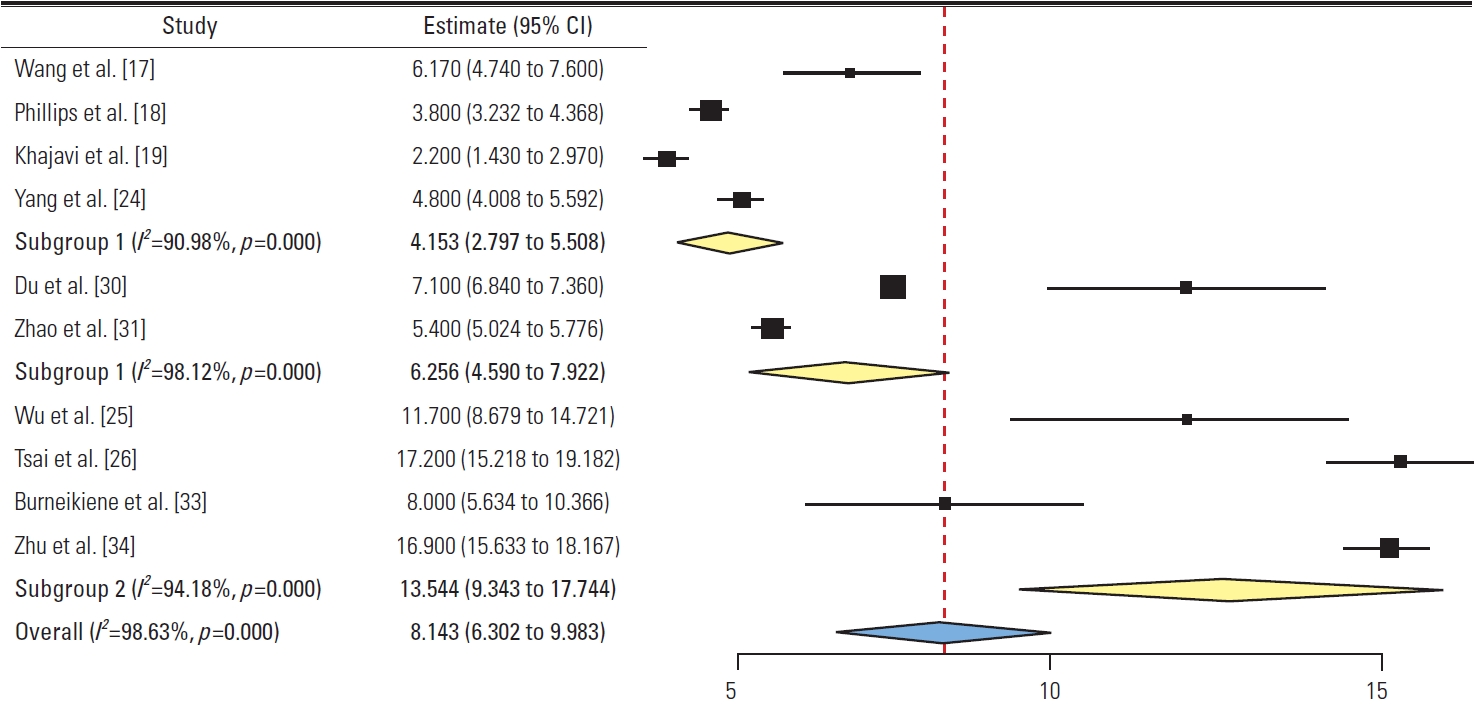
Forest plot showing length of hospital stay (subgroup 1: group L, subgroup 2: minimally invasive surgery posterior subgroup, subgroup 3: open posterior subgroup). CI, confidence interval.
Four studies in group L had pooled LOHS of 4.15 days (95% CI, 2.79 to 5.5; I2=90.9%). In group P, the MIS-P subgroup (two studies) had pooled LOHS of 6.25 days (95% CI, 4.59 to 7.92; I2=98.1%) while the Op-P subgroup (four studies) had pooled LOHS of 13.54 days (95% CI, 9.34 to 17.74; I2=94.1%). A significant difference was found between group L and the Op-P subgroup (p<0.05).
6. Complications (Table 3)

Complications
1) Dural tear
Pooled dural tear rate across two studies [17,23] in group L was 4% (95% CI, 1.4 to 9.4) compared to 7% (95% CI, 2 to 12) across four studies [25,28,31,33] in group P with no significant difference.
2) Wound related
Wound related complications including Wound infections, dehiscence, delayed healing, and seroma were reported in four studies in group L with a pooled rate of 7.5% (95% CI, 1 to 13.9) [18,20,22,23]. No significant difference was noted in comparison with group P with a pooled rate of 2.7% (95% CI, 1.1 to 4.3) across six studies [25–27,30,33,34].
3) Neurological deficit
Pooled rate of permanent neurological deficit across two studies [18,20] in group L was 7.8% (95% CI, 3.4 to 12.3) compared to 2.4% (95% CI, 0.1 to 4.8) across four studies [27,30,33,34] in group P with no significant difference.
4) Transient sensorimotor deficit
In group L, pooled rate of transient neurological deficit across three studies was 24.3 (95% CI, 13.1 to 35.4), which mainly included transient hip flexor weakness and thigh numbness [17,19,24]. Group P had pooled rate of 5.6% (95% CI, 5 to 10.7) across three studies [25,32,35]. The difference approached significance (p<0.05).
5) Implant or construct related
Complications included screw loosening, pull-out, and rod breakage. Pooled rate in group L across threes studies [17,20,22] was 7.3% (95% CI, 1.2 to 13.5) compared to 14.9% (95% CI, 8.7 to 21.1) across five studies [26,27,29,33,34] in group P with no significant difference.
6) Re-surgery
Pooled re-surgery rate across seven studies [17–20,22–24] in group L was 7.9% (95% CI, 4.3 to 11.4) compared to 6% (95% CI, 2.5 to 9.5) across 10 studies [25–34] in group P with no significant difference.
7) Pseudoarthrosis
Pooled pseudoarthrosis rate across one study [17] in group L was 4.3% (95% CI, 4 to 12.7) compared to 6.3% (95% CI, −1 to 13.7) across three studies [30,33,35] in group P with no significant difference.
8) Others
Complications, such as postoperative thigh pain, retrograde ejaculation, and visceral injuries, were reported only in group L. Pooled rate of postoperative thigh pain across four studies was 7.7% (95% CI, 2.2 to 13.2) [17,19,21,22]. The pooled rate of visceral injuries across two studies was 2% (95% CI, −2 to 6) [18,21]. Retrograde ejaculation was reported in only one patient in one study with a rate of 3.7% (95% CI, 3.4 to 10.8) [23]. Complications of adjacent segment degeneration (ASD), such as vertebral fractures, disc degeneration, and proximal junctional kyphosis were reported only in group P across eight studies with a pooled rate of 8.6% (95% CI, 5.2 to 12.2) [26,27,30–35].
9) Funnel plots
Funnels plot for clinical (VAS back, VAS leg, and ODI) and radiographic outcomes (Cobb’s angle, LL, and SVA) showed asymmetry on visual inspection (Fig. 12). In clinical outcomes, studies were missing from the bottom half of the plot, indicating publication and selective outcome reporting bias. Additionally, heterogeneity across the studies was high due to the difference in patient selection and intervention, which could have led to asymmetry in funnel plots of radiographic outcomes.
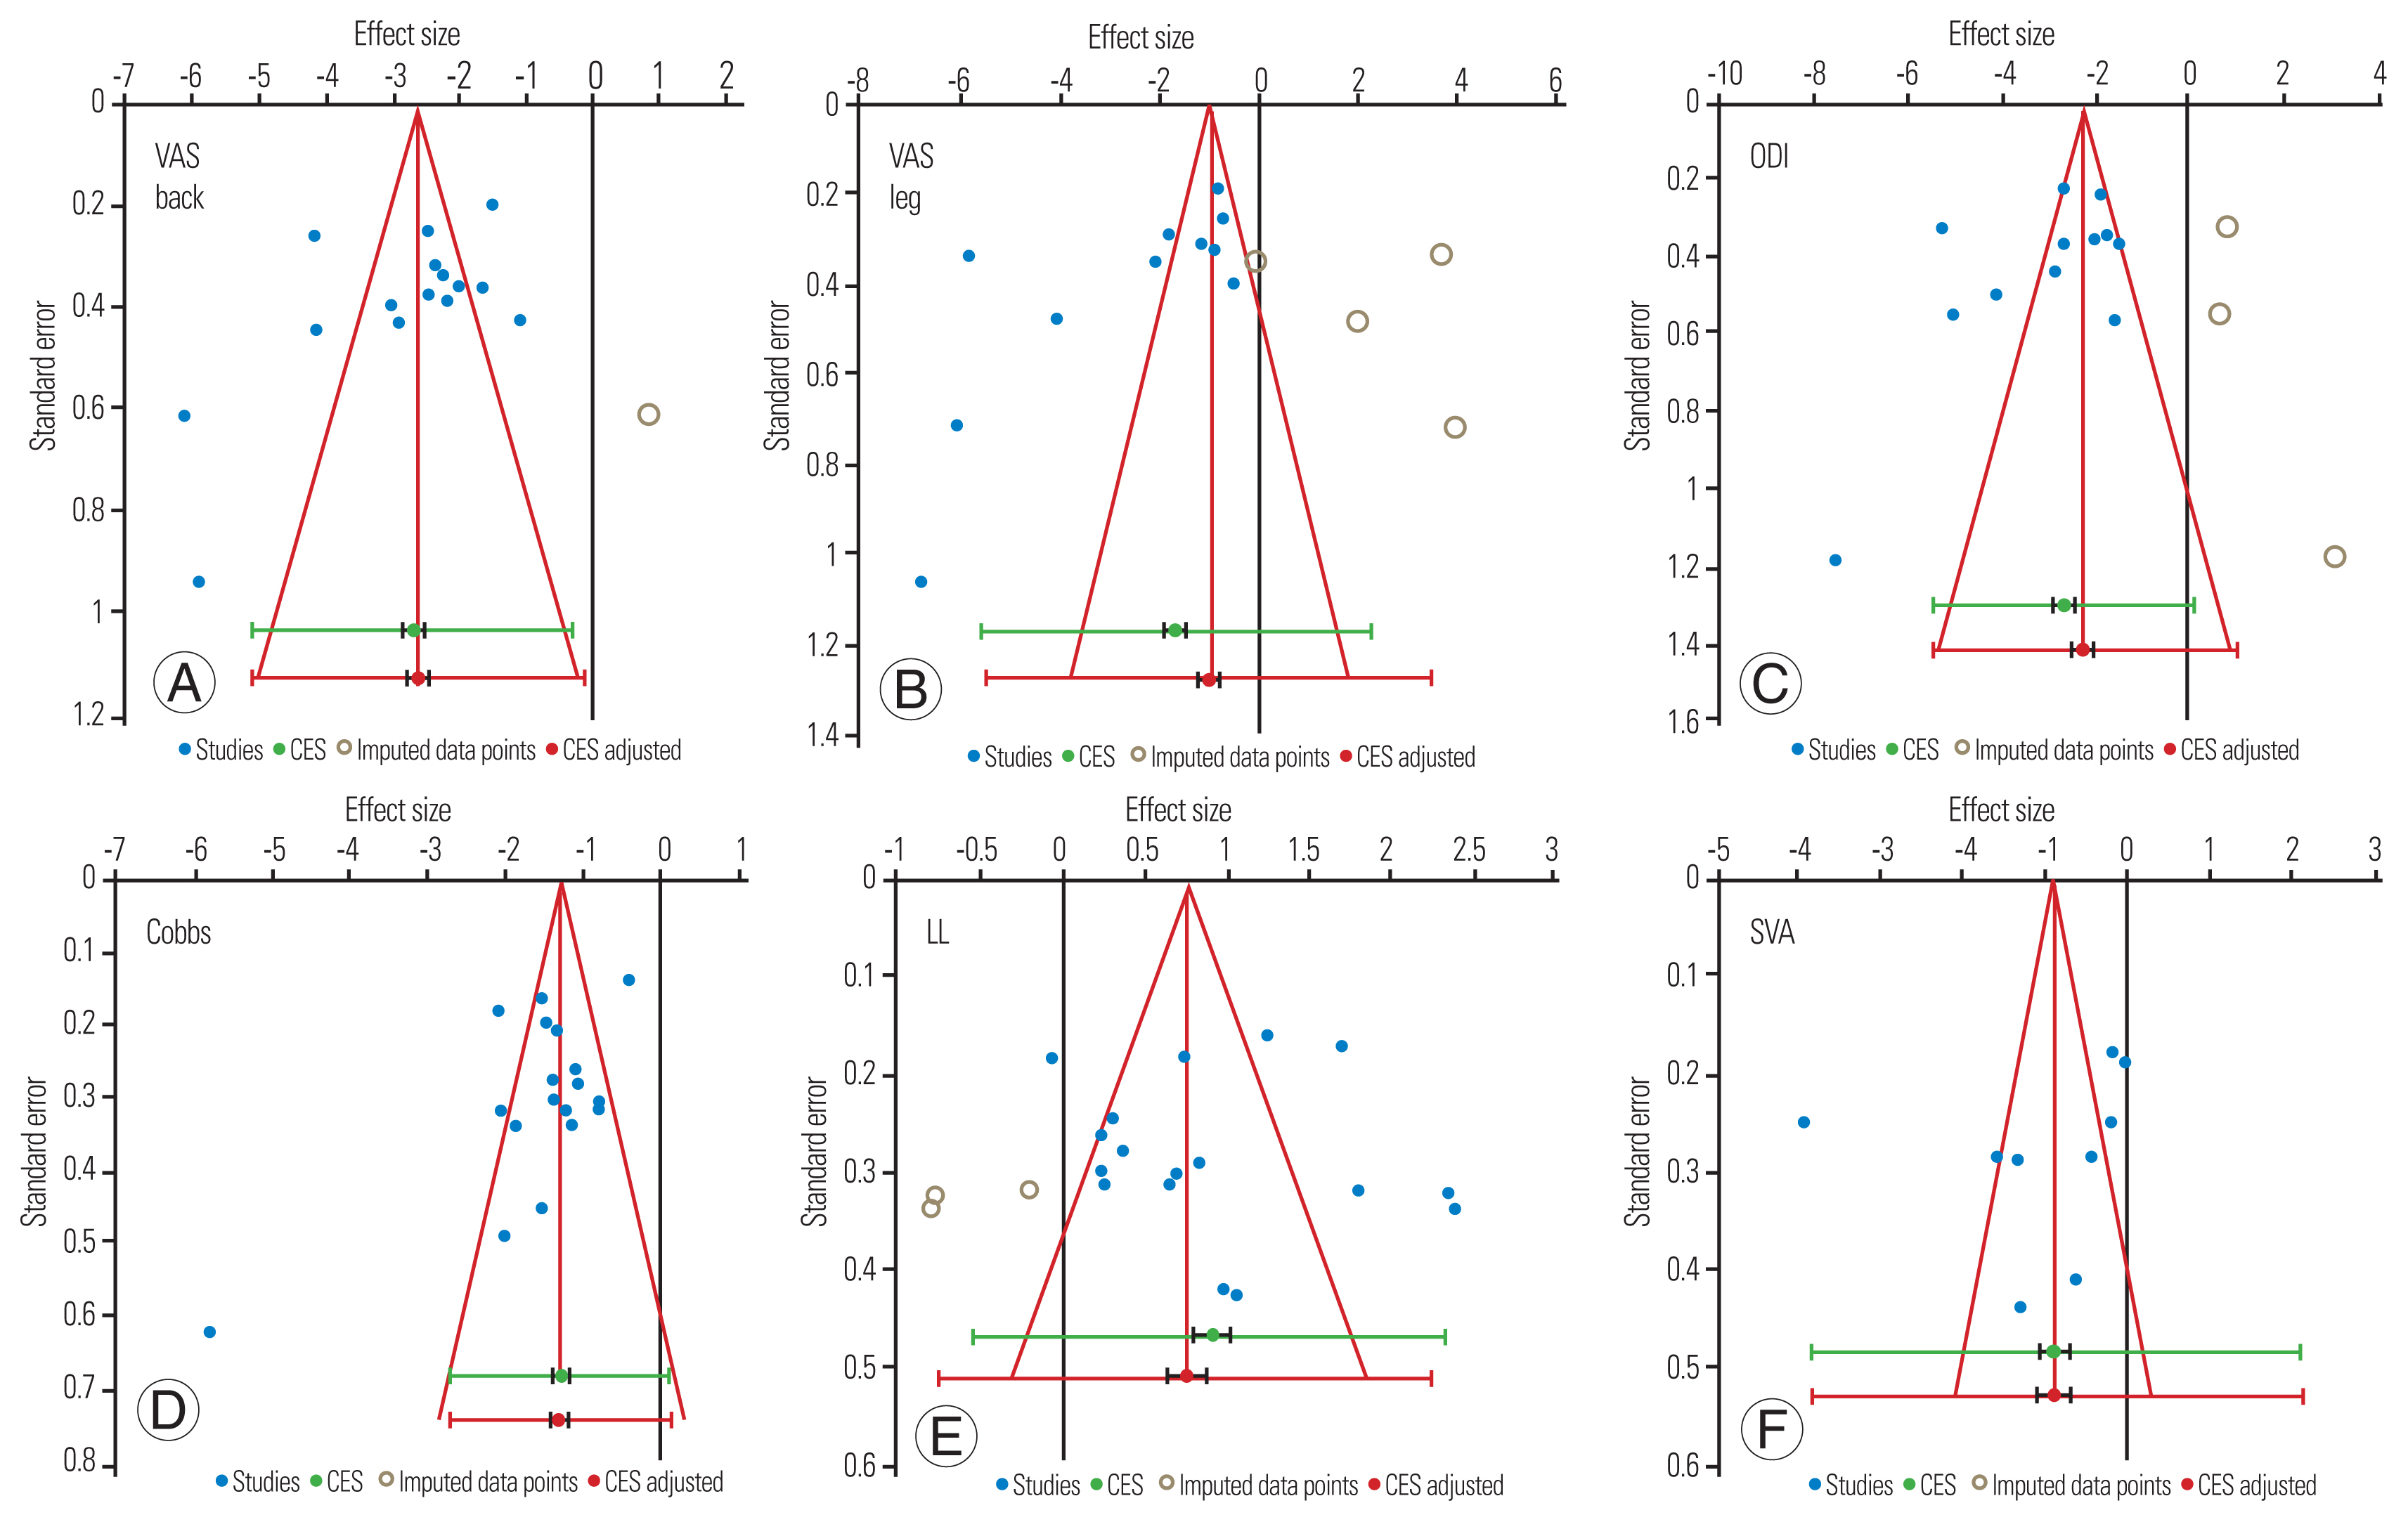
Funnel plots. (A) Visual Analog Scale (VAS) back. (B) VAS leg. (C) Oswestry Disability Index (ODI). (D) Cobbs. (E) Lumbar lordosis (LL). (F) Sagittal vertical axis (SVA). CES, combined effect size.
Discussion
ADS should be differentiated from adult idiopathic scoliosis as it is characterized by progressive spinal element degeneration due to aging, which is usually asymmetric, leading to coronal and sagittal malalignment. It is also known as “de novo scoliosis” or “primary degenerative scoliosis” or “type 1 adult scoliosis” [1]. Not only the pathophysiology is different, but the clinical presentation also varied as patients with ADS present with more complaints of back pain, neurogenic claudication, and radiculopathy than deformity cosmetic concerns. Hence, the treatment goals of patients with ADS are different from patients with other deformities. Adequate decompression is equally important along with deformity correction for patient satisfaction and health-related quality of life (HRQOL) improvement [3]. Thus, the authors conducted this systematic review to generate a piece of high-quality evidence to compare the outcomes of deformity correction and direct decompression from the posterior approach versus indirect decompression from the lateral approach.
The systematic reviews in existing literature mostly compared different lumbar interbody fusion procedures in degenerative disc disease [36–39]. Very few systematic reviews have analyzed the surgical outcomes in patients with adult scoliosis, and most of them had included a heterogeneous cohort of patients, with different curve and procedure types [14–16,40]. This systematic review included only studies reporting ADS with almost similar curve types and tried to analyze the outcomes of different interbody fusion techniques. These studies were observational; however, all were of good quality on assessment. Additionally, subgroup analyses were done to separately report the relevant outcomes, such as blood loss, operative time, and LOHS, for open and minimally invasive procedures.
Most of the studies included VAS (back and leg) and ODI as patient-reported outcome measures (PROM) while other HRQOL measures, such as EuroQol-5 dimension (EQ5D), 36-item Short Form Health Survey (SF-36), and Scoliosis Research Society-22 (SRS-22), were missing; thus, they could not be analyzed. All studies showed improvement in VAS back (lateral approach: −55% reduction, posterior approach: −58% reduction) and VAS leg (lateral group: −60% reduction, posterior group: −70% reduction) postoperatively. No statistically significant difference was found between the two groups. The maximum change in VAS was seen in studies with the highest preoperative VAS score for VAS back [20,34] and leg [24,31]. Ledonio et al. [16], in a meta-analysis on ADS, showed that preoperative values for VAS were significantly associated with treatment effect. Similarly, ODI also improved postoperatively in both the groups (lateral group: −46%, posterior group: −58%) with no significant difference. Both VAS and ODI improvement in this meta-analysis in both groups reached MCID values [41–43]. Therefore, both direct and indirect decompression can give equal and promising functional outcomes in modest curves of degenerative scoliosis.
All the studies showed a reduced coronal Cobb’s postoperatively in both the groups (lateral group: −56.5%, posterior group: −62.3%). Studies with maximum preoperative Cobb’s showed maximum treatment effect, consistent with the study results by Ledonio et al. [16]. LL also improved postoperatively in both the groups, except in one study by Tsai et al. [26], where deterioration in the mean LL occurred by 1° after instrumented PLIF in 58 patients of degenerative lumbar scoliosis. SVA postoperatively improved in all studies in both groups. However, most of the studies did not mention the standing full-length X-rays, which are required for correct radiographic SVA measurement, accounting for heterogeneity in measurements. Few previous comparative studies showed better radiological outcomes with good sagittal alignment restoration with lateral interbody fusion over posterior interbody fusion [44,45]. However, no significant difference was seen between the two groups about radiological outcomes in our study. This observation is also supported by previous systematic reviews [37,46], which have not shown any significant difference in radiographic outcomes on LLIF comparison with traditional TLIF/PLIF.
We separately performed a subgroup analysis for operative parameters, such as blood loss, operative time, and LOHS, for open and MIS, due to the heterogeneity in the surgical procedures. The pooled total operative time of group L (401 minutes) was significantly more than the MIS-P subgroup (238.8 minutes), while it was comparable to the Op-P subgroup (380.2 minutes). Positioning of patients from lateral to prone for posterior instrumentation after interbody fusion (LLIF/XLIF/OLIF) explains the increased operative time in the lateral approach for ADS deformity correction. Additionally, the average number of interbody fusion levels was significantly more in group L compared with group P, this could explain the shorter operative time in group P. The pooled total blood loss of group L (477 mL) was comparable with the MIS-P subgroup (385 mL), while significantly different from the Op-P subgroup (1,325 mL). Li et al. [38] conducted a systematic review for comparison of OLIF versus MI-TLIF in degenerative disc disease and reported the advantage of OLIF over MI-TLIF in operative time and blood loss while no differences were found in LOHS. While conducting this meta-analysis, the authors found that most of group L reported only lateral operative time and blood loss (excluding posterior instrumentation operative time and blood loss), which could not be compared to group P [18,19,21,23,24]. A significant difference was found in LOHS on the comparison of group L (4.15 days) and the Op-P subgroup (8.1 days), while it was comparable with the MIS-P subgroup (6.25 days).
No significant difference was found in the fusion rates and pseudoarthrosis between the two groups in this study. All included studies had a minimum follow-up period of 1 year; however, the range of follow-up was very wide from 1 to 13 years, which could have led to a bias in the comparison of fusion and pseudoarthrosis rates. In a meta-analysis conducted by Teng et al. [36], 30 studies were included for comparing various lumbar interbody fusion techniques in degenerative disc disease and found no difference in fusion rates between ALIF, LLIF, PLIF, and TLIF.
Complications, such as transient sensorimotor weakness, were found significantly more in group L (24.3%) than in group P (5.6%). Transient thigh numbness was most commonly reported in group L, followed by transient hip flexor weakness. Hijji et al. [47], in a systematic review on complication rates of LLIF in 6,819 patients (63 articles), reported transient neurological weakness as the most common complication (36.07%), which is considered a result of trauma to the psoas muscle during the approach and is probably not related to direct nerve injury. Few complications were found to be approach-specific in our study. Postoperative thigh pain (7.7%), visceral injuries (2%), and retrograde ejaculation (3.7%) were seen only with the lateral approach. Gammal et al. [48], in a systematic review of 24 studies assessing thigh symptoms after LLIF, reported a high incidence of postoperative thigh or groin pains (9.2%–43%), attributable to psoas manipulation and edematous reaction. Proximity to abdominal viscera, peritoneum, and vessels makes complication rates of visceral and vascular injuries higher in lateral interbody fusion [49]. Injury to the sympathetic chain can lead to retrograde ejaculation as seen in one patient in a study by Katz et al. [23]. Complications, such as ASD (8.6%), were seen only in group P. Preservation of both anterior and posterior ligamentous structures in LLIF/OLIF has the theoretical advantage of better biomechanical stability with fewer ASD chances. However, the literature reported no consistent findings in substantiating that any of the LIF techniques is superior concerning ASD [50]. Moreover, relatively less duration of the follow-up period in these new lateral approach studies as compared to the traditional posterior approach could have led to underreporting of ASD in group L.
This study has a few limitations. Due to the lack of comparative studies or RCT, high heterogeneity was noted due to the difference in inclusion criteria of patients, surgeon’s expertise, and choice of surgical procedure across the selected studies. Only one study [17] in group L reported total operative time and blood loss while most studies [18,19,21,23,24] reported only lateral interbody fusion time and blood loss. Pelvic parameters were not reported in most of the selected studies; thus, analyses could not be done regarding the change in pelvic parameters postoperatively. L5–S1 interbody fusion is difficult from a lateral approach due to the over-riding of the iliac crest and vascular anatomy at this level; thus, ALIF or TLIF was performed when necessary at L5–S1 level in group L. The use of biologics as an adjunct for fusion could account for heterogeneity in the fusion outcomes. The comparison of complications revealed large differences in the percentage of complications between the two groups, CI of pooled data are very wide due to heterogeneity making the difference non-significant in the pooled analysis. Few studies were industry sponsored [17,18,32] while authors of few studies [19,23,28,29] were likely to receive benefits from a commercial party due to the use of interbody devices, which could account for funding bias in these studies.
Prospective comparative studies and RCTs with SRS-22, EQ5D, and SF-36 as PROM are required in the future for high-quality evidence. Additionally, the measurement of radiographic parameters should be uniform, preferably using an erect 91.44-cm anteroposterior and lateral X-ray of the whole spine with reporting of coronal, sagittal, and pelvic parameters.
Conclusions
Both posterior (PLIF/TLIF) and lateral (LLIF/XLIF/OLIF) lumbar interbody fusion procedures achieve similar functional and radiographic outcomes in patients with mild to moderate curves of ADS. Deformity correction from the lateral approach has an advantage in blood loss and LOHS over the Op-P subgroup. The MIS-P subgroup has less operative time than group L but with comparable blood loss and LOHS. No significant difference was found in the fusion rates, pseudoarthrosis, and complications between the two groups except for transient sensorimotor deficits. Few complications were found as approach-specific in each group.
Notes
Conflict of Interest
No potential conflict of interest relevant to this article was reported.
Author Contributions
Conception: SM, KA, BS, PK; data acquisition: SM, PVS, KA, SI, NG; data analysis: SM, PVS, KA, SI, GY, NG, VV, BS, PK; draft preparation: SM, SI, SS; interpretation of data: PVS, GY, VV; draft revision: GY, SS, NG; critical reviewing draft: BS, PK; and final approval of the manuscript: all authors.
Supplementary Materials
Supplementary materials can be available from https://doi.org/10.31616/asj.2022.0040.
Supplement 1.
Literature search strings.
Supplement 2.
National Institutes of Health quality assessment of included studies.