Change in Line of Sight after Corrective Surgery of Adult Spinal Deformity Patients: A 2-Year Follow-up
Article information

Abstract
Study Design
Cohort study.
Purpose
There is currently no published study that focuses on the spinal corrective surgery effects with cranial parameters in adult spinal deformity (ASD) patients. It is an important factor to measure since it plays a critical role in maintaining the line of sight. The objective is to determine the change in cranial parameters using the slope of McGregor’s line (McGS) after ASD surgery after 2 years of follow-up.
Overview of Literature
A study concluded that cervical spine alignment (C2–C7 lordosis) is strongly affected by thoracic kyphosis (TK). Another study showed that patients with ascending gaze had significantly more thoracolumbar malalignment.
Methods
This retrospective study includes 295 corrective surgery patients with ASD. Subjects were divided into two groups after propensity age matching analysis: cranial malalignment (McGS <−8 or >13) and normal cranial alignment (−8≤ McGS ≤13). Lumbar lordosis (LL), pelvic tilt (PT), TK, cervical lordosis (CL), and sagittal vertical axis (SVA) were evaluated between the two groups.
Results
SVA (95–56 mm) and PT (34°–25°) decreased and LL (19°–41°) increased 2 years after surgery (p<0.05), but McGS (−1.1° to −0.5°) and CL (21°–19°) did not change. Conversely, in the group with cranial malalignment, SVA (120–64 mm), PT (35°–26°), and LL (12°–41°) showed similar results to the normal cranial parameter group 2 years after surgery, but in contrast, McGS (−13° to −2°) and CL (24°–18°) improved significantly.
Conclusions
Severe ASD adversely affects to maintain horizontal gaze but can be improved by spinal corrective surgery.
Introduction
There is considerable research about adult spinal deformity (ASD), but still no published study that focuses on the line of sight (LOS) in patients with ASD exists. Multiple studies have examined the change of cervical parameters after spinal corrective surgeries but have not included cranial parameters in evaluating LOS [1–3]. Cranial parameters include the slope of McGregor’s line (McGS), the slope of the line of sight (SLS), and the chin-brow vertical angle (CBVA).
In addition, limited studies are focusing on the relationship of cranial parameters with health-related quality of life (HRQOL). Mostly, they concentrated on the HRQOL association with lumbar and pelvic parameters.
Cranial parameters measure the horizontal gaze, which is essential to determine since it can also be associated with patient-reported quality of life [4]. According to Lafage et al. [5], to maintain an erect position and to adapt to the surrounding environment, a visual and sensory input is required. Broca et al. [6] also stated that natural head position is an important factor to maintain stability, which is characterized by minimal energy expenditure and horizontal gaze.
The relationship between the CBVA, SLS, McGS, and Oswestry Disability Index (ODI) was evaluated in a previous study, in which the authors stated that correcting sagittal thoracolumbar alignment has a reversed effect on the craniocervical area [5]. Nevertheless, the population includes all patients with different spinal pathologies and was not limited to those who only have adult spinal deformities.
It is still beneficial to determine the pre- and postoperative correlation of cranial parameters with spinal radiographic parameters due to limited studies, since it may have a direct impact on an individual’s quality of life [4]. Thus, this study aimed to determine the change in cranial parameters after operative ASD patient intervention for a 2-year follow-up.
Materials and Methods
1. Institutional review board approval
This study protocol was approved by the Institutional Review Board of Hamamatsu University School of Medicine, Shizuoka, Japan (IRB no., 20-079).
2. Population
This is a single-center retrospective study that investigated a total of 389 patients with ASD who had corrective surgery from April 2010 to November 2017. Patients who are ≥18 years old with more than ≥2 years follow-up and with five or more fused vertebrae were included. Exclusion criteria include poorly taken radiographs, no whole spine radiographs, and patients who cannot tolerate standing radiographs. All patients gave informed consent.
3. Radiological assessment
Standard radiologic techniques were as follows: (1) standing position with hands placed on the clavicle and with a horizontal gaze as much as possible and (2) a distance of 1.5 m between the tube and the radiograph.
4. Measured parameters
Fig. 1 shows the measured radiographic parameters as follows: (1) pelvic tilt (PT), (2) pelvic incidence (PI), (3) lumbar lordosis (LL; the angle between the L1 and S1 superior endplates), (4) thoracic kyphosis (TK; the angle between the superior T5 and T12 inferior endplates), (5) cervical lordosis (CL; the angle between the inferior endplates of C2 and C7), (6) C7 sagittal vertical axis (SVA; the distance between a plumb line from the center of the C7 vertebral body and posterior superior corner of the sacrum), (7) C2–C7 SVA (the distance between a plumb line from the center of the C2 vertebral body and posterior superior corner of C7), (8) Cobb’s angle, and (9)McGS (the angle between McGregor’s line and a horizontal line; negative means that the head posture is in extension).

Measurement of slope of McGregor’s line. It is the angle formed by a line connecting the posterior part of the hard palate to the inferior part of the occipiral curve (McGregor’s line) and a horizontal line (negative means that the head posture is on extension).
5. Clinical evaluation
The ODI and Scoliosis Research Society-22 (SRS-22) were used to assess HRQOL. All patients were given a health survey preoperatively, at 1 year, and at 2 years postoperatively. A higher SRS-22 score and a lower ODI score are associated with an unsatisfactory state of health.
6. Definition of cranial malalignment group
The population was divided into two groups: cranial malalignment (M) (McGS: <−8° or >13°) and normal cranial alignment (N) (−8°≤ McGS ≤−13°). The normal McGS range was based on a previous study by Oe et al. [7], who determined the normal McGs value in the standing X-ray of 354 normal subjects with and without the use of a mirror for unifying LOS. They reported that the normal McGS value was 2.2°±10.9° among subjects without mirror placement.
7. Statistical analysis
IBM SPSS ver. 25.0 (IBM Corp., Armonk, NY, USA) was used for statistical analyses. Analysis of variance and Tukey’s test (for post hoc analysis) were used for multiple comparisons. The independent T-test was used to analyze the comparison between groups N and M. Multiple logistic regression analysis was used to determine the preoperative cranial malalignment risk factors. Spearman’s rank correlation coefficient analyzed the correlation of each parameter with McGS. A p<0.05 was considered statistically significant. Propensity score matching analysis was used for age adjustment.
Results
1. Demographic data
A total of 389 subjects from April 2010 until October 2017 who underwent corrective spinal surgeries were included. As shown in Fig. 2, 94 patients were excluded from this study. Among these subjects, 29 are dropouts, 29 had unclear radiographs, 30 had no whole spine X-rays, and six were mortalities during the study. The 295 subjects were divided into two groups, N and M, with 201 (85% females) and 94 (83% females). Levene’s test was used to compare the groups. As shown in Tables 1 and 2, the patients’ age in the N group (59 years old) were significantly younger than the M group (67 years old) (p=0.000). No significant differences were noted among other demographic data.
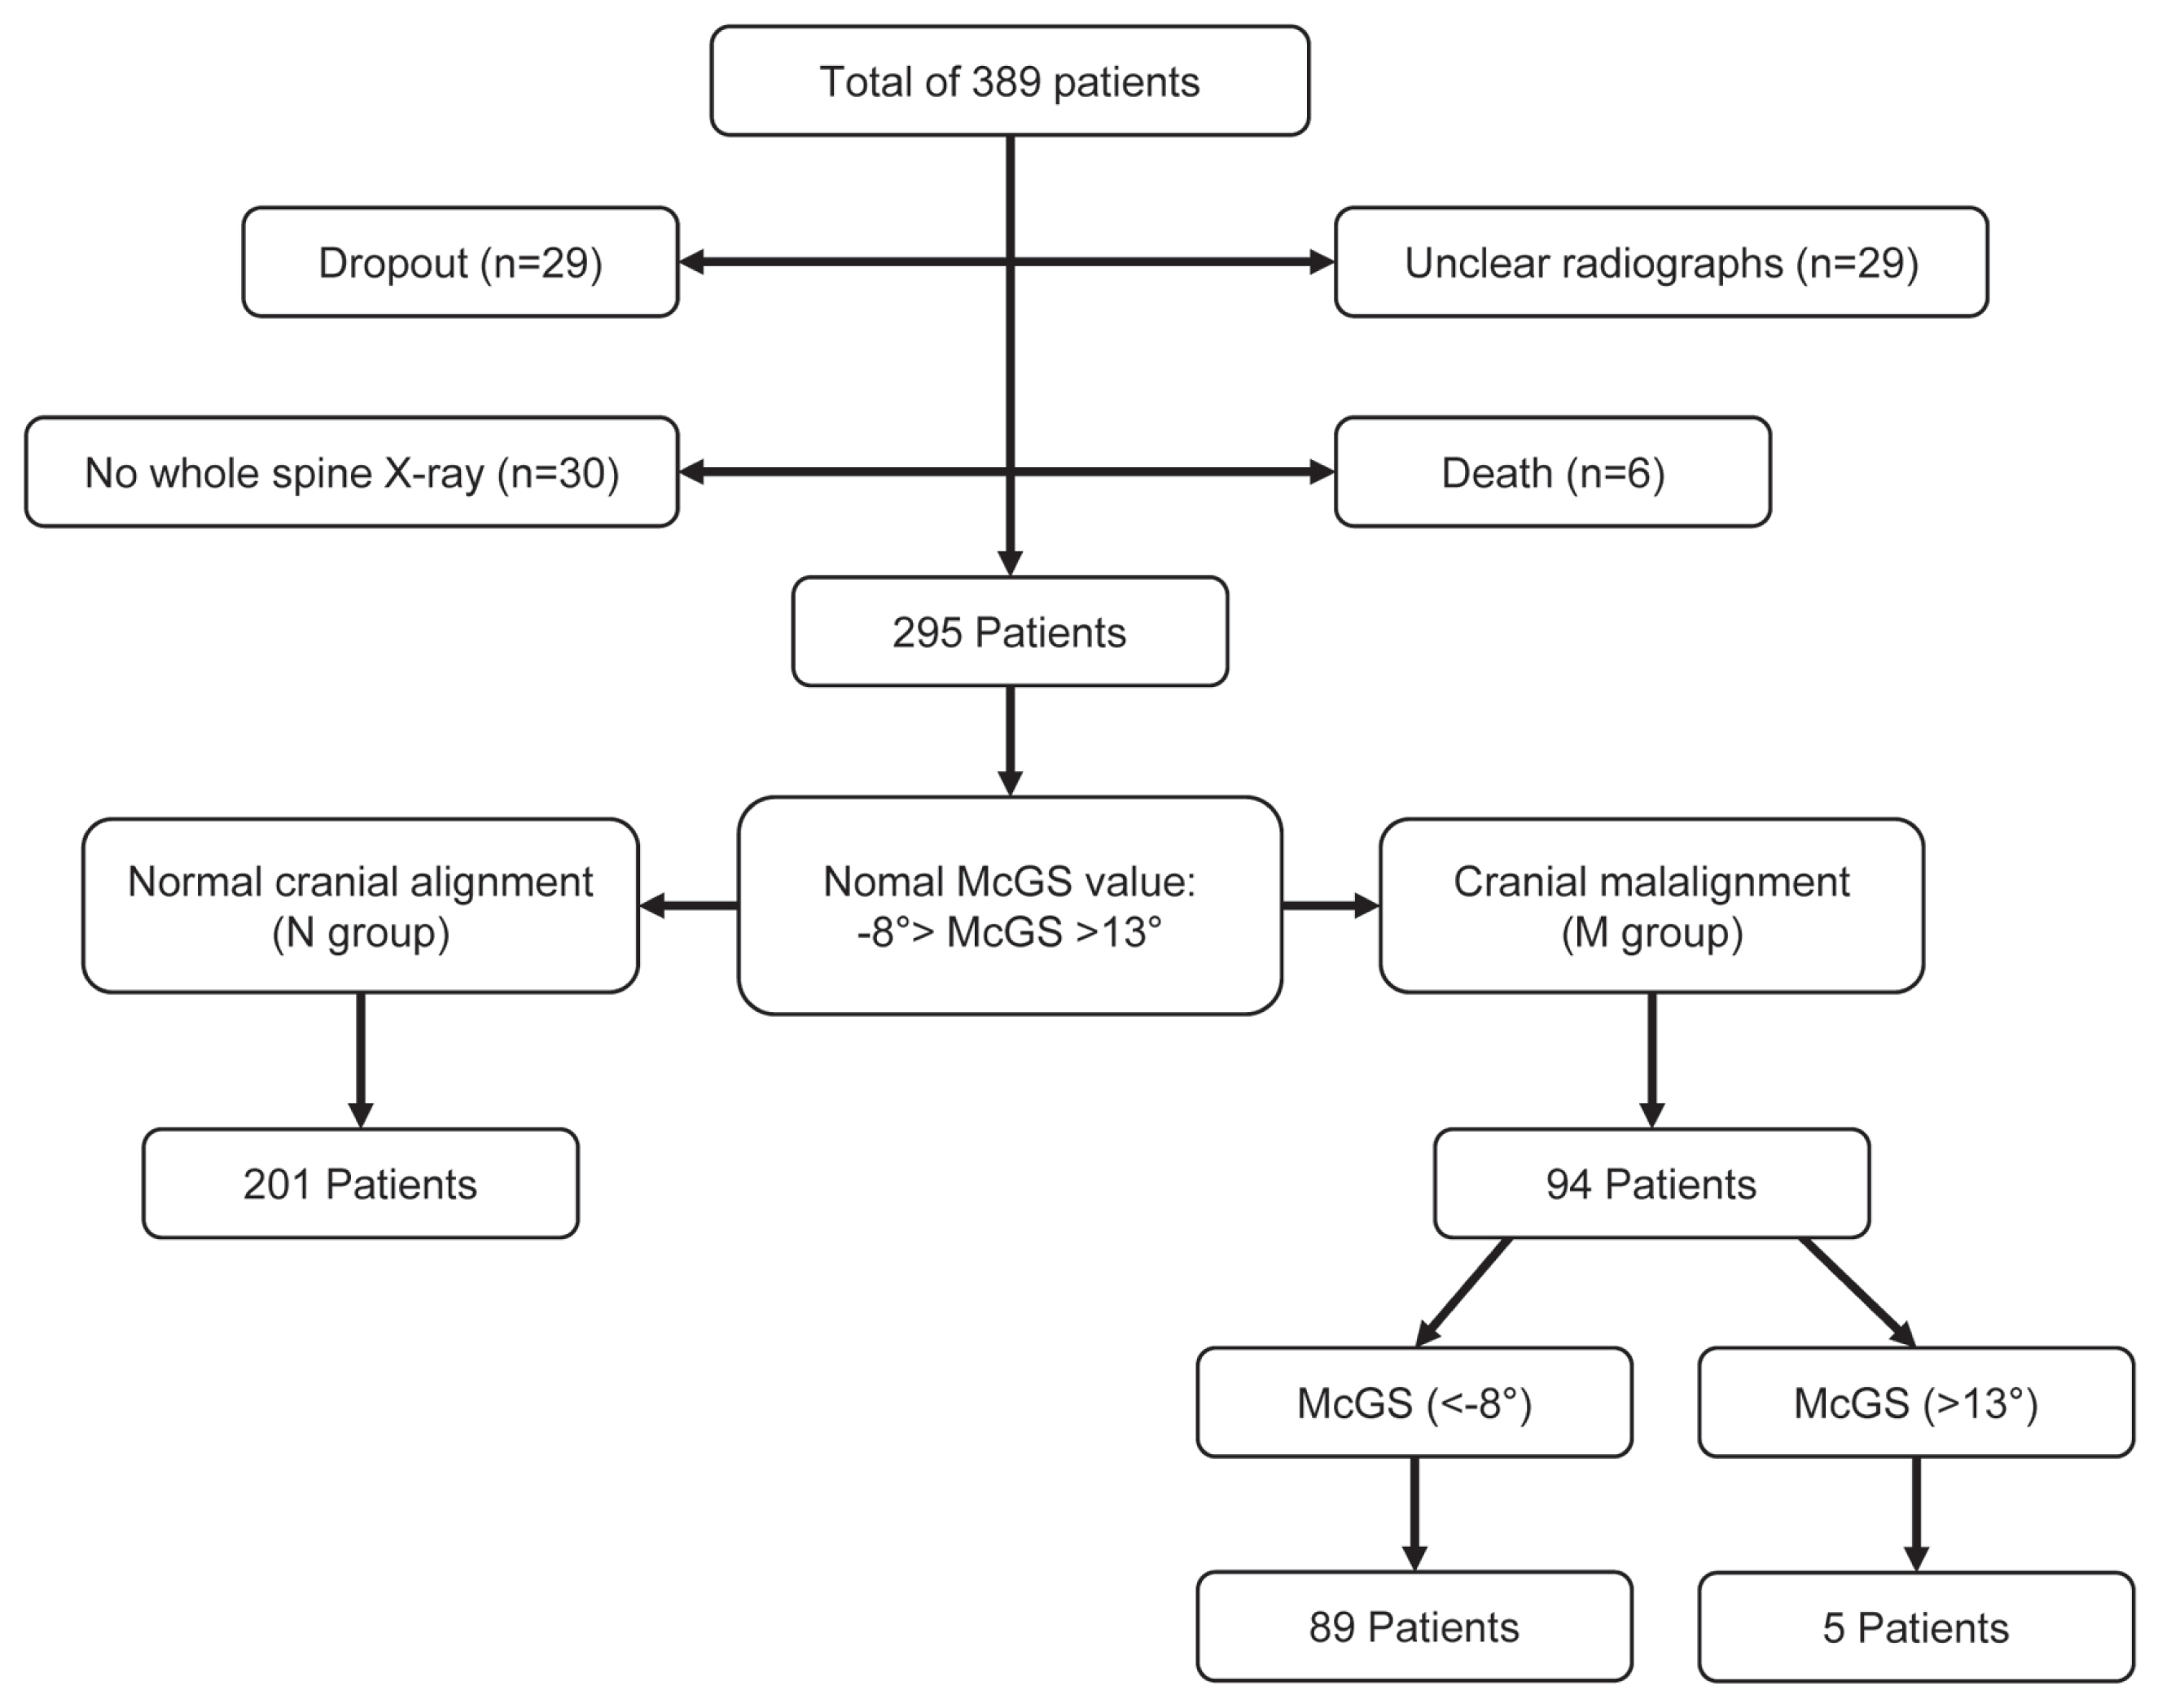
Flow chart of division of the population into normal cranial alignment and cranial malalignment group (hyperascending and hyperdesccending gaze). McGS, slope of McGregor’s line.

Demographic data by group

Radiographic change of spinal parameters and health-related quality of life at 2-year follow-up by group
2. Cranial parameters, spinal parameters, and HRQOL at 1 and 2 years after surgery
There was a significant increase found in the LL, TK, and TS, whereas the PT, CL, and SVA angle significantly decreased, among the spinopelvic parameters, after the surgery in both groups. The C2–C7 SVA significantly decreased only in the N group, contrary to the McGS (p=0.000) which significantly increased only in the M group. There was also a significant change in ODI and SRS-22 1 postoperatively in both groups (p=0.000).
There were significant differences preoperatively in PT, LL, TS, CL, McGS, SVA, Cobb, and SRS-22 (function). The McGS (−12.8°) and SVA (120 mm) in group M were significantly worse than in group N (McGS −1° and SVA 80 mm) (p=0.000).
3. McGS comparison with hyperascending versus hyperdescending gaze
The M group was divided into the hyperascending group (>13°) and the hyperdescending gaze (<−8°), with 89 (88% females) and five patients (60% females), respectively, as shown in Fig. 2. There was no significant difference between the two groups regarding demographic data (Tables 3, 4). There was a significant improvement in PT, LL, TK, CL, SVA, ODI, McGS, and SRS-22 in the hyperascending group after surgery. Among the parameters in the hyperdescending group, only the McGS had significant improvement 1 year postoperatively (p=0.046). A comparison of the two groups showed only McGS was significantly different among radiographic parameters (N: −14.7°, M: 18.8°) before surgery.
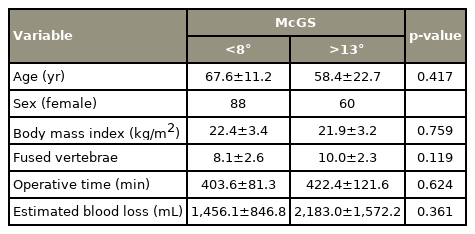
Comparison of cranial malalingment (McGS of <−8° vs. >13°): demographic data

Comparison of cranial malalingment (McGS of <−8° vs. >13°): radiographic data
4. Demographic data after propensity score matching analysis
Alignment deterioration is greatly affected by age. As shown in Tables 1 and 2, the age in group M was significantly older than in group N. Therefore, a propensity score matching analysis was performed to exclude the influence of age in the alignment (Fig. 3). There was no significant difference observed in age, sex, height, weight, body mass index (BMI), number of fused vertebrae, operative time, and estimated blood loss (Tables 5, 6).
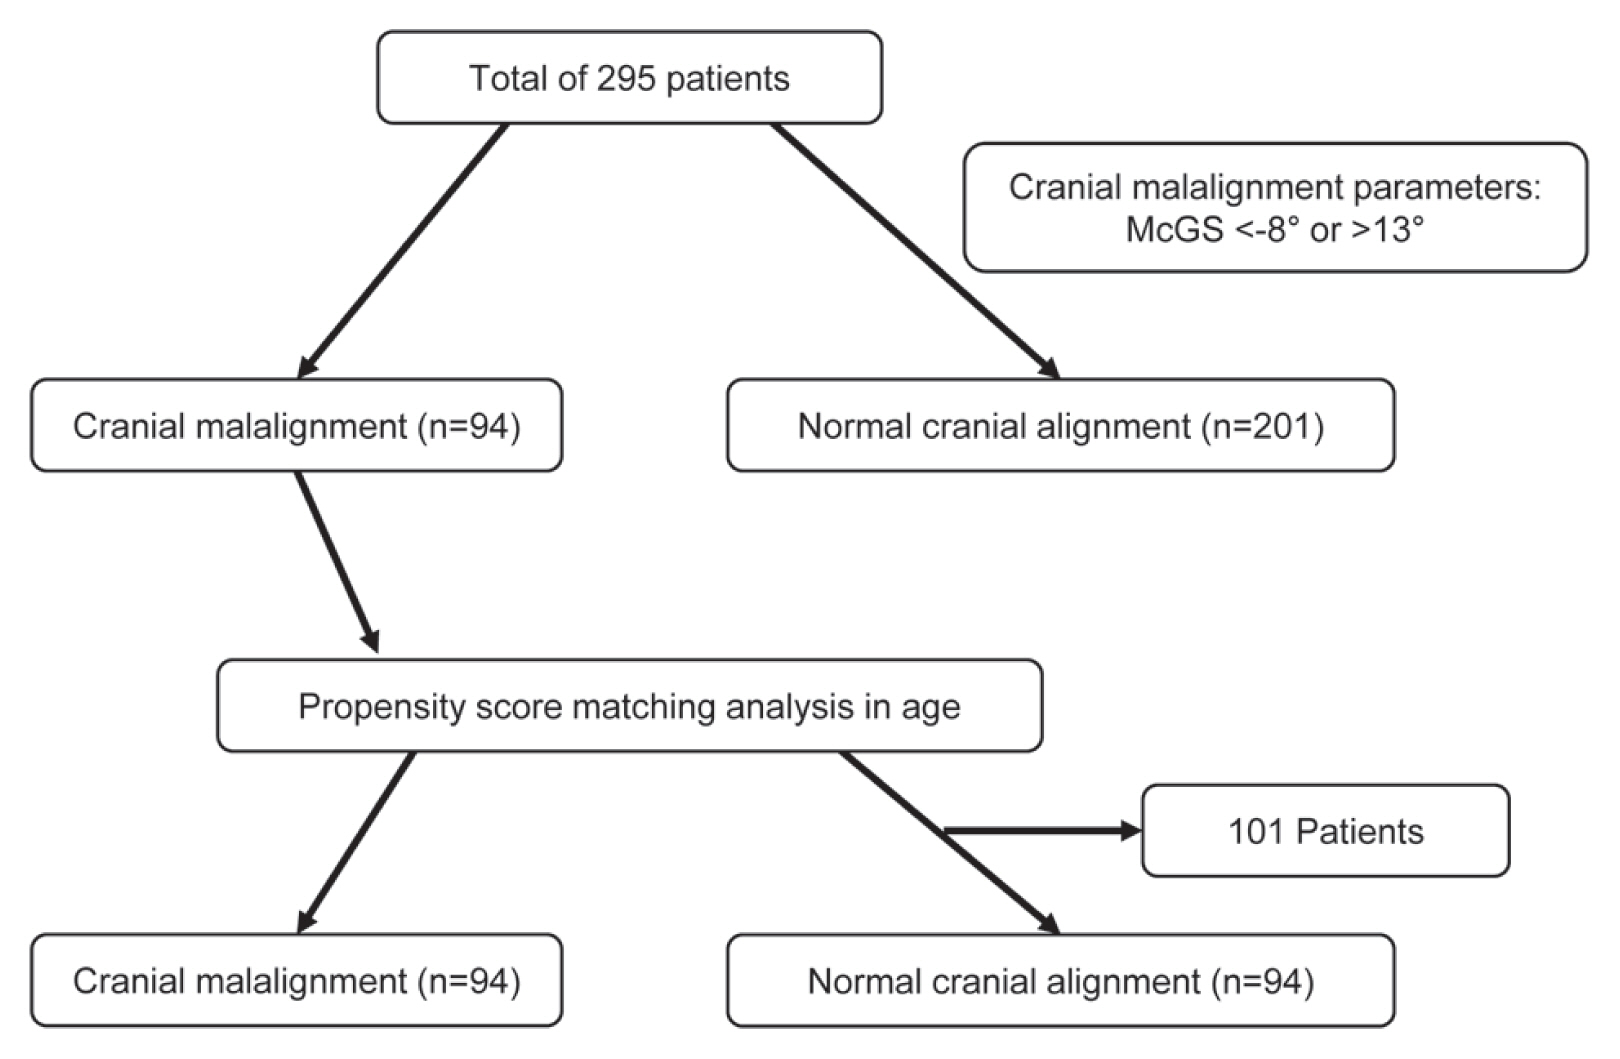
Flow chart of the division of the population into cranial malalignment and normal cranial alignment after propensity score matching analysis. McGS, slope of McGregor’s line.
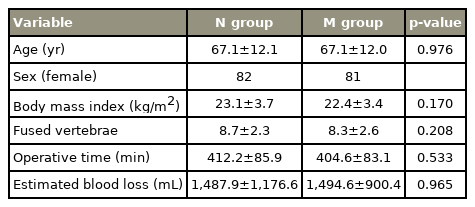
Demographic data and radiographic change of spinal parameters and health-related quality of life at 1 year and 2 years postoperative corrective spinal surgery (post-propensity score matching analysis)

Radiographic change of spinal parameters and health-related quality of life at 1 year and 2 years postoperative corrective spinal surgery (post-propensity score matching analysis)
5. Preoperative, 1 year postoperative, and 2 years postoperative comparison of spinal radiographic parameters of patients with cranial malalignment versus normal cranial parameters
Both groups had a significant increase in LL and TK, whereas a significant decrease was noted in PT, SVA, and Cobb angle after surgery. CL (24.1°–16.5°, p=0.013), TS (35.1°–29.1°, p=0.019), and McGS (−12.9° to −4.4°, p=0.000) significantly decreased after surgery only in the M group. No significant differences were noticed in PI and C2–C7 SVA. All of the domains of SRS-22 (pain, self-image, mental health, satisfaction, and total) and ODI significantly changed postoperatively toward improvement (p=0.000).
All of the parameters did not give any significant difference if 1 and 2 years postoperative measurements were compared. McGS (−12.9°) and SVA (120 mm) in group M were significantly worse than in group N (McGS −1.1° and SVA 94.7 mm) upon determining the two groups’ differences before surgery. No significant difference was noted upon comparing the HRQOL between the two groups.
6. Coefficient correlation of McGS with spinal parameters
Table 7 shows the comparison of the coefficient correlation of demographics and spinal radiologic parameters with McGS. We noted that McGS has no significant correlation with age and BMI. Only the LL was observed (r=0.208) to have a mild positive correlation with McGS, whereas CL (r=−0.260) has a mild negative correlation with McGS. PT, PI, TK, TS, and SVA showed no significant correlation.

Coefficient correlation of slope of McGregor’s line with demographics and other spinopelvic parameter
7. Coefficient McGS correlation with spinal parameters
The coefficient McGS correlation was preoperatively compared with the SRS-22 and ODI, 1 and 2 years postoperatively. The resulting p-value exceeds the level of significance of 0.05. This suggests that no significant correlation exists between McGs and ODI (across preoperative, after 1 year, and after 2 years). Similarly, no significant correlation exists between McGs and SRS-22, in terms of preoperative, after 1 year, and after 2 years (Table 8).

Coefficient correlation of McGS with clinical outcomes
8. Preoperative cranial malalignment risk factors
Multiple logistic regression analysis was used to assess preoperative risk factors in radiographic parameters for M. The dependent variable was defined as the presence of cranial malalignment. PT, LL, TK, TS, CL, and SVA were the independent variables. Consequently, CL (odds ratio [OR], 1.017; 95% confidence interval [CI], 1.002–1.033; p=0.024) and SVA (OR, 1.004; 95% CI, 1.001–1.008; p=0.020) were identified as the preoperative risk factors.
9. Representative cases
Fig. 4A shows lateral whole spine standing radiographs of a 76-year-old female patient with hyperascending gaze. LL, TK, SS, PT, SVA, C2–7 CL, and McGS, which were the preoperative measurements, were 14°, 5°, 14°, 37°, 111 mm, 9°, and −17°, respectively. LL, TK, SS, PT, SVA, C2–7 CL, and McGS were 33°, 24°, 23°, 17°, −17 mm, −19°, and 2°, respectively, after 1 year of surgery. There were noted significant improvements in McGS and SVA after 1 year of surgery. It shows lateral whole spine standing radiographs of a 63-year-old female patient with hyperdescending gaze in Fig. 4B. LL, TK, SS, PT, SVA, C2–7 CL, and McGS, which were the preoperative measurements, were 27°, 20°, 32°, 31°, 154 mm, 48°, and 35°, respectively. LL, TK, SS, PT, SVA, C2–7 CL, and McGS, which were the measurements after 7 years of surgery, were 58°, 38°, 43°, 23°, 0 mm, 19°, and 1°, respectively. There were also noted significant improvements in McGS and SVA after 7 years of surgery.

(A) Representative case of a 76-year-old female patient with hyper ascending gaze preoperatively. There was significant improvement noted in the slope of McGregor’s line (McGS; −17° to 2°) and sagittal vertical axis (SVA; 111 to −17 mm) after 1 year of surgery. (B) Representative case of a 63-year-old female patient with hyper descending gaze preoperatively. There was significant improvement noted in McGS (35° to 1°) and SVA (154 to 0 mm) after 7 years of surgery.
Discussion
Currently, there is no study in the literature review that will support that spinal corrective surgery will affect the cranial parameters or horizontal gaze. Thus, we studied 295 patients with ASD from April 2010 to November 2017 to prove if there will be significant changes after corrective surgery. McGS was found to increase significantly from −12.8°±9.6° to −4.4°±10.2° at 1 year and −2.1°±9.9° at 2 years in the M group, as shown in Tables 1 and 2. We noticed that after surgery, the patient’s LOS increased to close or to within the normal value of McGS, whereas the CL angle decreased. CL is increased in an attempt to maintain a horizontal gaze due to an anterior tilt of the trunk in patients with ASD. This CL postoperative improvement is due to the anterior trunk inclination correction and to the decrease of compensatory changes in the cervical spine. In comparison, Aykac et al. [1] in their previous journal also concluded that cervical spine alignment (C2–C7 lordosis) is strongly affected by TK. Lafage et al. [5] also found out that patients with ascending gaze had significantly more thoracolumbar malalignment (lower LL, higher T1-pelvic angle, and larger PT), which can be associated with our result since McGS has a positive correlation with LL but no significant correlation seen with PT. It was also previously mentioned that the flattening of the spine gives the first effect to the chain of compensation [8–10].
A subanalysis of the M group was also performed to check significant factors between hyperascending versus hyperdescending gaze (Tables 3, 4). This analysis examined whether there were significant differences in patient demographics and alignments aside from McGS, but none were found. Nevertheless, the data are difficult to analyze for the hyperdescending group because it is limited only to five patients.
The subanalysis results in Tables 5 and 6 exclude the effect of age. McGS in group M was successfully improved by surgery similar to the results in Tables 1 and 2. The interesting part of this research is that when we analyzed the differences between the two groups, SVA in group M was significantly higher than in group N. Moreover, we found out that among the independent variables (PT, LL, TK, TS, CL, and SVA), only CL and SVA were identified as preoperative risk factors for cranial malalignment after using multiple logistic regression analysis. It was suggested that corrective surgery could improve LOS and severe ASD has an impact on McGS based on these results.
In Table 7, McGS was compared with the demographic data and spino-pelvic parameters. CL was observed to have a significant negative correlation with McGS, which means that the higher the value of CL, the lower the value of McGS will be. In previous studies, they stated that CL is greatly affected by TK and LL [11–13]. Patients with hyper TK deformity have a tendency to extend their neck to maintain LOS, thereby increasing the CL angle.
A lot of studies were made that state that spinal sagittal malalignment causes poor HRQOL [7,14–18]. A study correlated cranial parameters with HRQOL but only included the CBVA. According to a previous study by Broca [6], CBVA values of −4.8° and +17.7° were concluded to place a patient into a reasonable threshold of disability. The M and N had the same outcome in ODI and SRS-22 in this present study, where patients had significant improvement at 1 year and 2 years postoperatively. We were not able to analyze McGS with HRQOL since it will not give a specific correlation.
This study also has its limitations: (1) Only ODI and SRS-22 were the tools used in evaluating the HRQOL. The cervical spine is usually stressed secondary to hyperextension of the head to maintain a horizontal gaze in patients with ASD. Hence, it might be suitable to include Neck Disability Index (NDI) to specifically evaluate the outcome of the cervical area [19,20]. (2) We were not able to include SLS and CBVA since landmarks were not visualized in the majority of the X-rays. The result would be stronger if SLS and CBVA will be included even if McGS was proven to be a surrogate measurement of horizontal gaze [4,5]. (3) It will be a good recommendation for future studies to also include patients with cervical spondylosis, since this may also play a big role in cranial parameter change. There was also no noted significant difference between McGs and clinical outcomes such as SRS-22 and ODI (Table 8). Nevertheless, neck symptoms are still affected by McGs but can be evaluated using NDI, which should be included in future studies. This study showed that LOS can be improved as a result of spinal deformity surgery. This is due to the improvement of cervical spine parameters along with the improvement of lumbar pelvic parameters. Hence, it may be difficult to improve McGregor’s line in patients with poor cervical spine mobility; preoperative cervical spine mobility evaluation is necessary to improve McGregor’s line. Therefore, cervical spine mobility is recommended to be included in future studies. Moreover, the 5 year time of time evaluating patients included in this study may cause bias because of the influence of several factors, such as different types of surgical procedures and other diseases that patients might be exposed to.
In conclusion, ASD greatly impacts horizontal gaze. LOS is dependent on CL and SVA, which are also affected by thoracolumbar deformities. Furthermore, correction surgery can improve horizontal gaze impairment. A cranial parameter is also an important factor to check the severity of spinal deformities. There was also no significant correlation found between McGS and HRQOL because all the subjects in the M group had improved postoperatively.
Notes
Conflict of Interest
Yu Yamato and Shin Oe belong to a donated fund laboratory called the Division of Geriatric Musculoskeletal Health. Except for that, no potential conflict of interest relevant to this article was reported.
Funding
Sources of funding are as follows: Medtronic Sofamor Danek Inc., Japan Medical Dynamic Marketing Inc., and Meitoku Medical Institution Jyuzen Memorial Hospital.
Author Contributions
Conceptualization: SO and KM; data curation: SO and KM; formal analysis: SO and KM; funding acquisition: all authors; methodology: SO and KM; project administration: KM and SO; visualization: SO and KM; writing–original draft: KM and SO; writing–review & editing: KM and SO; and final approval of the manuscript: all authors.