Modified Frailty Index as a Predictor of Postoperative Complications and Patient-Reported Outcomes after Posterior Cervical Decompression and Fusion
Article information

Abstract
Study Design
A retrospective cohort study.
Purpose
To determine whether the 11-item modified frailty index (mFI) is associated with readmission rates, complication rates, revision rates, or differences in patient-reported outcome measures (PROMs) for patients undergoing posterior cervical decompression and fusion (PCDF).
Overview of Literature
mFI incorporates preexisting medical comorbidities and dependency status to determine physiological reserve. Based on previous literature, it may be used as a predictive tool for identifying postoperative clinical and surgical outcomes.
Methods
Patients undergoing elective PCDF at our urban academic medical center from 2014 to 2020 were included. Patients were categorized by mFI scores (0–0.08, 0.09–0.17, 0.18–0.26, and ≥0.27). Univariate statistics compared demographics, comorbidities, and clinical/surgical outcomes. Multiple linear regression analysis evaluated the magnitude of improvement in PROMs at 1 year.
Results
A total of 165 patients were included and grouped by mFI scores: 0 (n=36), 0.09 (n=62), 0.18 (n=42), and ≥0.27 (n=30). The severe frailty group (mFI ≥0.27) was significantly more likely to be diabetic (p<0.001) and have a greater Elixhauser comorbidity index (p=0.001). They also had worse baseline Physical Component Score-12 (PCS-12) (p=0.011) and modified Japanese Orthopaedic Association (mJOA) (p=0.012) scores and worse 1-year postoperative PCS-12 (p=0.008) and mJOA (p=0.001) scores. On regression analysis, an mFI score of 0.18 was an independent predictor of greater improvement in ΔVisual Analog Scale neck (β= −2.26, p=0.022) and ΔVAS arm (β= −1.76, p=0.042). Regardless of frailty status, patients had similar 90-day readmission rates (p=0.752), complication rates (p=0.223), and revision rates (p=0.814), but patients with severe frailty were more likely to have longer hospital length of stay (p=0.006) and require non-home discharge (p<0.001).
Conclusions
Similar improvements across most PROMs can be expected irrespective of the frailty status of patients undergoing PCDF. Complication rates, 90-day readmission rates, and revision rates are not significantly different when stratified by frailty status. However, patients with severe frailty are more likely to have longer hospital stays and require non-home discharge.
Introduction
Posterior cervical decompression and fusions (PCDF) have been steadily increasing over the past 2 decades owing to the growth of the aging population, and the most recent data indicated an approximately 20% increase in surgical volume from 2020 to 2040 [1,2]. This trend is anticipated to predominantly affect patients aged >75 years, highlighting an increase in the demand for surgical and healthcare resources for older people [2]. Although PCDFs are effective in halting myelopathy progression and relieving neurological compression, surgical complications may be a significant source of morbidity [3]. To predict postoperative adverse events, scoring systems and novel predictive indices have become popular in the preoperative clinical setting [4,5]. The notion of frailty, as a metric, was first implemented as a comprehensive measure of a patient’s physiologic state, independent from chronologic age, and has been proven predictive of adverse perioperative and postoperative outcomes across multiple subspecialties [6,7].
In the field of spine surgery, various iterations of frailty, specifically the modified frailty index (mFI), have been effective tools for predicting postoperative adverse surgical events, morbidity, and mortality [8–11]. However, most of these studies have primarily examined patients undergoing anterior cervical or thoracolumbar procedures. Moreover, no studies have assessed the prognostic value of the 11-item mFI in patients undergoing PCDFs in regard to adverse outcomes or patient-reported outcome measures (PROMs). Given the contemporary push for prognostic data to stratify preoperative risk, mFI may be an important tool in identifying PCDF outcomes. Therefore, this study aimed to evaluate the association of the preoperative 11-item mFI with postoperative surgical and clinical outcomes in patients undergoing PCDF.
Materials and Methods
1. Patient selection and data collection
After the approval by the institutional review board, a structured query language (SQL) search was used to identify patients aged >18 years who underwent a 1- to 12-level PCDF with or without extension into the thoracic spine at an urban, academic medical center between 2014 and 2020. The following Current Procedural Terminology codes were utilized: 22590, 22595, 22600, 22614, 22840, 22842, 22843, and 22844. Patients were excluded from the study if they lacked preoperative or postoperative 1-year PROM measures, had a prior anterior cervical discectomy and fusion (ACDF), or received surgical intervention for any malignant tumors, infections, trauma, or revision at the index level. Of the 1,573 patients undergoing PCDF, 165 patients were included in the final analysis (Fig. 1).
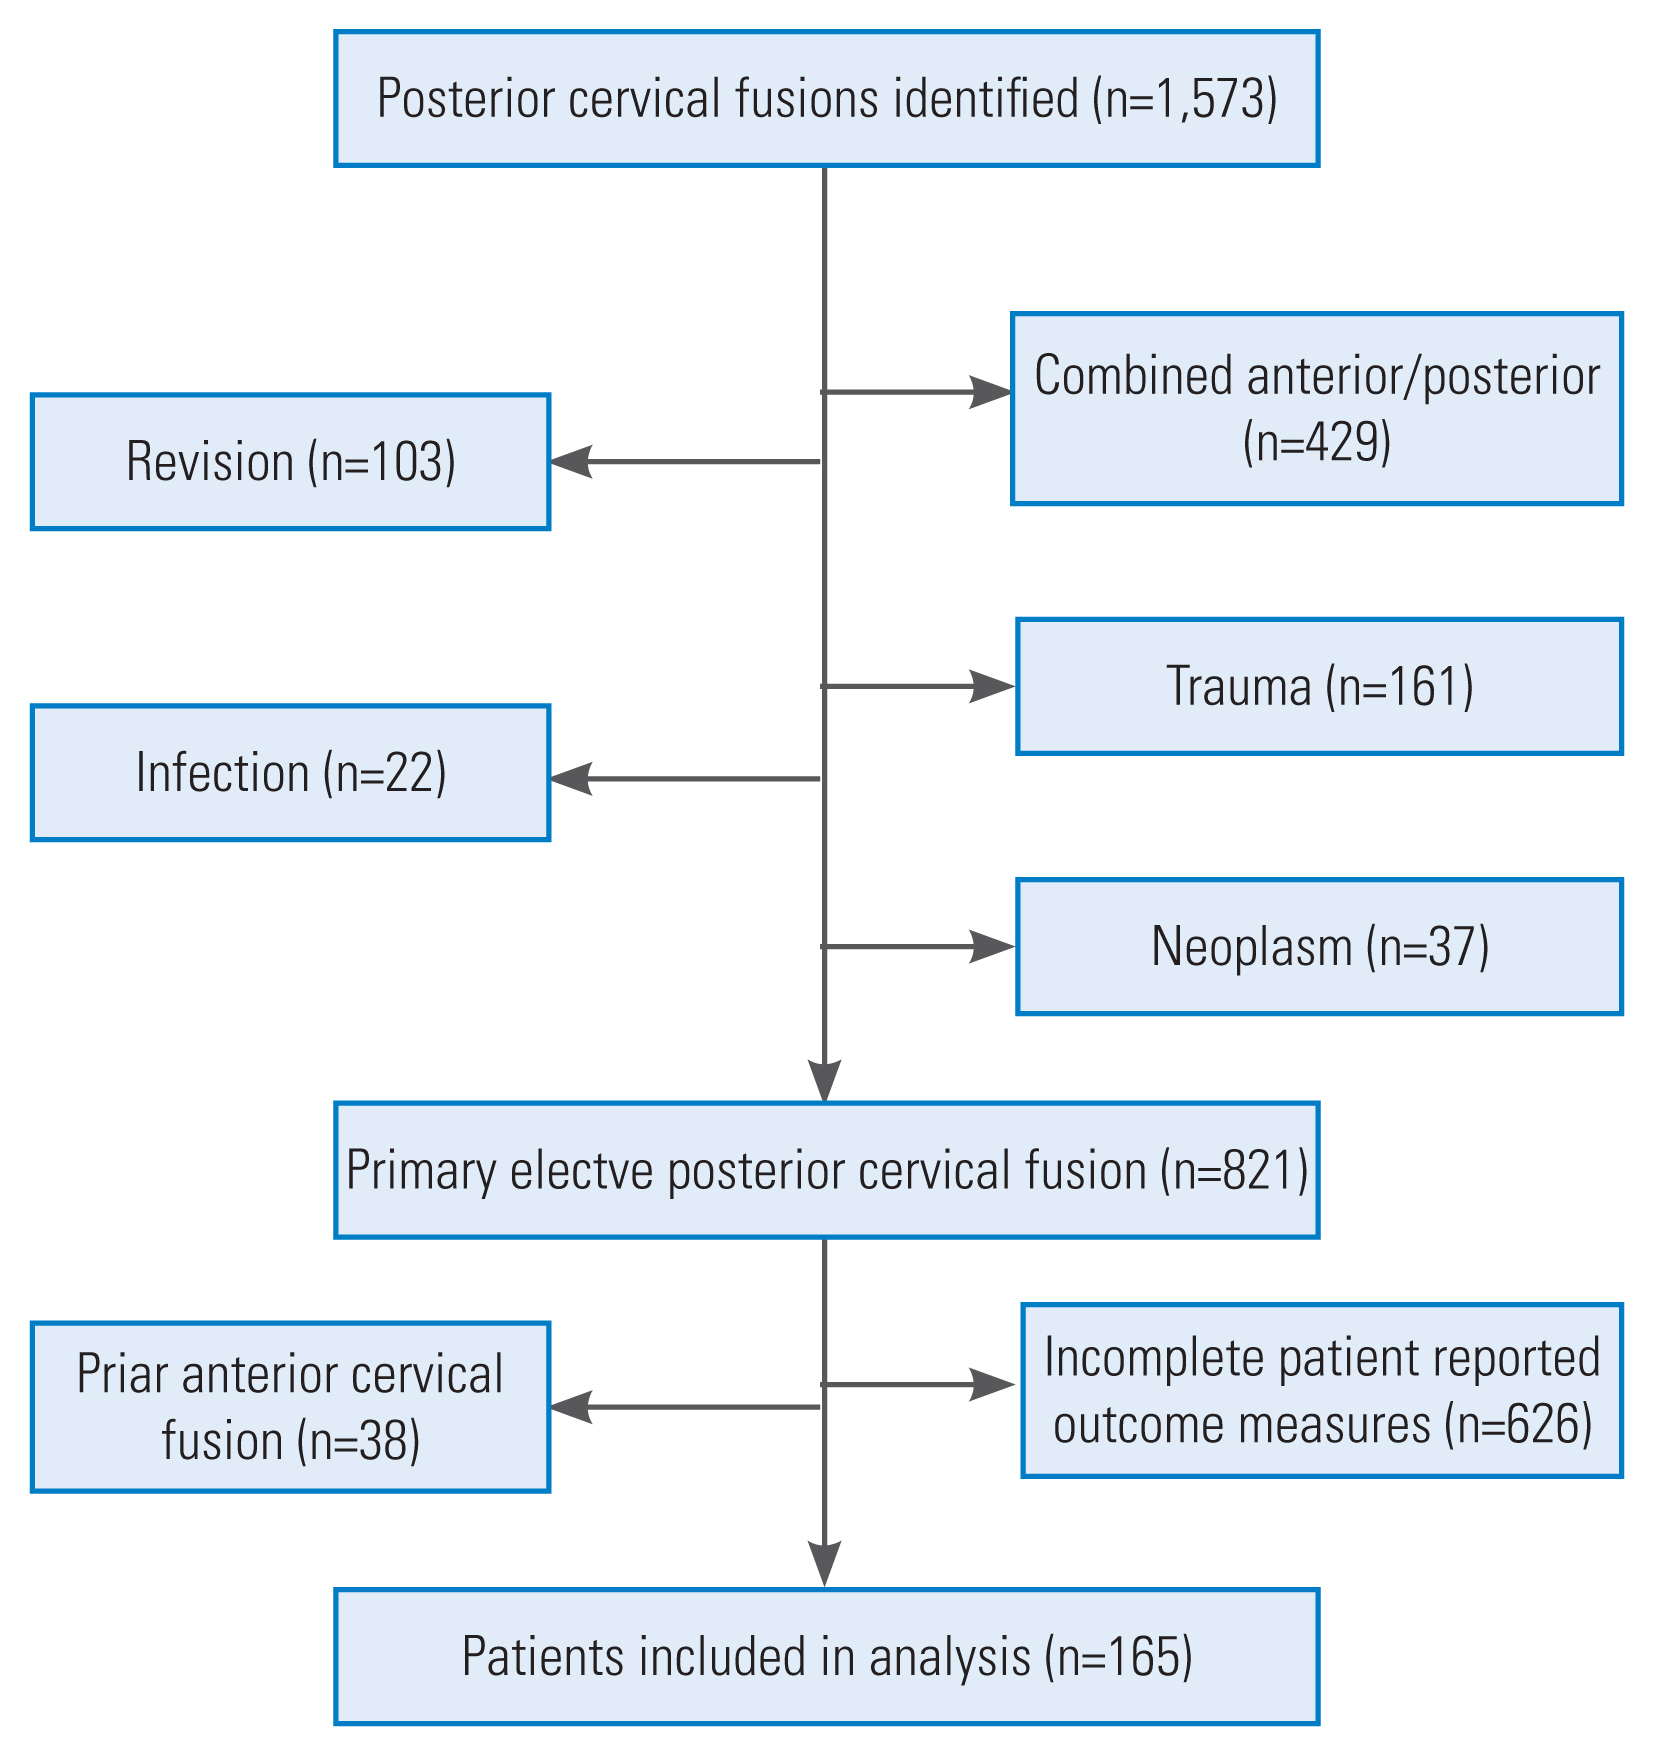
Flow chart depicting the number of patients who were included and excluded.
Patient demographics, including age, sex, body mass index (BMI), smoking status (never, former, and current smoker), Elixhauser comorbidity index, primary preoperative diagnosis, number of levels fused, symptom duration (<6 months, 6 months to 2 years, >2 years), and follow-up were collected via chart review. PROMs were collected using a SQL search of our institution’s prospectively maintained outcomes database (OBERD, Columbia, MO USA), which included the 12-item Short Form Health Survey (SF-12) Physical Component Score (PCS-12), Mental Component Score (MCS-12), Neck Disability Index (NDI), Visual Analog Scale neck (VAS neck) and arm (VAS arm), and the modified Japanese Orthopaedic Association (mJOA) score.
2. Modified frailty index
The mFI was developed using 11 variables matched from easily identified patient characteristics and data from the Canadian Study of Health and Aging Frailty Index and the American College of Surgeons National Surgical Quality Improvement Program (ACS NSQIP) dataset [12]. The presence of each variable represents 1 point, and the total points are divided by 11 to calculate the patient’s mFI score ranging from 0–1.0. An increase in the mFI score indicates an increase in frailty. The 11 variables were as follows: (1) non-independent functional status; (2) history of diabetes mellitus; (3) history of chronic obstructive pulmonary disease; (4) history of congestive cardiac failure; (5) history of myocardial infarction; (6) history of percutaneous coronary intervention, cardiac surgery, or angina; (7) history of hypertension requiring medication; (8) history of peripheral vascular disease; (9) history of impaired sensorium; (10) history of transient ischemic attack or cerebrovascular accident without deficit; and (11) cerebrovascular accident with deficit. The mFI score was calculated as n/11 (where n is the positive number of the 11 variables identified). Patients were stratified by mFI scores in a stepwise increasing manner (not frail, 0–0.08; mild, 0.09–0.17; moderate, 0.18–0.26; severe, >0.27) as previously described in the literature [3,13]. The groups were defined as none, mild, moderate, and severe frailty.
3. Statistical analysis
Descriptive statistics were used to represent patient demographics and outcome measures and are represented as mean±standard deviation. Continuous variables were assessed using either an analysis of variance or Kruskal-Wallis test for parametric and non-parametric data, respectively. All categorical variables were compared using a chi-square or Fisher’s exact test depending on cell count. A logistic regression model was developed using baseline demographics (age, sex, and BMI), number of levels operated, preoperative diagnoses, and mFI scores as independent variables to determine any potential predictors for changes in outcome measures. The magnitude of improvement in each PROM was defined as Δ (postoperative scores minus preoperative scores). The following threshold values were used to determine the proportion of patients meeting the minimal clinically important difference: PCS-12, 11.1 points; MCS-12, 9.7 points; NDI, 8.5 points; VAS neck, 1.2 points; VAS arm, 1.3 points; and mJOA, 1.8 points [14,15]. Multiple linear regression analysis was then conducted for each ΔPROM adjusting for age, sex, BMI, and mFI score. R Studio ver. 4.0.2 (RStudio, Boston, MA, USA) was used in the statistical analysis. A p-value of less than 0.05 was considered significant.
4. Ethical board review statement
This study was approved by the Institutional Review Board at the Thomas Jefferson University Hospital (Control #19D.508). Each author certifies that his or her institution approved the human protocol for this investigation and that all investigations were conducted in conformity with the ethical principles of research. Informed consent was obtained from all individual participants included in the study.
Results
1. Patient demographics and surgical characteristics
A total of 165 patients were included in the final cohort with the following mFI groupings: not fail (n=35), mild (n=62), moderate (n=42), and severe (n=29) frailty. Patients in the severe frailty group were more likely to be diabetic (severe: 62.1%, p<0.001) and have a greater Elixhauser score (severe: 2.44±1.54, p<0.001). No significant differences were found in age (p=0.763), sex (p=0.685), BMI (p=0.233) smoking status (p=0.714), levels fused (p=0.545), or symptom duration (p=0.398) (Table 1). The severe frailty group experienced the longest hospital length of stay (3.68±1.48 days, p=0.006) and were discharged home least frequently (57.9%, p<0.001) (Table 1).

Demographics and postoperative course as categorized by the mFI
2. Patient-reported outcome measures
At baseline, the severe frailty group had worse baseline PCS-12 (28.9±8.37, p=0.011) and mJOA scores (12.8±2.97, p=0.012). They also had worse 1-year postoperative PCS-12 (31.4±8.64, p=0.008), NDI (41.5±24.6, p=0.049), and mJOA scores (12.1±2.06, p=0.001) (Table 2). On regression analysis, moderate frailty was an independent predictor of significant improvement in VAS neck (β=−2.26, p=0.022) and ΔVAS arm (β=−1.76, p=0.042) (Table 3).

Patient reported outcomes stratified by modified frailty status in a population of patients undergoing posterior cervical decompression and fusion

Linear regression analysis for the magnitude of improvement in patient-reported outcome measures
3. 90-Day readmissions, surgical complications, and revisions
No significant increase was found in complications as frailty increased from 0 to >0.27 (p=0.223). Only seven patients experienced perioperative complications. For patients who experienced postoperative complications with an mFI of 0.09–0.17, two had new-onset conduction arrhythmias, and two had malignant hypertension. For patients with an mFI of 0.18–0.26, two had altered mental status that prolonged hospitalization but did not require a higher level of care, and one had a wound complication. A total of two patients underwent revision surgery for broken hardware, and 10 patients had 90-day hospital readmissions, with five having surgical site infections requiring an irrigation and debridement, three experiencing reoccurrence/worsening of symptoms (not requiring additional surgery), one having partial wound dehiscence, and one presenting with venous thromboembolism. Overall, no significant differences were found in the 90-day readmission rates (p=0.735) or revision surgeries (p=0.819) between groups (Table 4).

90-Day readmissions, complications, and revisions as categorized by the mFI
Discussion
Risk stratification and/or predictive modeling are potential tools to mitigate adverse outcomes in vulnerable populations. This is especially important given the recent increases in the rates of posterior cervical fusions performed in older patients [1,2]. May studies have stated that mFI may be one such tool capable of predicting the likelihood of adverse outcomes of spine surgery [11–14]. The need for such a tool is magnified by the expected greater rate of postoperative complications and less frequent home discharge when comparing PCDFs to anterior cervical procedures [16–18]. Although PCDFs are often more invasive due to the greater associated soft tissue trauma, only a few studies have compared clinical and surgical outcomes based on a patient’s baseline frailty status. The results of our study suggest that patients with severe frailty have worse baseline and 1-year postoperative PCS-12 and mJOA scores, but they have similar magnitudes of improvement across all clinical outcomes when compared with less frail ones. While patients with severe frailty had greater rates of non-home discharge, no difference was found the in 90-day hospital readmissions, surgical complications, or revision surgeries based on baseline frailty.
A previous study evaluating the 5-item mFI in patients undergoing ACDF found that higher mFI scores correlated with a significantly longer hospital stay, greater non-home discharge rates, and more unplanned readmissions [19]. Similar to our study, patients with greater baseline frailty were more commonly discharged to higher acuity centers (skilled nursing facilities or acute rehabilitation facilities) [17]. In this study, patients had an overall 4.24% rate for adverse events with no significant increase in complications between groups as frailty increased from 0 to ≥0.27. Data from the NSQIP database identified Clavien–Dindo grade IV complications—as defined by a life-threatening complication requiring intensive care unit management—to be 4.67 times more likely after an ACDF in patients with baseline frailty of >0.27 and >40 times more likely in posterior cervical fusions with a baseline patient frailty >0.36 [3]. The disparity in results between the above study and our outcomes (the majority of complications in our cohort were from the mild or moderate frailty groups) may be due to the larger sample size available within the NSQIP dataset. Even so, the NSQIP database only had 817 patients who underwent posterior cervical fusion during the 7-year study period.
A recent systematic review reported complication rates of approximately 9.0% of patients undergoing PCDF [20]. This is comparable to our 4.24% complication rate and provides some external validity to our findings. However, wide variability in complication rates for PCDF should be expected, as older patients with varying levels of fusion and with different frailty status can result in disparate complication rates between studies [17]. Future research should attempt to expand our results to uncover whether patients with severe frailty are at greater risk for surgical complications, especially life-threatening ones, since none of the patients in our cohort required intensive care unit transfers postoperatively.
Our 90-day readmission rate was 6.1%, and surgical site infections and neurologic symptom worsening were the most common cause of readmission. These results are in concordance with a nationwide database study, which found 30-day readmission rates of 6.20% in patients undergoing posterior cervical fusion. Similar to our study, infection was the most common reason for readmission [21]. In a different nationwide database study, the 90-day readmission rates were 10.0% [22]. Since infection increases the risk of morbidity and readmission in patients undergoing posterior cervical fusion, when compared with ACDF, infection rates are expected to be a leading cause of readmissions [23]. However, frailty does not appear to independently increase the risk of readmission.
Regarding PROMs, patients with greater mFI scores had worse baseline PCS-12 and mJOA scores and worse postoperative PCS-12, NDI, and mJOA scores, mirroring previous studies that have demonstrated an association between increasing frailty severity and worse baseline and 1-year PROMs [24–26]. Although we were limited to 29 patients in the severely frail group, we identified that the moderate frailty group (mFI=0.18) had larger magnitudes of improvement in VAS neck and VAS back than the no frailty group. This is likely due to the more-to-gain phenomenon, whereby patients with greater baseline symptom severity have more room for improvements following surgery because of their worse baseline status. Essentially, a similar finding was noted in the adult deformity literature, but this finding has not been previously evaluated for patients undergoing PCDF [24]. Interestingly, our data indicate that age alone was not a significant predictor for improvements in clinical outcomes, although advanced age did near significance predicted less improvement in VAS neck and VAS arm. This lends further credence to the idea that frailty and age must be regarded as distinct clinical entities when evaluating the likelihood of clinical improvement. However, our study was limited by the smaller number of older patients since our cohort had an average age of <65 years. Thus, this data may not apply to patients aged >70 years.
Limitations of this study include those inherent to any retrospective analysis. Overall, posterior cervical procedures are much less commonly performed at our institution than anterior procedures; thus, a limited sample size was obtained when we attempted to analyze outcomes based on frailty status. Potential confounding variables were present in our analysis to evaluate clinical and surgical outcomes following PCDF. We attempted to control for these variables in our regression analysis to minimize their effect. As seen in our inclusion flow chart, this study has the potential for selection bias since approximately ¾ of our patients did not complete their 1-year follow-up or had incomplete PROMs. Future well-designed, prospective studies may provide additional insights into the effects of frailty status on clinical and surgical outcomes following PCDF.
Conclusions
Patients with severe frailty who underwent elective PCDF had worse baseline PCS-12 and mJOA scores. They also had worse 1-year postoperative PCS-12, NDI, and mJOA scores; however, patients with severe frailty had a similar magnitude of improvement in arm pain, neck pain, neck disability, and mental and physical function scores postoperatively. While patients with severe frailty had greater rates of non-home discharge, they had 90-day hospital readmissions, surgical complications, and revisions comparable to less frail ones. While our data may be underpowered to detect differences in complication rates based on frailty status, similar clinical improvements following PCDF can be expected across all ranges of frailty.
Notes
Conflict of Interest
No potential conflict of interest relevant to this article was reported.
Author Contributions
Conceptualization: MJL; data curation: KT, SL, POC, PB; formal analysis: MJL, KT; funding acquisition: None; methodology: MJL; project administration: BAK, JC, IDK, BW, AH, GS, AV, CK; vsualization: MJL; writing–original draft: MJL, KT, WC, KG; writing–review & editing: MJL, BAK, CK; and final approval of the manuscript: all authors.