Role of Anatomical Landmarks in Identifying Normal and Transitional Vertebra in Lumbar Spine Magnetic Resonance Imaging
Article information

Abstract
Study Design
Retrospective study.
Purpose
Identification of transitional vertebra is important in spine imaging, especially in presurgical planning. Pasted images of the whole spine obtained using high-field magnetic resonance imaging (MRI) are helpful in counting vertebrae and identifying transitional vertebrae. Counting vertebrae and identifying transitional vertebrae is challenging in isolated studies of lumbar spine and in studies conducted in low-field MRI. An incorrect evaluation may lead to wrong-level treatment. Here, we identify the location of different anatomical structures that can help in counting and identifying vertebrae.
Overview of Literature
Many studies have assessed the vertebral segments using various anatomical structures such as costal facets (CF), aortic bifurcation (AB), inferior vena cava confluence (IC), right renal artery (RRA), celiac trunk (CT), superior mesenteric artery root (SR), iliolumbar ligament (ILL) psoas muscle (PM) origin, and conus medullaris. However, none have yielded any consistent results.
Methods
We studied the locations of the anatomical structures CF, AB, IC, RRA, CT, SR, ILL, and PM in patients who underwent whole spine MRI at our department.
Results
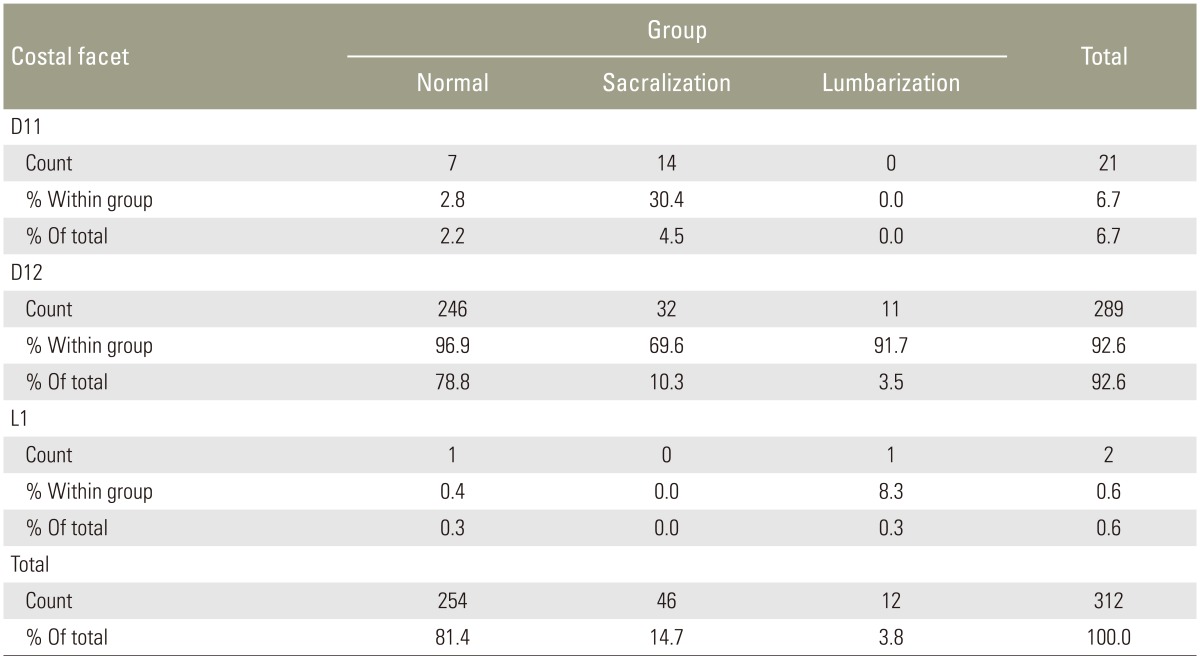
In our study, 81.4% patients had normal spinal segmentation, 14.7% had sacralization, and 3.8% had lumbarization. Vascular landmarks had variable origin. There were caudal and cranial shifts with respect to lumbarization and sacralization. In 93.8% of cases in the normal group, ILL emerged from either L5 alone or the adjacent disc. In the sacralization group, ILL was commonly seen in L5. In the lumbarization group, ILL emerged from L5 and the adjacent disc (66.6%). CFs were identified at D12 in 96.9% and 91.7% of patients in the normal and lumbarization groups, respectively. The PM origin was observed from D12 or D12–L1 in most patients in the normal and sacralization groups.
Conclusions
CF, PM, and ILL were good identification markers for D12 and L5, but none were 100% accurate.
Introduction
A lumbosacral transitional vertebra (LSTV) is a normal anatomical variant involving the L5–S1 vertebral level, which includes both lumbarization of the S1 vertebra and sacralization of the L5 vertebra [123]. Identification of a transitional vertebra is very important in spine imaging, especially in presurgical planning [4], to avoid treating the wrong level. Transitional vertebrae can also be a source of back pain, especially that characteristic of Bertolotti's syndrome [56]. Pasted images of the whole spine obtained using high-field magnetic resonance imaging (MRI) are helpful in counting vertebrae and identifying transitional vertebrae. In isolated studies of the lumbar spine and in those conducted with low-field MRI, the correct numbering of lumbar vertebrae is challenging. At present, there is no standardized method to identify LSTV unequivocally [78]. In this study, we sought to identify the different anatomical structures (costal facets [CF], aortic bifurcation [AB], inferior vena cava confluence [IC], right renal artery [RRA], celiac trunk [CT], superior mesenteric artery (SMA) root [SR], and the iliolumbar ligament [ILL] psoas muscle [PM] origin) that can help in counting and identifying vertebrae.
Materials and Methods
The images of patients who underwent whole spine MRI evaluation at the Department of Radiology between November 2015 and April 2016 were retrospectively reviewed. Whole spine MRI was performed for all patients referred for lumbar spine evaluation as part of the mandatory protocol at our department to avoid counting discrepancies. A total of 312 out of 330 patients aged between 5 and 87 years, with a mean age of 43 years, were included in the study. Eighteen patients were excluded from the study (segmentation fusion anomaly in three patients, significant wedge compression in the dorsolumbar region in 11 patients, common origin of CT and SMA in one patient, and anomalous origin and multiple right renal arteries in three patients). Sagittal T2, coronal STIR, and proper axial T2 sections of the lumbar region were obtained from all patients using a 1.5-Tesla MRI scanner (Signa 1.5 HDXT, GE Corporation, Milwaukee, WI, USA). This study was approved by the ethical committee of our institute. No financial burden was placed on the patients.
Two radiologists (D.J. and V.I., with 15 and 9 years of experience in spine imaging, respectively) studied the location of the anatomical structures CF, AB, IC, RRA, CT, SR, ILL, and PM origin of patients who underwent whole spine MRI at our department. Coronal images were used for assessing the PM origin. AB and IC were assessed on sagittal and axial T2-weighted images. CT, SMA, and RRA were assessed on sagittal images and confirmed with axial sections when necessary. ILL was assessed on axial T2-weighted images. CFs were assessed on sagittal T2-weighted images and confirmed with axial or coronal sections when necessary.
Results
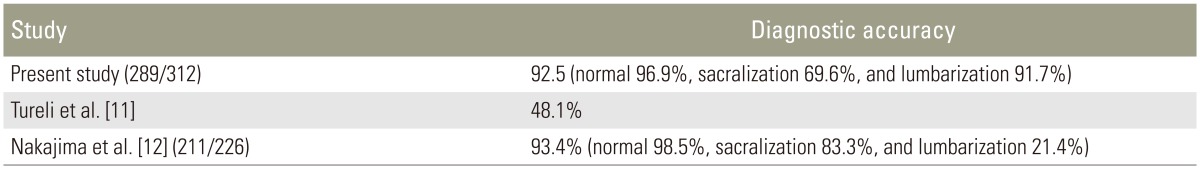
Of the 312 patients included in the study, 254 (81.4%) had normal spinal segmentation without transitional vertebrae. Fifty-eight patients had LSTV, with 46 (14.7%) showing sacralization of L5 and 12 (3.8%) showing lumbarization of S1. Of the 312 patients, 289 (92.5%) had the last CF at D12 (Fig. 1A). Twenty-one of the 312 patients (6.9%) had the last CF at D11 (Fig. 2), with 14 of them in the sacralization group and 7 in the normal group. Only two patients (0.7%) had their last CF at L1, with one of them in the lumbarization group and one in the normal group. The last CF at D12 was identified in 96.9%, 69.6%, and 91.7% in the normal, sacralization, and lumbarization groups, respectively (Table 1).
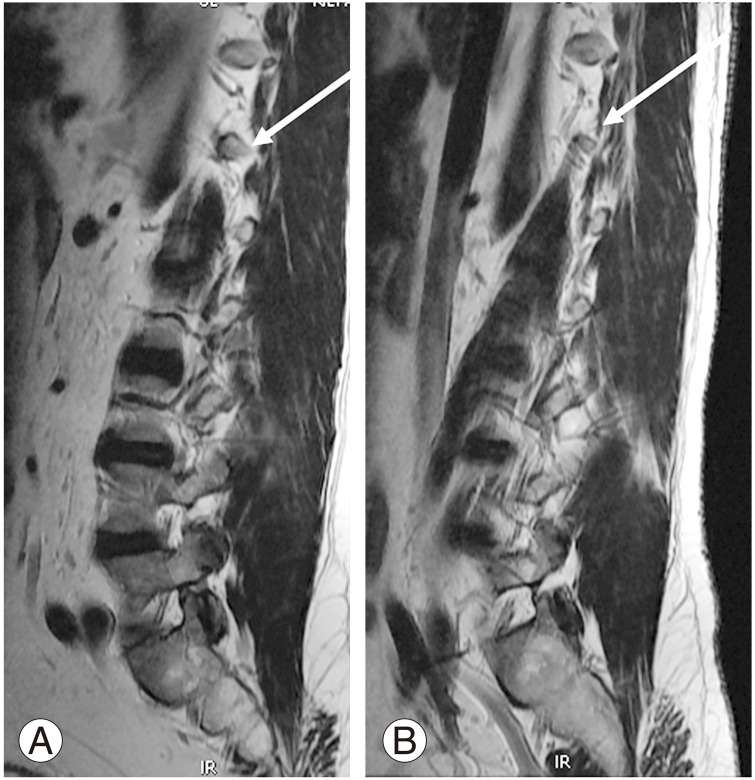
(A) Magnetic resonance imaging parasagittal T2 sequence shows normal costal facet at D12 vertebra (white arrow). (B) The costal facet appears rudimentary (white arrow).
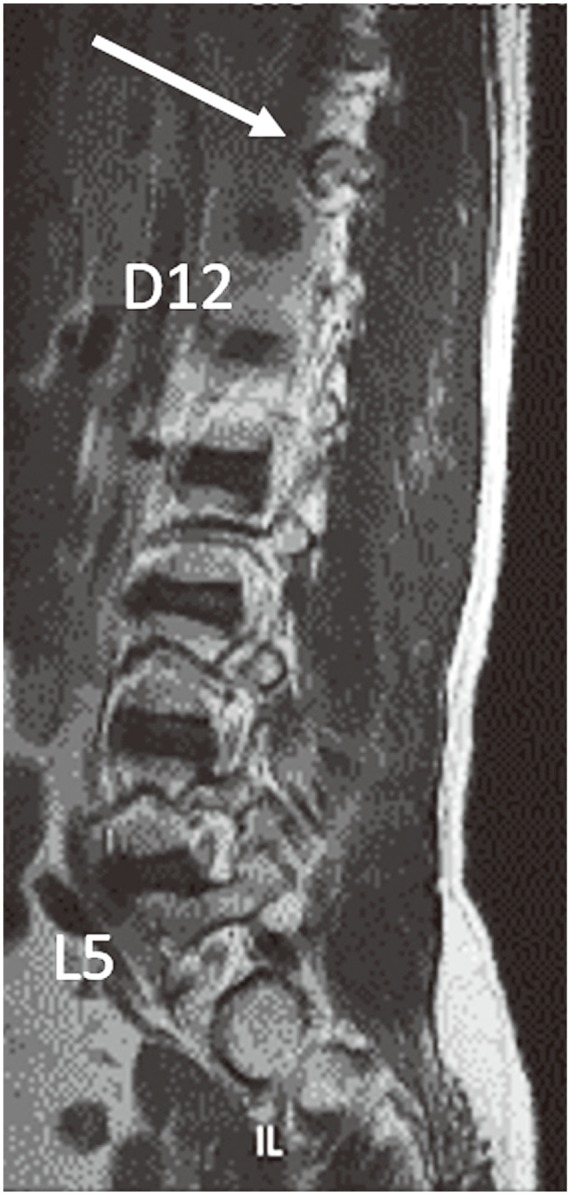
Parasagittal T2 sequence showing the last costal facet at D11 (white arrow).
Location of costal facet
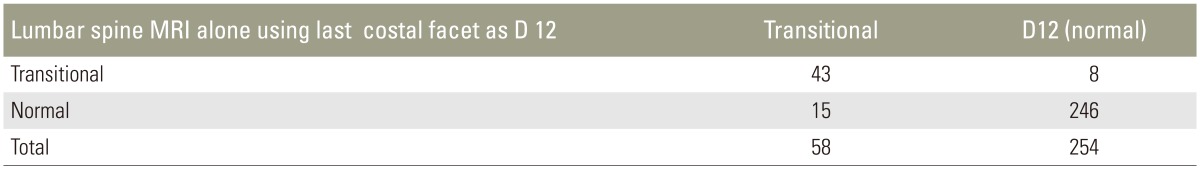
When we used lumbar spine MRI alone for identifying transitional vertebrae using the last CF at D12, the sensitivity was 74.14% and specificity was 96.85 (Table 2). The reason for the reduced sensitivity is that 14 cases (30.4%) of sacralization had the last CF at D11. Differentiation of the rudimentary CF (Fig. 1B) from a rudimentary posterior element was difficult in some cases. CFs were superior and anterior to the posterior margin of the vertebral body, whereas the rudimentary posterior element was superior and posterior to the posterior margin of the vertebral body.
Costal facet at D12: golden standard whole spine MRI identified transition vertebra
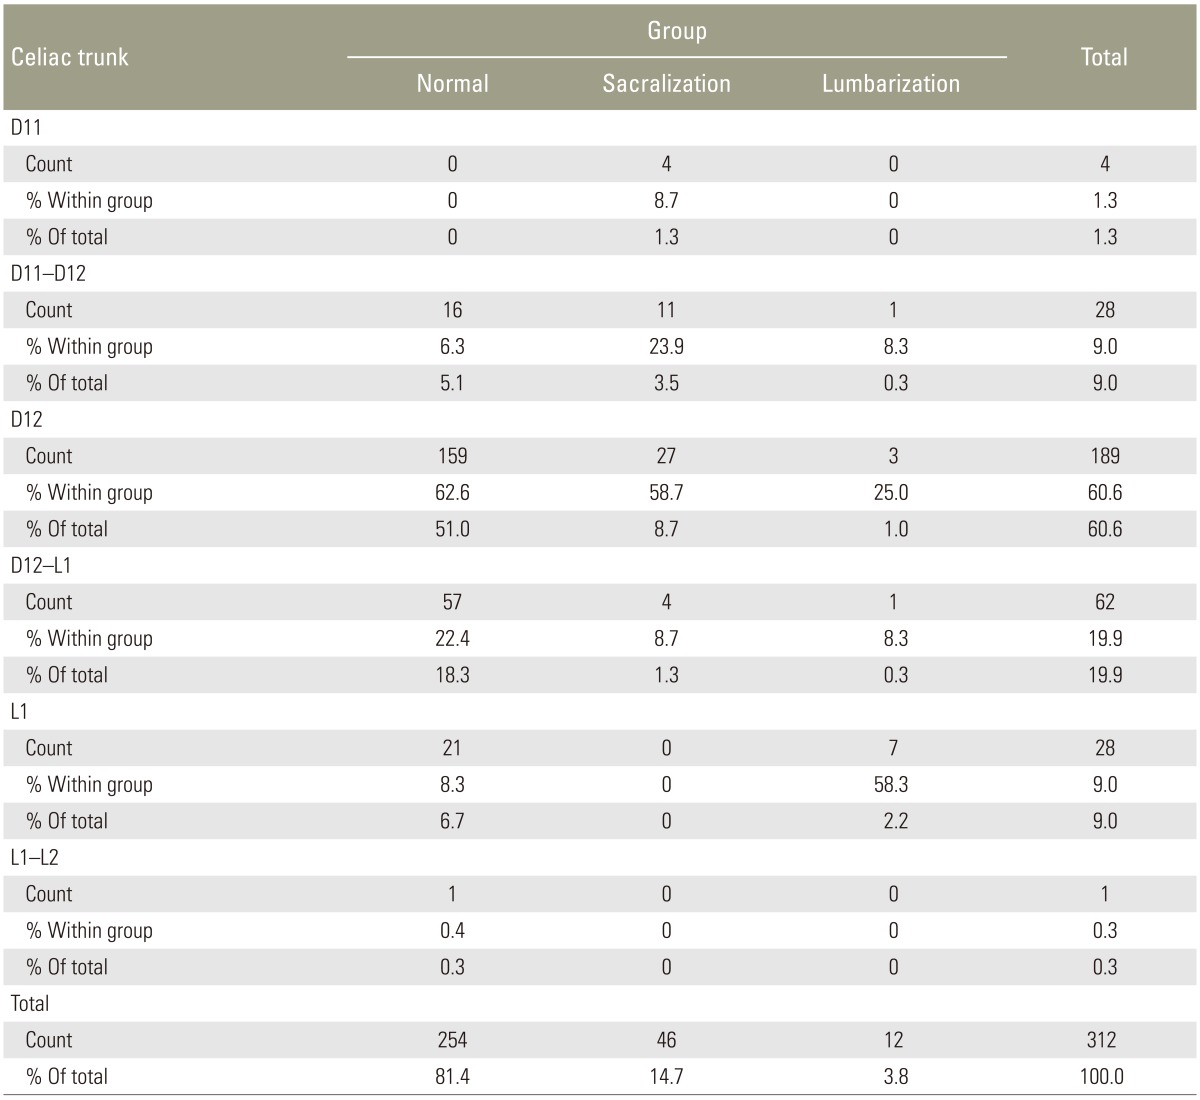
The CT origin (Fig. 3A) was observed at various levels: D11, D11–D12, D12, D12–L1, L1, and L1–L2. Overall, D12 was the commonest site of CT origin in 189 of 312 patients (60.6%). D12 was the commonest site of CT origin in the normal group (159/254), contributing to 62.6%, and in the sacralization group (27/46), accounting for 58.7%. L1 was the commonest site of CT origin in patients in the lumbarization group (7/12), accounting for 58.3%. We observed a segmental shift to L1 in most patients in the lumbarization group (Table 3).
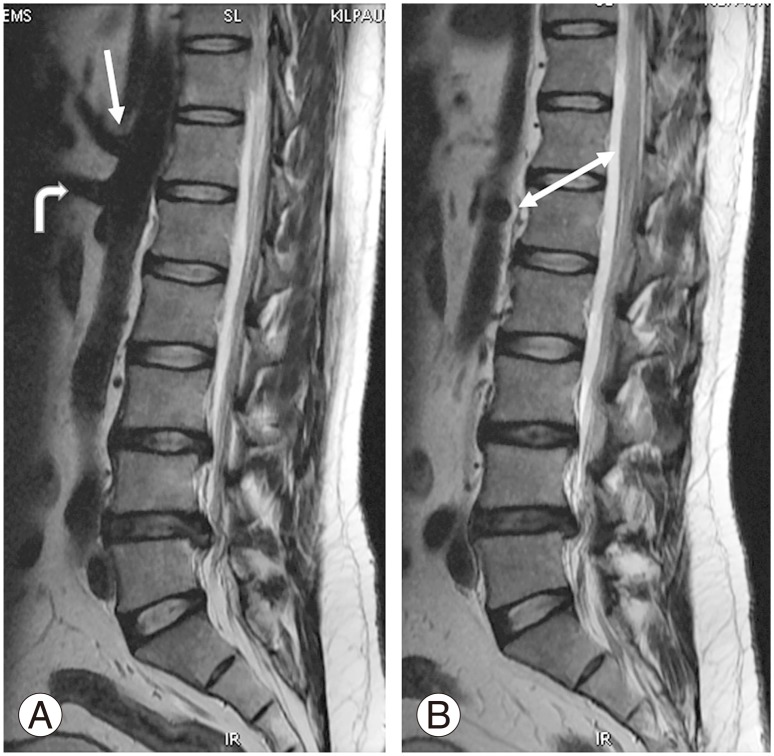
(A) Magnetic resonance imaging sagittal T2 sequence shows the origin of the celiac trunk at D12 vertebral level (white arrow) and superior mesenteric artery root at D12–L1 intervertebral disc level (curved arrow). (B) Origin of the right renal artery observed at the end of L1 (double-headed white arrow).
Origin of celiac trunk
The SMA origin (Fig. 3A) was observed at various levels: D11–D12, D12, D12–L1, L1, and L1–L2. Overall, D12–L1 was the commonest site of SMA origin in 119/254 patients (46.9%), followed by L1, which accounted for 81/254 cases (31.9%). In the normal group, D12–L1 and L1 levels together accounted for 78.8% of the group. In the sacralization group, D12 (18/46) and D12–L1 (14/46) were the commonest sites of SMA origin, accounting for 69.5% of the group. L1 (5/12) and L1–L2 (3/12) were the commonest sites of SMA origin in the lumbarization group, accounting for 66.7%.
The RRA origin (Fig. 3B) was observed between D12 and L2. Overall, L1 was the commonest site of RRA origin in 173 of 312 patients, contributing to an incidence of 55.4%, followed by L1–L2 level, which contributed to 69/312 cases (22.1%). L1 (146/254) and L1–L2 (61/254) were the commonest sites of RRA origin in the normal group, contributing to 57.5% and 24%, respectively. In the sacralization group, L1 (24/46) and D12–L1 (10/46) were the commonest sites of RRA origin, contributing to 52.2% and 28.6%, respectively. L2 (5/12) was the commonest site of RRA origin in patients in the lumbarization group, contributing to 41.7% (Table 4). Early branching of RRA, which represented some difficulties, is one of the main limitations of this study.

Origin of right renal artery
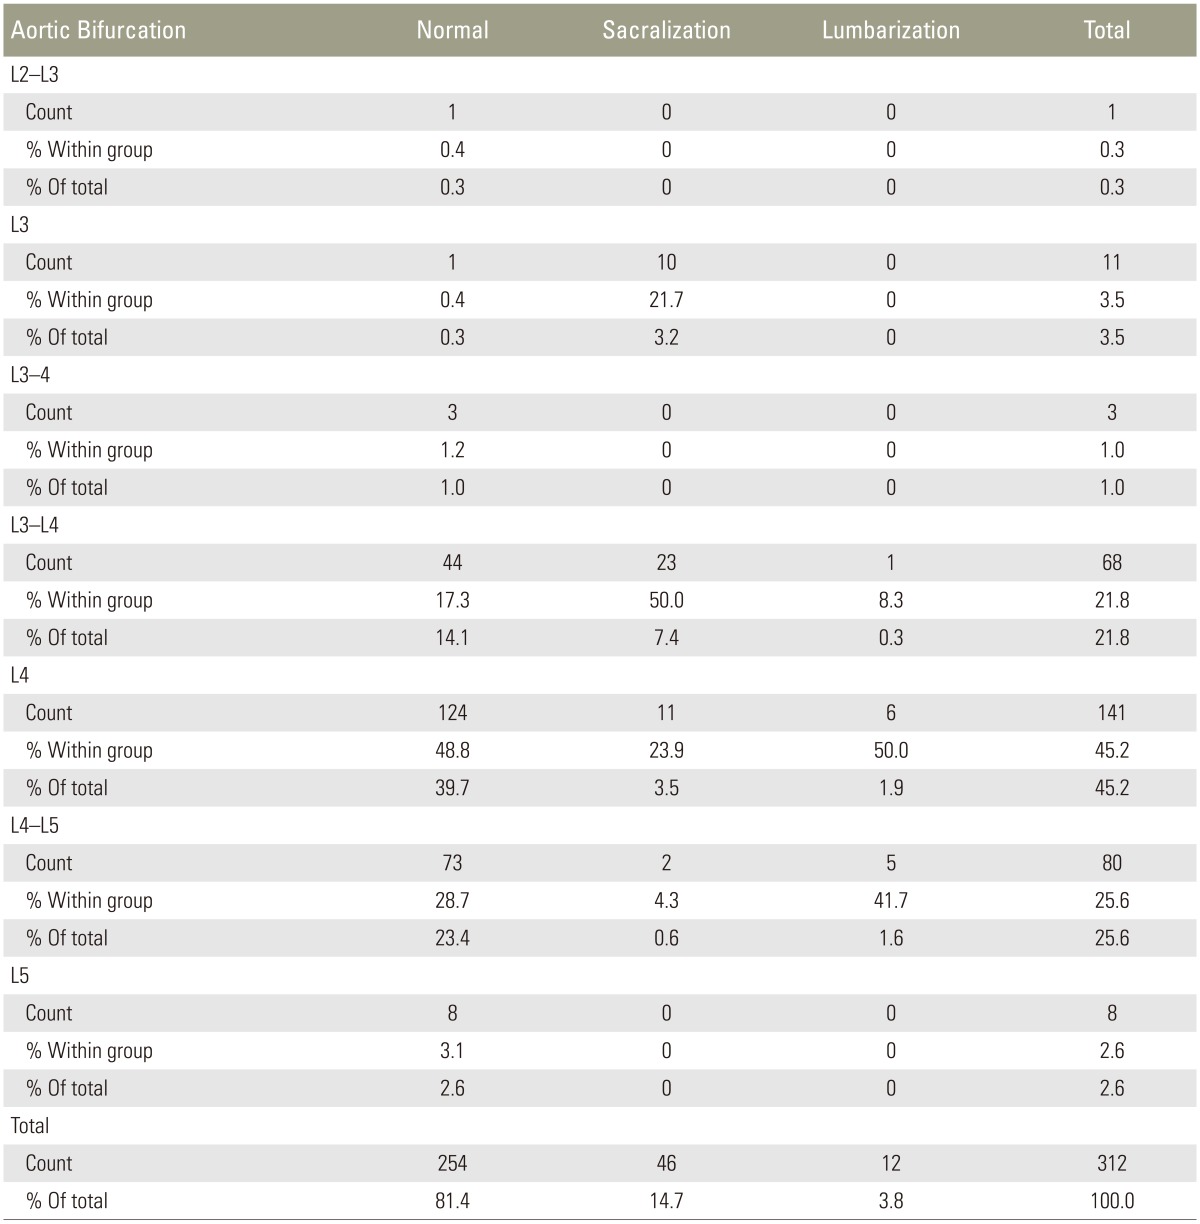
AB (Fig. 4A) was observed at L2–L3 to L5 levels. Overall, L4 was the commonest site of AB in 141 of 312 patients, contributing to the incidence of 45.2%, followed by L4–L5 (80/312), which contributed to 25.6%. L4 (124/254) and L4–L5 (73/254) were the commonest sites of AB in the normal group, contributing to 48.8% and 28.7%, respectively. In the sacralization group, L3–L4 (23/46) and L4 (11/46) were the commonest sites of AB in patients contributing to 50% and 23.9%, respectively. L4 (6/12) and L4–L5 (5/12) was the commonest sites of AB in patients in the lumbarization group, contributing to 50% and 41.7%. Low bifurcation at L5 was observed in eight patients (3.1%) in the normal group. High bifurcation at or above L3 was observed only in 2 patients (0.8%) in the normal group and 10 (21.7%) in the sacralization group (Table 5).
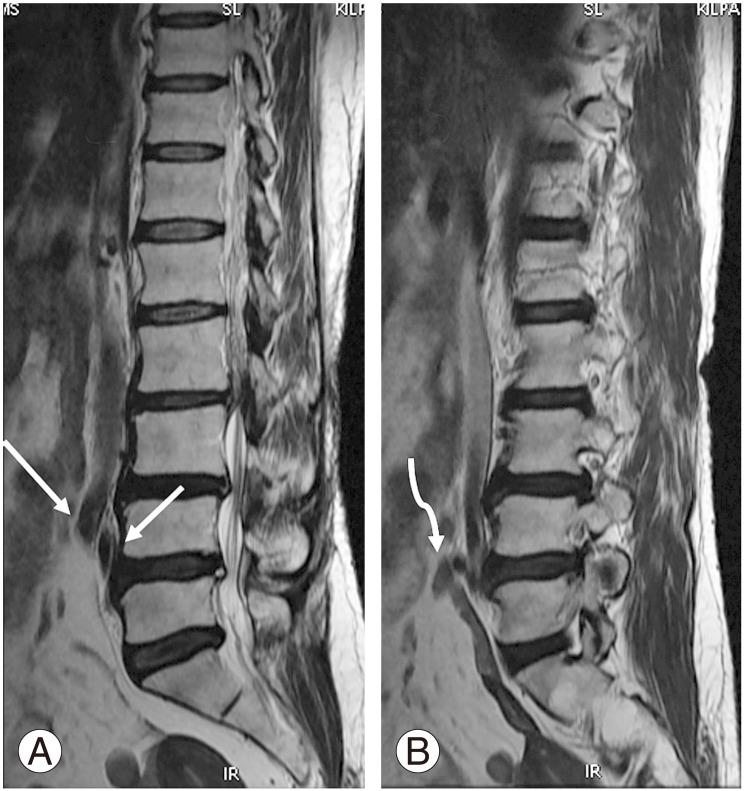
(A) Magnetic resonance imaging sagittal T2 sequence bifurcation of aorta observed at L4 vertebral level, right and left illiac arteries (white arrows). (B) Confluence of inferior vena cava observed at L4–L5 intervertebral disc level (wavy arrows).
Level of aortic bifurcation
IC (Fig. 4B) was observed at various levels from L2 to L5. Overall, L4 was the commonest site of IC in 149 of 312 patients, contributing to an incidence of 47.8%, followed by L4–L5 (106/312 cases), which contributed to an incidence of 34%. L4 (123/254) and L4–L5 (96/254) were the commonest sites of IC in the normal group, contributing to an incidence of 48.4% and 37.8%, respectively. In the sacralization group, L4 (22/46) and L3–L4 (15/46) were the commonest sites of IC in patients, contributing to an incidence of 47.8% and 32.6%, respectively. L4–L5 (7/12) and L4 (4/12) were the commonest sites of AB in patients in the lumbarization group, contributing to an incidence of 58.3% and 33.3%, respectively. High confluence of L2 was observed in 1 (0.4%) normal patient. Wide variation in IC was observed within the normal group. No significant lower confluence was observed in the lumbarization group.
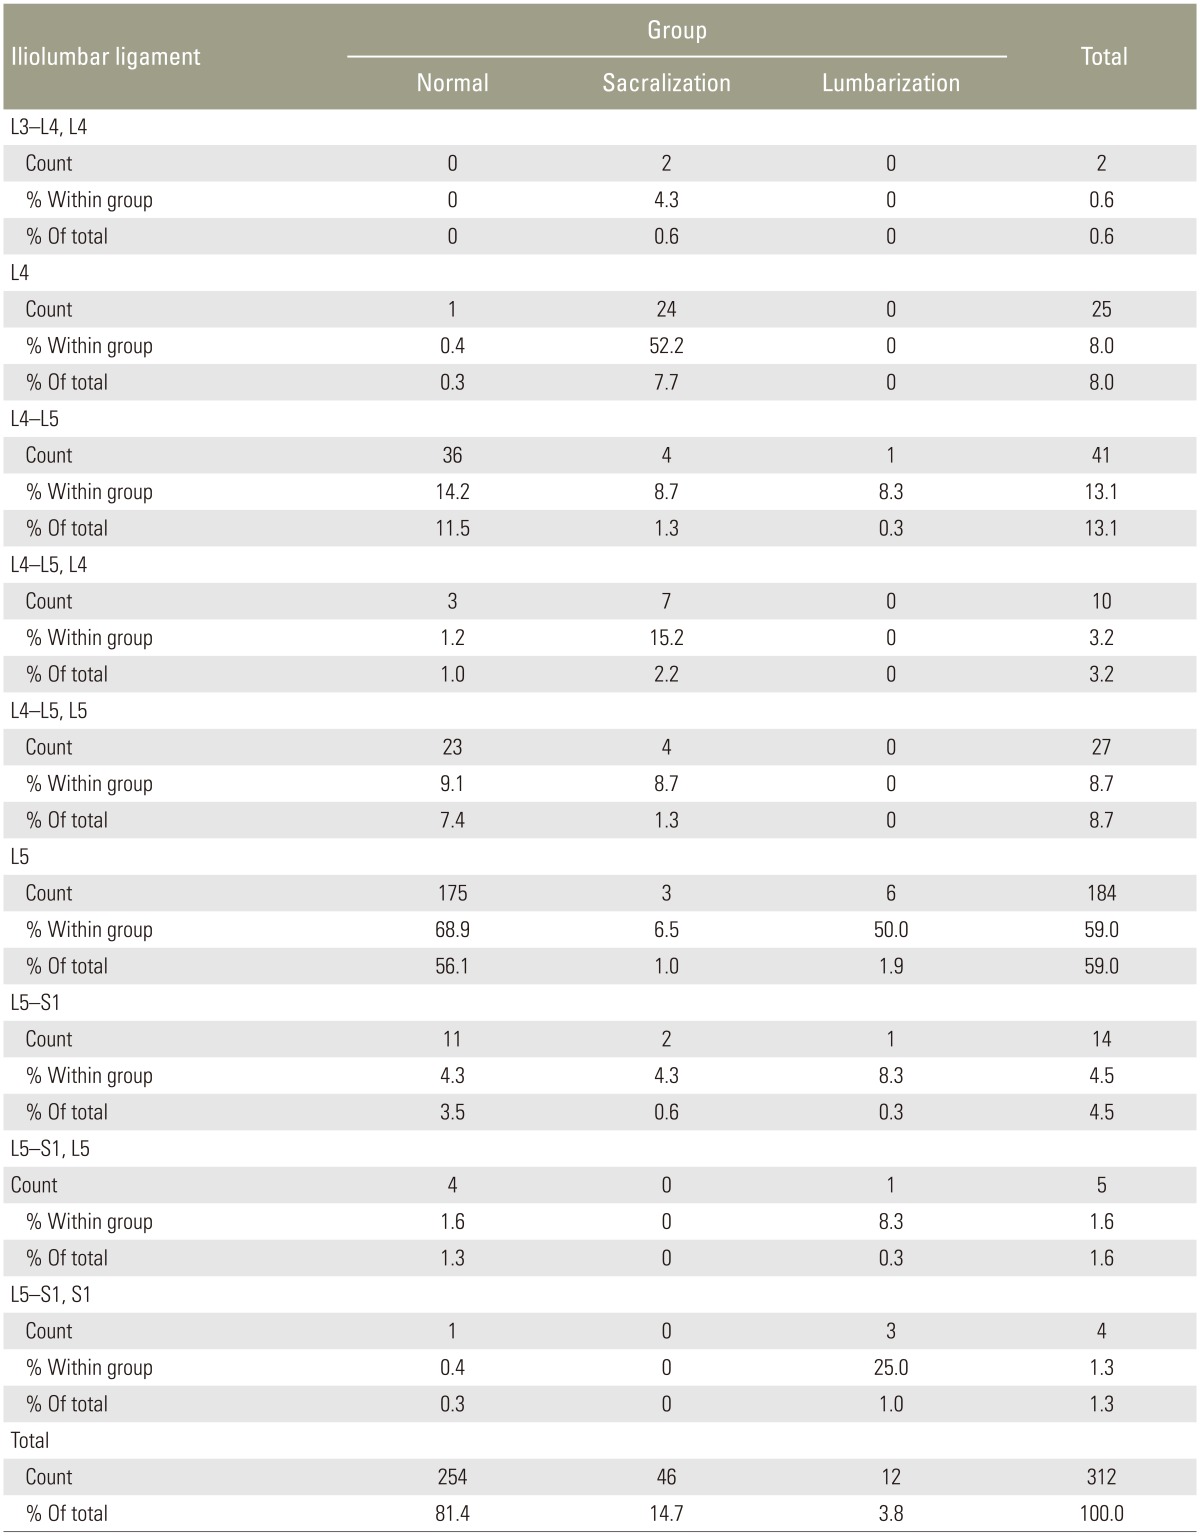
In the normal group, ILL was observed at L5 (Fig. 5B, D) in 175/254 cases (68.9%). Extension of ILL fibers was observed from L5 either to L4–L5 in 23 patients (9.1%) or to L5–S1 in 4 patients (1.6%), with a total of 10.7% (Table 6). In 36 cases, ILL was observed only in L4–L5 (Fig. 6), amounting to 14.2% in the normal group. In total, ILL emerged from either L5 alone or with fiber extensions to adjacent intervertebral discs in 93.8% of cases in the normal group. In the rest of the normal group, ILL emerged from the disc of L5–S1 (4.3%), S1 (0.3%), L4, and L4–L5 together (1.6%).
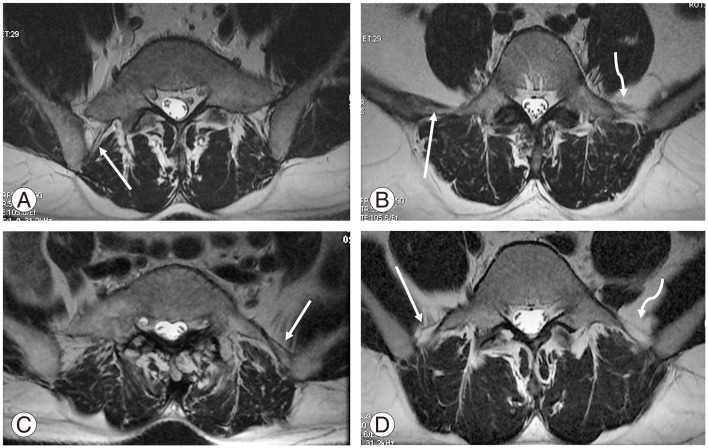
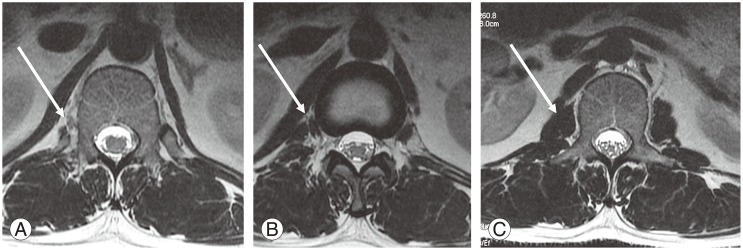
(A) Magnetic resonance imaging axial T2 sequence shows partial sacralization of L5 with a thick posterior band of illiolumbar ligament (ILL) on the right side (white arrow). (B) L5 with thick anterior and posterior band ILLs on the right side (white arrow) and thin multiple fine bands on the left side (wavy arrow). (C) Thick ILL on the left side in the partial sacralized L5 (white arrow). (D) L5 showing thin ILL bilaterally, except for a posterior band on the left side (squiggly arrow).
Location of iliolumbar ligament

Magnetic resonance imaging axial T2 sequence shows thick illiolumbar ligament clearly visualized at the intervertebral disk level bilaterally (white arrows).
In the sacralization group, ILL was commonly observed in L4 in 24/46 patients (52.2%). Fiber extension from L4 to L4–L5 and L3–L4 was observed in 7 (15.2%) and 2 (4.3%) patients, respectively. ILL was well observed only at the L4–L5 level in 4 cases (8.7%). Overall, in 80% of the cases, ILL was related to last lumbar vertebra or its adjacent disc. In rest of the cases (20%), ILL was observed at L5 in 3 cases (6.5%) (Fig. 5A, C), with extension to L4–L5 in 4 (8.7%) and L5–S1 in 2 cases (4.3%).
In the lumbarization group, ILL emerged from L5 in 6 cases (50%), with extension of fibers to L5–S1 in 2 (16.6%) cases. ILL emerged from the last lumbar vertebra, that is, lumbarized S1, and L5–S1 was observed in three cases (25%). ILL emerged from the L4–L5 level only in 1 case (8.3%).
The ILL morphology was variable; we observed thin (Fig. 5D)/thick (Fig. 5B) and single band-like/multiple fine bands (Fig. 5B). In lumbar spine MRI, the axial sections were noncontiguous, rather than a batch of sections. This could be the reason for better delineation of ILL at disc levels, mainly at L4–L5 in a few cases (Fig. 6). This could be a minor limitation of our study.
The Castellvi classification was applied to cases of sacralization (Table 7). Castellvi III b and IV types constituted 26 cases (57%); in all these cases, ILL emerged from the last lumbar vertebra, that is, L4 and extension of fibers from L4 to L4–L5 and L3–L4. In the remaining 20 cases (43%) classified as other Castellvi types, ILL emerged from L5 or L4 and adjacent discs.

Castellvi classification
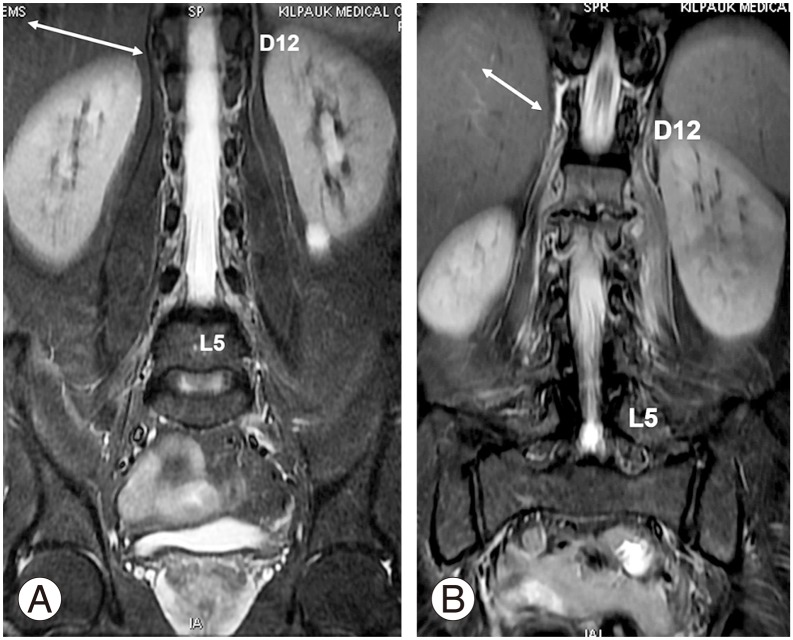
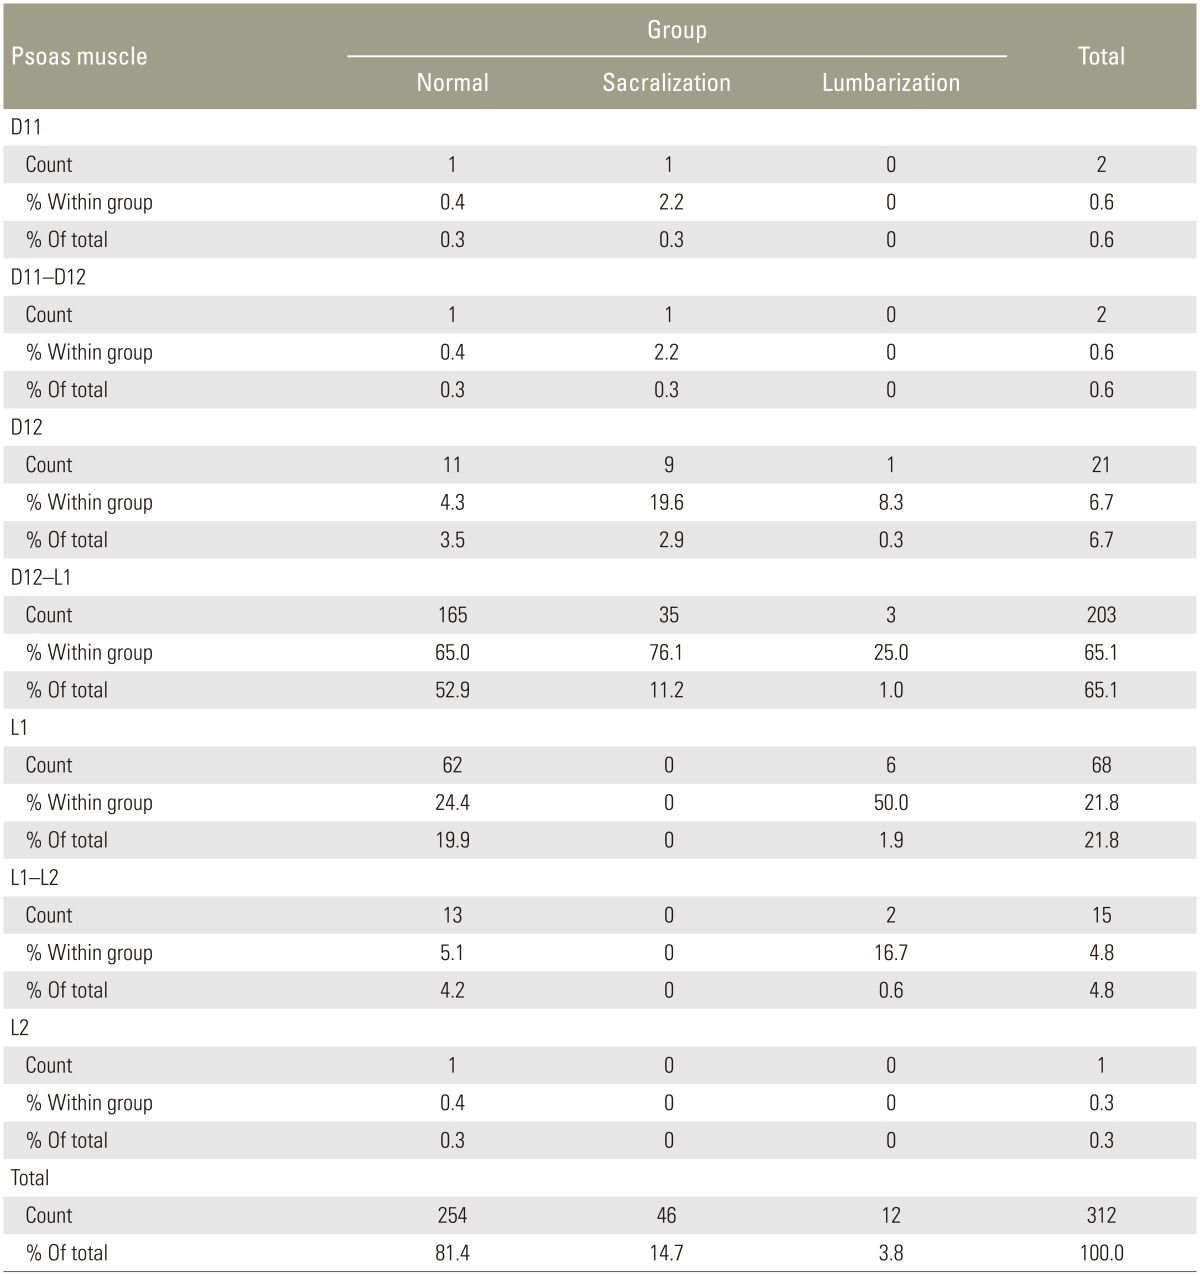
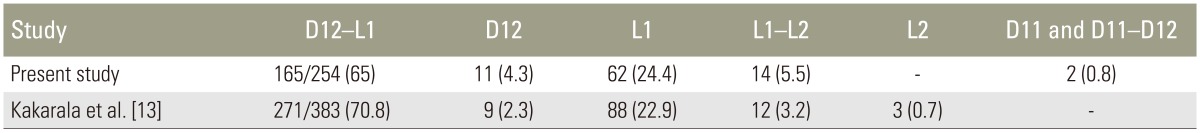
In the normal group, the more superior fibers of PM were observed originating at D12–L1 (Fig. 7A) in coronal sections in 165/254 (65%) and at D12 (Fig. 7B) in 11(4.3%), accounting for 69.3% of the cases. The remaining cases in the normal group had PM origin from L1 (62 [24.4%]), L1–L2 (14 [5.5%]), and D11 and D11–D12 (2 [0.8%]) (Table 8). In the sacralization group, the PM origin was observed at D12 in 9 (19.6%) and at D12–L1 in 35 (76.1%) cases. Only in 2 cases (4.4%), it was observed at D11 or D11–D12. In the lumbarization group, the PM origin was at L1 in 6 cases (50%) and at L1–L2 in 2 cases (16.7%). In 3 cases (25%), the PM origin was D12–L1 and D12 in 1 case each (8.3%).
(A) Coronal short tau inversion recovery sequence showing origin of the bilateral psoas clearly visualized at D12–L1 intervertebral disc level (white arrow). (B) Edema around the psoas major well delineates the psoas fibers arising from D12 (white arrow).
Origin of psoas muscle
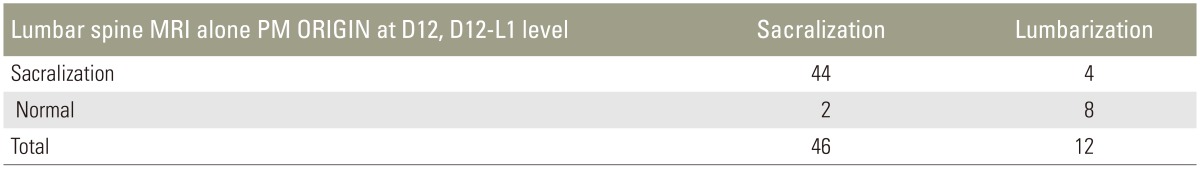
When only lumbar spine MRI was used for identifying transitional vertebra using the PM origin at D12 or D12–L1, the sensitivity and specificity were 82.76% and 69.29%, respectively (Table 9). The PM origin was observed at L1 in 62 cases in the normal group, which was likely the reason for reduced specificity. However, among transitional vertebrae, identifying sacralization is possible by using the PM origin at D12 or D12–L1, with a sensitivity and specificity of 95.65% and 66.67%, respectively (Table 9). The reduced specificity could be attributed to the fact that eight patients with lumbarization were considered normal (Tables 10, 11, 12, 13).

Golden standard whole spine MRI identified transition vertebra
Golden standard whole spine MRI identified transition vertebra
Illiolumbar ligament
Costal facet at D12
Psoas muscle origin
Discussion
Elongation of the transverse process of the lowest lumbar vertebra with variable degrees of fusion or failure of segmentation with the sacrum gives rise to LSTV [7]. LSTV has an incidence of 4% to 30% in the general population [3]. A transitional vertebra was observed in 18.5% of our study population. Patients with LSTV pose an issue for spinal surgeons because this anatomical variation may lead to discrepancies between imaging findings and patient symptoms. Incorrect numbering of the vertebrae has led to spinal surgery at wrong levels, and there is a higher probability of such error in patients with LSTV [3]. Identification of this anatomical variation and accurate numbering of the lumbar vertebrae on MRI is useful for both the treating physician and the operating surgeon [14].
Many studies have assessed the vertebral segments using various anatomical structures such as CF, AB, IC, RRA, CT, SR, ILL PM origin, and conus medullaris [47]. Some studies have used different parameters such as A and B angles to assess LSTV [14].
Lee et al. [15] studied 210 patients to evaluate the anatomic significance of AB, RRA, and conus medullaris in locating the lumbar vertebral segments. The most common sites of AB and RRA were at the L4 vertebra and L1–L2, respectively. The position of the conus medullaris was variable with the commonest site at L1 (56%), which was found to be an unreliable landmark. They concluded that AB and RRA could be reliable landmarks for determining the lumbar vertebral segments on MRI or CT [15]. Even though, in our study, L4 was the commonest site of AB, it constituted only 45.2% of the total cases and a superior shift of one segment was observed in the sacralization group. In our study, 55.4% of cases had the RRA origin at L1 with one-segment caudal shift in the lumbarization group.
Lee et al. [1], in their study involving 534 patients to assess the location of paraspinal structures on MRI, found that AB, IC, RRA, CT, SR, and ILL were useful landmarks for LSTV. They found that the most common site of the paraspinal structures in the normal group was AB at the lower L4, IC at the L4–L5 disc space, RRA at the L1–L2 disc space, CT at the T12–L1 disc space, SR at the upper L1, and ILL at L5. LSTV accounted for 23.8% of their cases (lumbarization, 9.9%; sacralization, 13.9%). They found that the paraspinal structures of S1 lumbarization were positioned more caudally, whereas the paraspinal structures of L5 sacralization were positioned more cephalically. Similar to their study, caudal and cranial shifts were also observed in our study, but here, IC was observed at L4 in 47.8%, CT at D12 in 60.6%, and SR at D12–L1 in 43.3% cases.
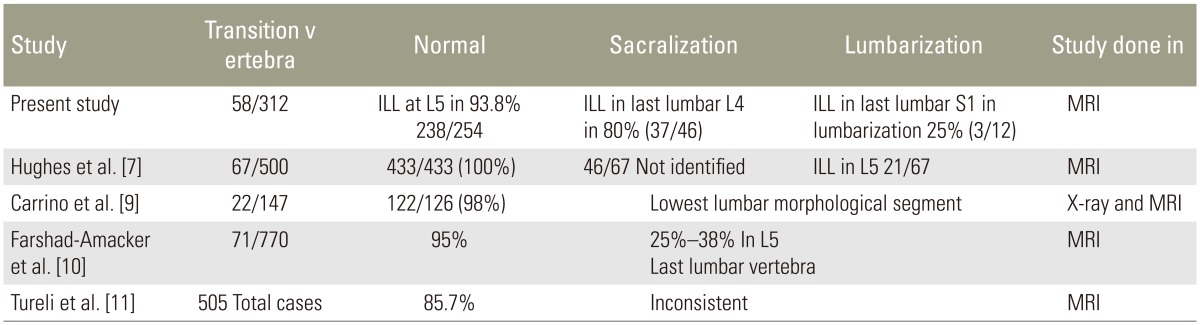
Hughes and Saifuddin [7] studied 500 patients, which included 67 LSTVs. The ILL was identified at L5 in all patients with normal lumbosacral segmentation (n=433). Using the identification of the ILLs as a marker of vertebral level at L5, they numbered 46 of the 67 LSTV as L5 transitions and 21 as S1 transitions. They concluded that ILL was readily identifiable on axial lumbar spine MRI and that it always emerged from L5. They suggested that its position could be used to assign lumbar levels confidently in patients with LSTV, which is not dissimilar from our observation.
Carrino et al. [9] studied 147 patients with the purpose of verifying the ILL location and evaluating the morphologic features of LSTVs on MRI. They found ILL at the L5 level in 122 of the 147 patients. However, in their study, ILL did not always denote the level of L5 but rather simply identified the lowest lumbar-type vertebral segment. Thus, they suggested that ILL can be used to identify the lumbosacral junction rather than L5. Bressler [16] also reiterated the same point (that ILL arises from the last lumbar vertebra, which could be L4, L5, or L6 depending on the segmentation of the rest of the spine) in 2007 in response to the study by Hughes and Saifuddin [7] In our study, ILL in the normal group emerged from the last lumbar vertebra L5 or its adjacent disc in 93.8% of the cases. In the sacralization group, ILL emerged from L4 or its adjacent disc in 80% of the cases. In the remaining 20% cases, it emerged from L5 or its adjacent disc because of partial sacralization, incomplete bony sacralization, and unilateral sacralization. When we applied the Castellvi classification to our sacralization cases, Castellvi III b and IV types constituted 26 cases (57%). In all these cases, ILL emerged from the last lumbar vertebra or from its adjacent disc. In the remaining 20 cases of other Castellvi types (43%), ILL emerged from L5 or L4 and the adjacent discs.
In the lumbarization group, the major contribution was from L5 or its adjacent disc in 66.6% of the cases rather than from the last lumbar vertebra (25%) (i.e., lumbarized first sacral vertebra or its adjacent disc. ILL usually emerging from the last lumbar vertebra was not beneficial for the lumbarization group in our study. We performed a comparison of studies, which is presented in Tables 11, 12, 13.
Farshad-Amacker et al. [10] studied 770 patients and 71 LSTV cases. They found that ILL identified the L5 vertebra by emerging solely from L5 in 95% of the controls. Conversely, in patients with LSTV, ILL originated solely from L5 in only 25%–38% of the cases. They concluded that the level of the origin of ILL is unreliable for the identification of the L5 vertebra in the setting of an LSTV or other segmentation anomalies, as we too have observed in our study.
In 1,049 adult patients, Tokgoz et al. [4] studied the morphology of S1–S2 disc, L5 and S1 body, and lumbar spinous processes and positions of the RRA, SMA, AB, and conus medullaris. The most common sites of spinal and paraspinal structures were RRA at L1 body (53.6%) and L1–L2 disc (34.1%), SMA at L1 body (55.1%) and T12–L1 disc (31.6%), and AB at L4 body (71.1%). Conus medullaris (CM) had variable locations, changing from the T12–L1 disc to the L2 body. They were located at higher levels in sacralization and lower levels in lumbarization. They concluded that paraspinal structures on lumbar MRI were not completely reliable for the diagnosis of LSTVs and identification on the vertebral levels. Their study was comparable to ours regarding the RRA origin and AB and craniocaudal shifts in sacralization and lumbarization.
Tureli et al. [11] studied 505 patients on 3-Tesla MRI for assessing the reliability of ILL, 12th CF, AB, RRA, and conus medullaris for numbering the vertebral segments. The identifiabilities of ILL and 12th CF were 85.7% and 48.1%, respectively. AB, RRA, and CM were located more caudally in lumbarized S1 and more cranially in sacralized L5 cases. Thus, they concluded that these landmarks were not reliable alternatives to cervicothoracic scout images owing to wide ranges of distribution and inconsistencies in identification. Contrary to their findings, 96.9% in the normal group and 91.7% in the lumbarized group had CF at D12 in our study. In the sacralization group, if CF alone was taken into account, it led to wrong identification of D12 in 30.4% (14) of the cases. Thus, for 1 person in the lumbarization group, D12 was identified incorrectly.
The origin of the PM fibers can be visualized clearly in coronal sections. Tracing the more superior fibers is especially easy in cases where edema outlines the PM (Fig. 7B). In axial sections, PM fibers are observed as hypointense bands or fibers, which can be visualized clearly at D12–L1, L1, or the levels below (Fig. 8). Nevertheless, identifying the PM in axial sections at D12 is very difficult. The PM origin at D12 or above is best observed in coronal sections. In the sacralization group, most cases (95.7%) had the PM origin emerging from D12 or D12–L1 levels, like in the normal group. The remaining 4.4% cases, which emerged at D11 or D11–D12, are likely to cause confusion if this parameter alone is taken into account. In the lumbarization group, the PM origin in most cases (66.7%) was from L1 or L1–L2, which was quite different from that in the normal group. Only four cases (33.3%) had a similar PM origin as in the normal group.
(A–C) Axial T2 sections (arrow) showing the origin of the psoas muscle from D12 on the right side clearly visualized below D12–L1 intervertebral disc level and L1 levels (arrow).
Farshad-Amacker et al. [17] in their study of 133 patients found that AB and RRA were unreliable in correctly numbering the lumbar vertebrae in LSTV. They found that the tangent drawn at the top of the iliac crest, namely the iliac crest tangent sign, had a sensitivity of 81% and specificity of 64%–88% in accurately numbering the vertebrae in LSTV if only a lumbar spine MRI was available.
Some studies have used just the whole spine localizer, instead of the T2-weighted image of the whole spine, to count the vertebrae [18]. Some researchers have used computed tomography of the thoracolumbar junction to avoid pitfalls in the numbering of vertebrae. Park et al. [19] in their study of 420 patients found that numerical variants of the spine are more common than transitional vertebrae. They found that increased numbers of vertebrae were more common in men. Transitional lumbosacral vertebrae in their study contributed only to about 3.3% of the study population, with numerical variants accounting for about 7.7% [20].
This study included symptomatic individuals, thereby contributing to potential selection bias in the study population. Absence of correlation with radiography and the exclusive MRI based identification of the transitional vertebrae is another limitation to be considered. Non-identification of numerical variants of the spine as a separate entity from transitional lumbosacral vertebrae is also a pitfall in this study. The PM origin appeared as a proper triangle in coronal images of the paravertebral region at the L1 level, with the tip at the D12–L1 disc level. However, on axial sections, the PM origin was not clearly visualized at D12 in any of the patients. Variant vascular anatomy such as early branching of RRA and common CT-SMA origin, which caused difficulties in the vertebral level identification, is one of the minor limitations. Lack of availability of contiguous axial images from L4 to S1 levels could be a minor limiting factor for the better identification of ILL. A very small number for assessing certain morphological structures in the LSTV group (like PM origin in the lumbarization group) was another limitation.
Conclusions
In this study, to assess the role of vascular and musculoskeletal anatomical structures in counting of vertebrae and identifying LSTV, vascular landmarks had variable origin with caudal and cranial shifts in lumbarization and sacralization, respectively. ILL emerged from either L5 alone or its adjacent disc in 93.8% of cases in the normal group, and ILL was observed in last lumbar vertebra (L4) and its adjacent disc in 80% of cases. Thus, ILL seems to be useful for the identification of the last lumbar vertebra in cases of sacralization Castellvi III b and IV types. CF was observed at D12 in 96.9% and 91.7% in the normal and lumbarization groups, respectively; thus, CF was identified as a reliable marker for D12 identification. Similarly, PM origin was observed from D12 or D12–L1 in 69.3% and 95.7% of patients in the normal and sacralization groups, respectively. Hence, CF, PM origin, and ILLs are good identification markers for D12 and L5, though none of them led to 100% accurate identification. The most ideal scenario would be to acquire whole spine T2-weighted images in every case to avoid any potential pitfall in vertebral counting and identification.
Notes
Conflict of Interest: No potential conflict of interest relevant to this article was reported.