Evaluation of Lumbar Intervertebral Disc Degeneration Using T1ρ and T2 Magnetic Resonance Imaging in a Rabbit Disc Injury Model
Article information

Abstract
Study Design
An in vivo histologic and magnetic resonance imaging (MRI) study of lumbar intervertebral disc (IVD) degeneration was conducted.
Purpose
To clarify the sensitivity and efficacy of T1ρ/T2 mapping for IVD degeneration, the correlation between T1ρ/T2 mapping and degenerative grades and histological findings in the lumbar IVD were investigated.
Overview of Literature
The early signs of IVD degeneration are proteoglycan loss, dehydration, and collagen degradation. Recently, several quantitative MRI techniques have been developed; T2 mapping can be used to evaluate hydration and collagen fiber integrity within cartilaginous tissue, and T1ρ mapping can be used to evaluate hydration and proteoglycan content.
Methods
Using New Zealand White rabbits, annular punctures of the IVD were made 10 times at L2/3, 5 times at L3/4, and one time at L4/5 using an 18-gauge needle (n=6) or a 21-gauge needle (n=6). At 4 and 8 weeks post-surgery, MRI was performed including T1ρ and T2 mapping. The degree of IVD degeneration was macroscopically assessed using the Thompson grading system. All specimens were cut for hematoxylin and eosin, safranin-O, and toluidine blue staining.
Results
Disc degeneration became more severe as the number of punctures increased and when the larger needle was used. T1ρ and T2 values were significantly different between grade 1 and grade 3 IVDs, grade 1 and grade 4 IVDs, grade 2 and grade 3 IVDs, and grade 2 and grade 4 IVDs (p<0.05). There was a significant difference between grade 1 and grade 2 IVDs only in terms of T1ρ values (p<0.05).
Conclusions
T1ρ and T2 quantitative MRI could detect these small differences. Our results suggest that T1ρ and T2 mapping are sensitive to degenerative changes of lumbar IVDs and that T1ρ mapping can be used as a clinical tool to identify early IVD degeneration.
Introduction
Low back pain is a common and significant clinical and socioeconomic problem; it can be divided into two categories: specific and nonspecific [123]. Specific low back pain can be induced by apparent causes such as infection or spinal tumors [3]. However, 80% to 90% of low back pain cases are classified as nonspecific, without identifiable causes; nonspecific low back pain is often chronic and difficult to treat [45]. Intervertebral disc (IVD) pathology may be one significant contributor of low back pain, and early signs of IVD degeneration are proteoglycan loss, dehydration, and collagen degradation [3678]. Magnetic resonance imaging (MRI) has been widely used to detect IVD degeneration because it is noninvasive and useful for evaluating soft tissue [9]. The Pfirrmann grading system, which is a semiquantitative classification of IVD degeneration using T2-weighted MRI, has been widely used to assess IVD degenerative changes, but some authors have reported that the Pfirrmann grading system cannot detect early IVD degeneration [101112].
Proteoglycan is a hydrophilic macromolecule that leads to the hydration of the nucleus pulposus, accounting for the load-bearing property of the disc [11121314151617]. There are few reports that axial T2 mapping can provide a useful and noninvasive evaluation of the matrix status in IVDs and can be a useful indication of disc function [9]. Recent clinical studies have explored the use of T1ρ mapping to evaluate symptomatic IVD degeneration [11121314151617]. Recently, T1ρ evaluation has become the focus of attention; therefore, the purpose of this study was to investigate the correlation between T1ρ/T2 mapping and degenerative grades and histological findings in a rabbit IVD injury model.
Materials and Methods
All protocols for animal procedures were approved by the Ethics Committees of Chiba university (approval no., 2-280) following the National Institutes of Health Guidelines for the Care and Use of Laboratory Animals (1996 version).
1. Disc injury model
IVD degeneration was induced via a well-established rabbit annular puncture model [181920]. Under general anesthesia using ketamine hydrochloride (10 mg/kg, Ketalar; Daiichi Sankyo Co. Ltd., Tokyo, Japan), rabbits (n=12, New Zealand White, 8-week old) were placed in the lateral prone position. The posterolateral retroperitoneal approach was used to expose the anterolateral surface of three consecutive lumbar IVDs (L2/3 to L4/5). Annular punctures were made 10 times at L2/3, 5 times at L3/4, and 1 time at L4/5 using an 18-gauge needle (n=6) or a 21-gauge needle (n=6). The tip of the needle was marked 5 mm from the tip, and the needle was inserted to a depth of 5 mm at the center of the disc level through the annulus fibrosus into the nucleus pulposus. A small amount of gelatinous nucleus pulposus tissue was observed at the core of the needle. The nonpunctured discs L1/2 and L5/6 served as normal control discs.
2. Magnetic resonance imaging
The rabbits were euthanized four (n=6) and eight (n=6) post-surgery using an overdose intraperitoneal injection of ketamine hydrochloride. Immediately after euthanasia, MRI was performed using a 1.5-Tesla scanner (Signa HDx; GE Healthcare, Milwaukee, WI, USA) with a transmit-receive eight-channel knee coil.
High-resolution T2-weighted morphological images were acquired in the sagittal orientation prior toT1ρ and T2 mapping to select a slice that passed through the center of the IVD. T1ρ measurement was performed at the selected slice by three-dimensional spoiled gradient-recalled echo sequencing using the following parameters: echo time/repetition time (TE/TR)=3/6 ms; time of spin-lock (TSL)=0, 20, 40, and 60 ms; spin-lock frequency=500 Hz, resolution=0.36×0.36×3 mm3, and acquisition time=10 minutes. T2 measurement was performed at the selected slice by morphological imaging using two-dimensional multi-spin echo (MSE) sequence with the following parameters: TE/TR=10–90 (8 echoes)/1,500 ms, in-plane resolution=0.36×0.36 mm2, slice thickness=3 mm, and acquisition time=9 minutes.
T1ρ- and T2-calculated maps were generated using MATLAB software (Mathworks, Natick, MA, USA) with a monoexponential curve fit; SI (image intensity) (TSL)=S0 (spin-density)*exp (-TSL/T1ρ) and SI=S0*exp (–TE/T2), respectively. To minimize error from stimulated echoes in the T2 measurement, the first echo was excluded from the MSE sequence. Using MATLAB, color-coded T1ρ- and T2-calculated maps of the IVDs were created. An elliptical region of interest was manually positioned in the center of the IVD as follows: to exclude the noisy area, the upper and lower one-pixel thickness of each disc was removed; then, the discs were divided into three equal areas. The middle-third of the nucleus pulposus was designated by two authors (T.I. and M.M.). To standardize the procedure, all measurements were performed twice by both investigators and averaged. Intra- and interobserver agreements were assessed using percentages of agreement and kappa statistics. Mean T1ρ and T2 values were computed within the region.
3. Tissue processing, grading, and image analysis
Immediately after MRI, the lumbar discs were harvested and the slices were fixed in 4% paraformaldehyde (pH 7.4) for 48 hours. The discs were subsequently decalcified in 0.1 mol/L EDTA (ethylenediaminetetraacetic acid, pH 7.2) over a 4- to 10-week period, depending on the calcification of the osseous matrix of the vertebral bone. The decalcified complete sagittal disc slices were then embedded into paraffin. The slices were then macroscopically evaluated, and two authors (T.I. and M.M.) macroscopically assessed the degree of disc degeneration using the Thompson grading system [21]. The IVDs were classified as follows: grade 1: normal; grade 2: mild disc degeneration; grade 3: moderate disc degeneration; grade 4: severe; and grade 5: severe with osteophytes of >2 mm [21]. Both observers independently graded the degenerative discs twice with approximately one month between grading. Results from the first classification were used to evaluate interobserver agreement, and the level of agreement was assessed by kappa values. From the resulting blocks, paraffin sections were cut (2–4 µm thick) and placed on silanized glass slides. All specimens were treated for hematoxylin and eosin, safranin-O, and toluidine blue staining.
4. Statistics
Disc degeneration grades and histologic findings were compared using T1ρ and T2 values of each IVD by non-repeated measures analysis of variance and the Student–Newman–Keuls method. Correlation analysis of MRI and histology was performed using Spearman's correlation test. Statistical significance was set as p<0.05. Statistical software (JMP, ver. 9.0; SAS Institute Inc., Cary, NC, USA) and Microsoft Excel (Microsoft, Redmond, WA, USA) were used for analysis.
Results
Intra- and interobserver agreements with Thompson grades are summarized in Table1. The level of agreement was assessed by kappa values following criteria reported by Landis and Koch [22]: a negative kappa value was interpreted as poor agreement, 0.00–0.20 as slight agreement, 0.21–0.40 as fair agreement, 0.41–0.60 as moderate agreement, 0.61–0.80 as substantial agreement, and >0.81 as almost perfect agreement.
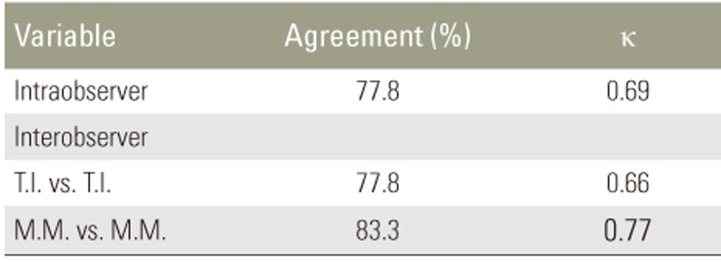
Intra- and interobserver agreement of the Thompson grades
The IVDs were categorized as Thompson grade 1 (n=24), grade 2 (n=14), grade 3 (n=16), grade 4 (n=6), and grade 5 (n=0). Compared to the normal IVDs, the injured IVDs showed a decrease in disc height and the degeneration of annulus fibrosus; this was macroscopically observed. The consequent disc degeneration became more severe as the number of punctures increased and when the larger needle was used (Fig. 1).
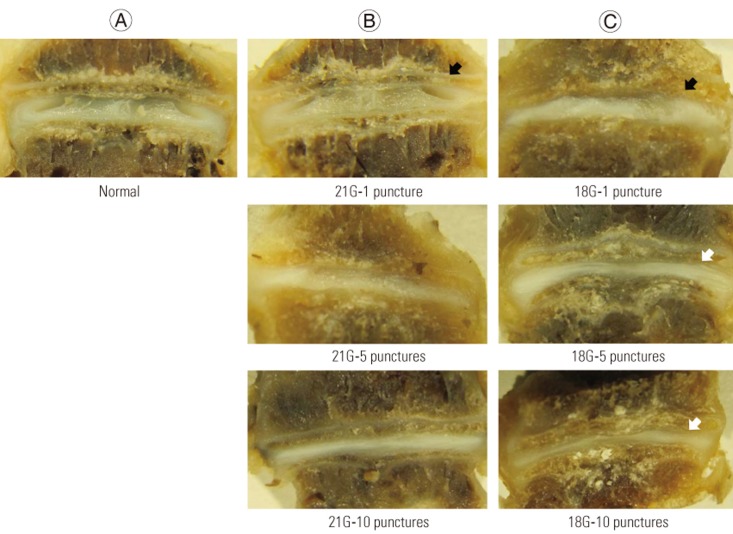
The intervertebral discs of each group. Disc height decreased using the larger needle (black arrow) as the number of punctures increased (white arrow). (A) Normal, (B) 21G needle (1, 5, and 10 punctures), and (C) 18G needle (1, 5, and 10 punctures). G, gauge.
In the histological study, compared to the normal IVDs, the injured IVDs showed a decrease in disc height, consolidation of fibrous tissue in the nucleus pulposus, and cartilage disorganization of the annulus fibrosus (Fig. 2). (A, D, G, J: normal disc; B, E, H, K: disc of the 4-week group punctured by the 21-gauge needle; C, F, I, L: disc of the 8-week group punctured by the 18-gauge needle; A, B, C, J, K, L: hematoxylin and eosin staining; D, E, F: safranin-O staining; G, H, I: toluidine blue staining). Compared to the normal controls, the injured IVDs showed decreased disc height (black arrow), consolidation of fibrous tissue in the nucleus pulposus (white arrow), and cartilage disorganization within the annulus fibrosus (black arrowhead). As in the macroscopic study, these changes became more severe as the number of punctures increased and when the larger needle was used (Fig. 2).
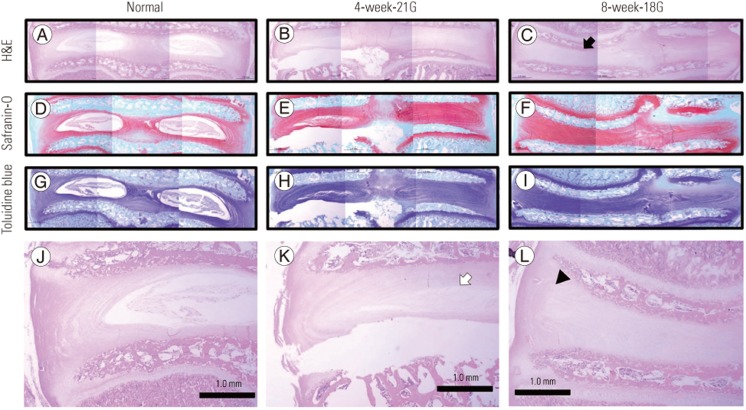
(A–L) Representative histology of the intervertebral disc. G, gauge.
Representative T1ρ and T2 color maps of the different grades of injury overlaid on magnetic resonance (MR) images with T2-weighted images are shown in Fig. 3. Punctured discs are indicated by arrows. The mean T1ρ values in the IVDs are as follows: grade 1: 179.3±33.7 ms, grade 2: 144.8±48.7 ms, grade 3: 98.9±7.4 ms, and grade 4: 76.1±10.5 ms (Table 2). The mean T2 values in the IVDs are as follows: grade 1: 65.5±9.5 ms, grade 2: 59.0±9.3 ms, grade 3: 45.2±9.5 ms, and grade 4: 38.3±4.4 ms (Table 2). T1ρ and T2 values decreased as the grade of degeneration increased.
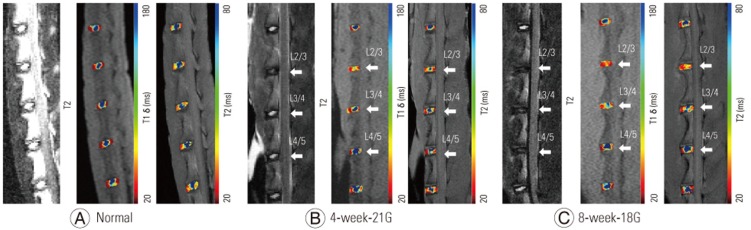
(A–C) Representative color maps with different grades of injury. Punctured intervertebral discs are indicated as arrows. Blue represents areas of short T1ρ and T2 values, and red represents areas of long T1ρ and T2 values. G, gauge.

Mean T1ρ and T2 values in each Thompson grade
Figs. 4 and 5 display the median T1ρ and T2 values of the IVDs, respectively. There were significant differences between grade 1 and grade 2 IVDs (p<0.05), grade 1 and grade 3 IVDs (p<0.01), grade1 and grade 4 IVDs (p<0.01), grade 2 and grade 3 IVDs (p<0.05), and grade 2 and grade 4 IVDs (p<0.05) in terms of T1ρ values (Fig. 4) and between grade 1 and grade 3 IVDs (p<0.01), grade 1 and grade 4 IVDs (p<0.01), grade 2 and grade 3 IVDs (p<0.01), and grade 2 and grade 4 IVDs (p<0.01) in terms of T2 values (Fig. 5). There was a significant difference between grade 1 and grade 2 IVDs only in terms of T1ρ values (Fig. 4). Correlation analysis showed a positive linear relationship of Thompson grades with T1ρ values (p<0.05) and T2 values (p<0.05) (Figs. 4, 5). T1ρ and T2 values in each IVD and the Thompson grade of each IVD are indicated in Table 3.
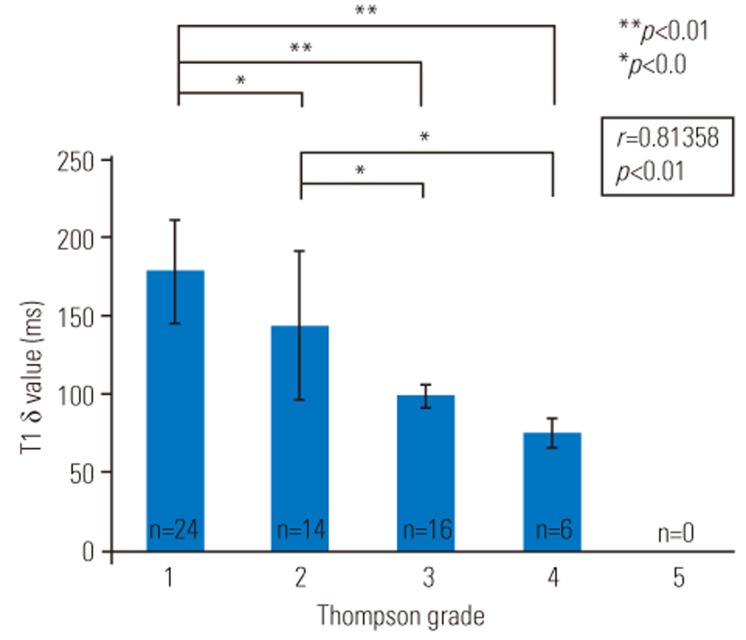
Mean T1ρ values (±standard deviation) for each Thompson grade. Regression analysis showed a negative linear relationship of the Thompson grade with T1ρ values (p<0.05).
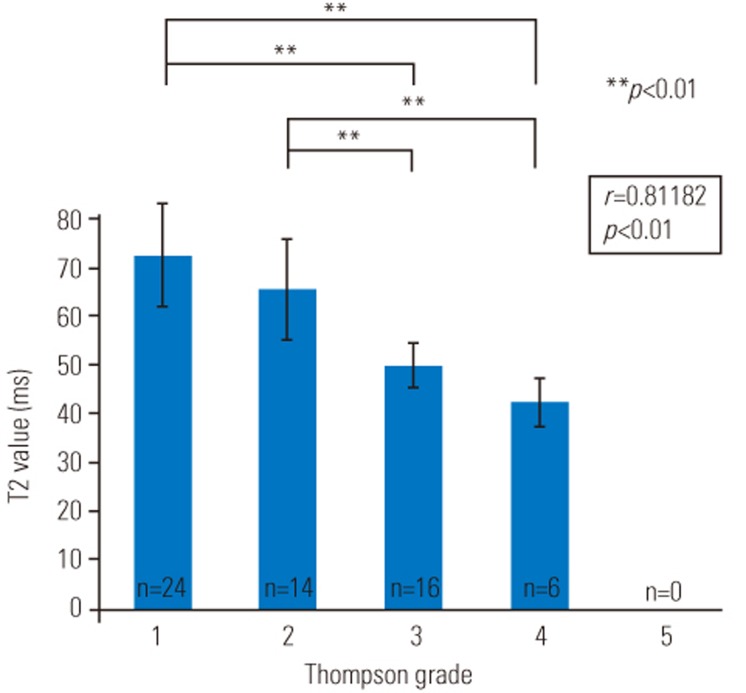
Mean T2 values (±standard deviation) for each Thompson grade. Regression analysis showed a negative linear relationship of the Thompson grade with T2 values (p<0.05).
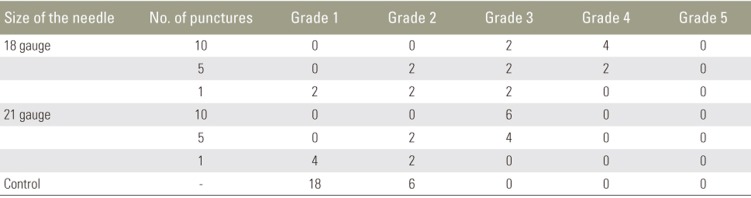
The Thompson grade of each intervertebral disc
Discussion
The present study investigated the effectiveness of quantitative T1ρ/T2 MRI of the IVD and evaluated the associations between MRI findings (T1ρ and T2), imaging parameters (Thompson grade), and histological changes. Three primary findings were obtained. First, though not significant, disc degeneration became more severe as the number of punctures increased and when the larger needle was used. Second, both T1ρ and T2 quantitative MRI could detect these small differences, and these degenerative changes were also observed in the histological study. Third, T1ρ mapping seems to have an advantage over T2 mapping for detecting the early degenerative changes of IVDs.
A rabbit model of disc degeneration by an annular needle puncture was established by Masuda et al. [18] to induce slow, mild, and reproducible disc degeneration [1920]. Extrusion of the nucleus pulposus made by a 5-mm deep needle puncture induces disc degeneration in this model; this was subsequently validated histologically, radiographically, and by MRI [19]. In the current study, during both macroscopic and histologic examinations, compared to the normal IVDs, we observed a decrease in disc height and degeneration of the annulus fibrosus in the injured IVDs. IVD degeneration became more severe as the number of punctures increased and when the larger needle was used. These results suggest that we are able to control the degree of IVD degeneration in this model.
In the present study, intra- and interobserver errors were small as indicated by kappa values for Thompson grades. This result indicates that Thompson grades are appropriate measures for evaluating IVD degenerative changes in this model.
Although T1ρ and T2 values were significantly different between grade 1 or grade 2 IVDs and grade 3 and grade 4 IVDs, there was a significant difference between grade 1 and grade 2 IVDs only in terms of T1ρ values (Fig. 3). T1ρ values in grade 2 IVDs were significantly lower than those in grade 1 IVDs. These data suggest that T1ρ mapping is more sensitive to early degenerative changes than T2 mapping. Nguyen et al. [14] demonstrated that T1ρ-weighted MRI is directly correlated with isometric swelling pressure of cadaveric discs and suggested that it is a valuable quantitative biomarker of the mechanical function of the nucleus pulposus. Zobel et al. [11] reported that T1ρ values correlate with the Pfirrmann degenerative grade in young adults; however, the Pfirrmann grading system could not detect early degenerative changes. The Pfirrmann grading system is a semiquantitative assessment of morphologic IVD degeneration using T2-weighted MRI [1017]. T1ρ mapping might be useful for assessing early degenerative changes. Blumenkrantz et al. [12] observed a correlation between T1ρ mapping and clinical findings quantified by the 36-Item Short Form Health Survey and Oswestry Disability Index in 16 patients. T1ρ values also correlated with patient-reported physical activity and disability [12]. Zuo et al. [16] reported that magnetic resonance spectroscopy (MRS)-quantified water, MRS-quantified proteoglycan (PG), water/PG ratio, and the Pfirrmann grade were significantly associated with clinical self-assessment and that the T1ρ value was significantly associated with MRS-quantified PG content. Another reason why T1ρ mapping may be more sensitive than T2 mapping is that T1ρ mapping has a higher dynamic range for detecting early pathology. This higher dynamic range can be exploited to more accurately measure even small macromolecular changes [1516]. Therefore, there is a possibility that T1ρ mapping is sensitive to early degenerative changes and correlates with clinical symptoms in patients with IVD degeneration.
Our results showed a significant positive linear relationship of Thompson grades with T1ρ and T2 values. Previous studies conducted using cartilage have shown that T2 mapping is highly related to collagen integrity while it is not very sensitive to changes in macromolecules such as PG [2324]. Axial T2 mapping can provide a useful noninvasive evaluation of the matrix status in IVDs and be a useful indicator of disc function [25]. Thus, assessing IVD degeneration using T1ρ and T2 mapping may increase our current understanding of degenerative processes. IVD assessment using T1ρ mapping will help evaluate new therapies for treating IVD degeneration, such as tissue engineering strategies, recombinant growth factor injection, gene therapies, and stem cell therapies [2627282930].
There are some limitations to this study. First, we only assessed the status of IVDs at 4 and 8 weeks post injury. These early time points after injury are important for evaluating early degenerative changes. Second, different sequences were used for the two MR parameter measurements: spin-preparation spoiled gradient-recalled echo in T1ρ mapping and multi-echo spin echo in T2 mapping. Depending on the MR acquisition method, MR parameters and the sensitivity to degeneration can be changed.
Conclusions
The evaluation of IVD degeneration using T1ρ and T2 mapping may be a future clinical tool for identifying IVD degeneration in patients. T1ρ mapping might be more sensitive than T2 mapping for evaluating early degenerative changes in lumbar IVDs. Though the relevance of early degenerative changes in humans is controversial, T1ρ mapping as a new emerging MRI technique might be more relevant for basic research such as biological disc treatment and cell therapy approaches. Consequently, specimens obtained using this method may be easier to analyze than human tissues.
Notes
Conflict of Interest: No potential conflict of interest relevant to this article was reported.