

Introduction
Mesenchymal stem cells (MSCs) have an important role in the repair of musculoskeletal tissues because they have been shown to have the ability to differentiate into chondrocytes and the osteoblasts when re-implanted in vivo. Since the development of the field of tissue engineering and modern repair concepts, it has been shown clinically that mobilization and differentiation of these cells is important in the repair of fracture-nonunion and bone defects. The importance of bone marrow-derived MSCs in the repair of various tissues has been highlighted by their ability to differentiate into mesenchymal tissue1. In addition, according to and various clinical studies2-5, those cells from bone marrow can be cultured and differentiated in vitro and utilized to diagnose the osteogenic potential of donors.
The decrease in osteogenic potential is the main manifestation of bone loss in aging and in patients with osteoporosis6-9. Many studies have shown that the decrease in osteogenic potential with aging is due to a reduction in the number of osteogenic progenitor cells due to degeneration of MSCs, which leads to a decreased number of mature osteoblasts7,10,11. Some studies, however, have shown that the number and the differentiation capacity of osteogenic stem cells is maintained with aging12,13.
The change in human bone mass caused by a break in the coupling of bone formation to bone resorption influences bone density. Over the past decade, bone density scanning machines have come to be widely used for the evaluation of patients at risk of osteoporosis. The most populated quantitative method to examine the bone density of human clinically is the dual energy X-ray absorptiometry, due to its many advantages, such as short duration of the procedure, low precision error, and low risk of radiation exposure14.
The present study was designed to determine the effectiveness of bone mineral density measurement as a supplementary tool for evaluation of osteogenic potential in patients with spinal fusion using correlation analysis between bone mineral density and the osteogenic potential from cultured mesenchymal stem cells (MSCs).
Materials and Methods
1. Inclusion criteria
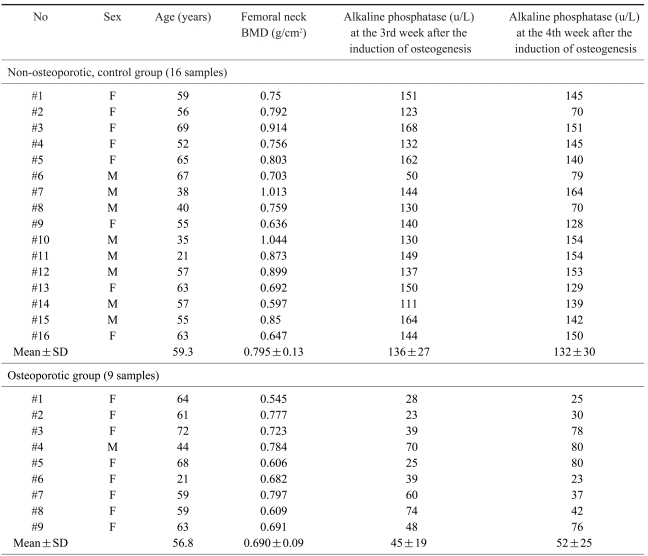
Human bone marrow was obtained from the iliac crest of twenty-five patients during lumbar spine surgery. The patients were twenty one to seventy two years old; there were 9 males and 16 females. The bone mineral density of the femoral neck by Dual Energy X-ray Absorptiometry (DEXA, Hologic®, QDR-4500, USA) was measured preoperatively and the osteoporotic group was defined as those who had a T-score below -2.5 points in the femoral neck. The osteoporotic group consisted of 9 patients and the nonosteoporotic, control group (T score above -2.5 points) consisted of 16 patients.
2. MSCs isolation and cultivation
A 14-gauge needle was used to penetrate the cortex of the ilium, and five to eight milliliters of bone marrow was aspirated into a syringe containing 100 units of heparin. The aspirate was suspended with Dulbecco's Modified Eagles Medium-Low Glucose (DMEM-LG; Gibco® BRL, Grand Island, NY, USA) and centrifuged at 600 X g using a 70% sperm gradient (PureSperm® 100). MSCs were plated onto dishes (75 cm2), mixed with DMEM-LG solution, streptomycin (100 ug/mL, Gibco® BRL) and 10% fetal bovine serum, and grown at 37°, in an atmosphere containing 5% carbon dioxide. On the 6th day of culture, half of the supernatant was eliminated, and the media was changed every 2 or 3 days. Then cell aggregates were obtained at intervals up to twenty days (14~20 days, mean=16 days) for primary culture. To obtain enough cells, MSCs were suspended and sub-cultured. As soon as cultured cells fully filled the bottoms of dishes, cells were suspended and centrifuged. The cultured MSCs were cryopreserved at-70° and thawed for experiments.
3. Induction of osteogenesis from cultured MSCs
The frozen MSCs were thawed and suspended in DMEM-LG solution and 10% fetal bovine serum, and using a cytocounter we counted the number of normal shaped stem cells. For RT-PCR experiments, MSCs were cultivated in 75 cm2 dishes at a density of 1×10⁶ cells/cm2. For assays of alkaline phosphatase activity or chemical staining, MSCs were cultured in 6-well (10 cm2) dishes at a density of 3×10⁶ cells/cm2 for 24 hours, and mixed with osteogenesis inducing materials, such as 100 nM dexamethasone (Sigma® Chemical, USA), 0.05 mM L-ascorbic acid-2-phosphate (Gibco® BRL) and 10 mM beta-glycerophosphate (Sigma® Chemical).
The MSCs used for the control experiment were cultivated in a similar manner but with DMEM-LG solution and 10% fetal bovine serum only, without the presence of osteogenesis inducing materials.
4. Evaluation of osteogenic potential
A. Mineral staining (von Kossa method)
Selected specimens were subsequently stained for mineral deposits by the von Kossa method15. Phase contrast microscopy demonstrates the von Kossa staining mineral.
B. Osteoblast-specific gene expression in RT-PCR
Isolation of total RNA was performed using Trizol solution (Life technologies, USA) by a modification of the method of Cassiede et al.16. Electrophoresis of specimens was done in 1.2% agarose gel, at 100 V, with a mixture of 15 uL of PCR products and 2 uL of 6×loading buffer. We examined the amplified products under a UV-Trans illuminator after staining with 1 ug/mL Et Br (Ethidium Bromide; Sigma® Chemical, USA).
C. The assay of alkaline phosphatase activity
Cultured osteogenic progenitor cells were rinsed with Tyrode's solution twice. Alkaline phosphatase activity, an index of osteoblastic differentiation, was assayed by the EIA method15.
5. Chromosomal analysis of cultured MSCs
Chromosomal analysis was performed with a modification of the method of Moorhead9. The cytovision system was used to analyze karyotypes. The normal karyotype was noted by G-banding. No specific chromosomal abnormality was observed during culture, subculture and cryopreservation.
6. Statistical analysis
The results are expressed as mean with standard deviation. We analyzed the differences in the expression of osteocalcin and the activity of alkaline phosphatase between the osteoporotic and the non-osteoporotic group using the Mann-Whitney test. We investigated 25 samples, regardless of groups, to determine the correlation between the activity of alkaline phosphatase of bone marrow-derived MSCs and BMD of femoral neck, and between the activity of alkaline phosphatase of bone marrow-derived MSCs and age. Statistical analyses were performed using SPSS (version 12.0, Korean).
Results
1. Bone mineral density of the non-osteoporotic control group and the osteoporotic group
The average BMD of the femoral neck region in the non-osteoporotic control group (16) was 0.759±0.13 g/cm2; in the osteoporotic group (9) it was 0.690±0.09 g/cm2. The difference between groups was statistically significant (p<0.05).
2. Culture of bone marrow-derived MSCs and induction of osteogenesis
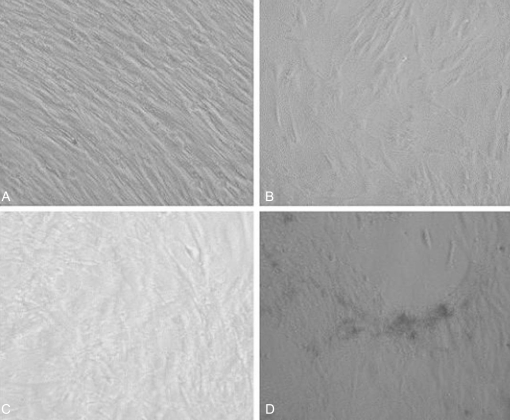
After 2 weeks of culture, an adequate number of MSCs were achieved in the dishes (75 cm2). After adding osteogenesis inducing materials, bone formation was induced (Fig. 1) and reached peak level by the 3rd week after the induction of osteogenesis (Table 1). Bone formation, however, was not induced in the MSCs unless osteogenesis inducing materials were added.
3. Mineral staining
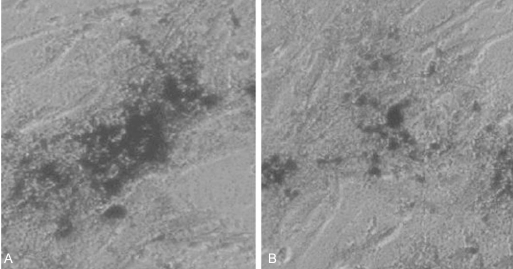
By the 3rd week after the induction of osteogenesis, there was a positive result of mineral staining, which increased with time. There were a number of dark stains of mineral deposition in the non-osteoporotic, control group (Fig. 2A). In contrast, there was a scanty matrix mineral deposition in the osteoporotic group (Fig. 2B).
4. Osteoblast-specific gene expression in RT-PCR
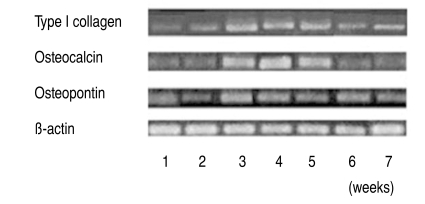
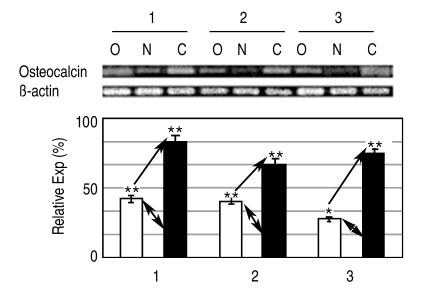
The expression of osteogenic specific genes in RT-PCR, such as Type I collagen, Osteocalcin and Osteopontin, proteins that exist only in osteoblasts, reached peak levels by the 3rd & 4th weeks after the induction of osteogenesis, and then decreased slightly (Fig. 3). In the electrophoresis of PCR products, the expression of Osteocalcin in the osteoporotic group was 1.5 to 3 times less than in the non-osteoporotic control group (Fig. 4).
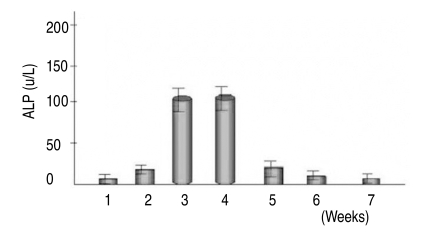
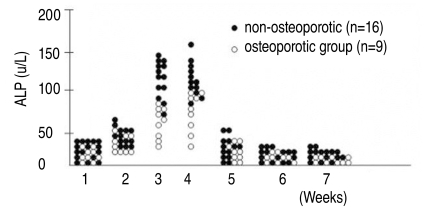
5. Alkaline phosphatase activity of bone marrow-derived MSCs
Quantitative assays of alkaline phosphatase activity in the non-osteoporotic, control group, showed that peak levels were reached by the 3rd & 4th weeks after the induction of osteogenesis, and abruptly decreased thereafter (Fig. 5). In the non-osteoporotic control group, alkaline phosphatase activity was 136±7 U/L by the 3rd week, and 132±30 U/L at the 4th week after the induction of osteogenesis. In the osteoporotic group, alkaline phosphatase activity was 45±19 U/L at the 3rd week, and 52±25 U/L at the 4th week after the induction of osteogenesis (Fig. 6).
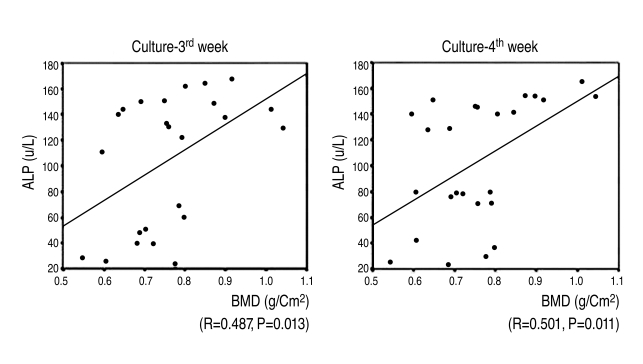
6. Correlation between alkaline phosphatase activity of bone marrow-derived MSCs and femoral neck BMD
Alkaline phosphatase activity increased as femoral neck BMD increased by the 3rd & 4th weeks after the induction of osteogenesis. There was a statistically significant and positive correlation between femoral neck BMD & alkaline phosphatase activity by the 3rd & 4th weeks after the induction of osteogenesis (r=0.487, 3rd week; r=0.501, 4th week) (Fig. 7).
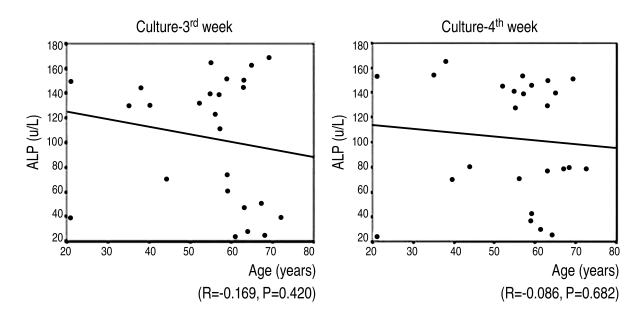
7. Correlation between alkaline phosphatase activity of bone marrow-derived MSCs and age
The mean age of the osteoporotic group (9) was 56.8; it was lower than the mean age, 59.3, of the control group (16). There was no statistically significantly correlation between the patients' age and their alkaline phosphatase activity at the 3rd & 4th weeks after the induction of osteogenesis (r=-0.169, 3rd week; r=-0.086, 4th week) (Fig. 8).
Discussion
Bone marrow-derived MSCs which originate from stromal tissue are undifferentiated progenitor cells that have the pluripotentiality to differentiate into osteogenic cells, chondrogenic cells, adipose tissue, fibroblasts and reticular cells17. After culturing and the proliferation of osteogenic progenitor cells, they can be clinically implanted into the bone defect of nonunion and around orthopaedic implants for bone healing17,18. In addition, cells from bone marrow can be cultured and differentiated in vitro and utilized to diagnose the osteogenic potential of donors2,3. Generally, the change of bone mass arises from the imbalance of coupling of bone formation to bone resorption, and bone mineral density is easily used for measuring of bone mass clinically. If we know the osteogenic potential in patients who will expect a pseudoarthrosis of spinal fusion, it may provide useful information to clinicians so that they can decide on proper treatment strategies. Is it possible to use bone mineral density for evaluation of osteogenic potential of the host as an osteogenic potential of cultured MSCs?
Many studies have been performed to examine the correlation between osteogenic potenial of in vitro cultured MSCs and aging10,19. D'Ippolito et al.10 reported that the number of MSCs with osteogenic potential decreases early during aging in humans and may be responsible for the agerelated reduction in osteoblastic number. Oreffo et al.20 suggested that reduction in bone mass with aging may be due to reduction of the proliferative capacity of progenitor cells or their responsiveness to biological factors, and result in alterations in subsequent differentiation. In contrast, some studies have shown that the number and differentiation capacity of osteogenic stem cells is maintained with aging12,13. The present study found no significant correlation between alkaline phosphatase activity and aging. It is generally accepted that the degeneration of osteogenic progenitor cells occurs with aging. Considering that a few old patients maintain good bone mass, however, this author would suggest that the evaluation of osteogenic potential is relevant when bone mass is assessed by BMD rather than by age.
Osteoporosis is a condition of decreased bone mass leading to reduced bone density. Justesen et al.21 reported that MSCs maintain their differentiation potential during aging and in patients with osteoporosis. However, many authors reported a reduction in the number of osteogenic progenitor cells, leading to reductions in osteoblast number and alkaline phosphatase activity in osteoporosis10,11,19,20,22. Rodriguez et al.23 reported that osteoporotic and control stem cells have similar morphology and size and express similar cell surface antigens, but MSCs from osteoporotic women differ from controls in having a lower growth rate than control cells, being refractory to the mitogenic effect of IGF-1, and being less able to differentiate into the osteogenic lineage as evidenced by alkaline phosphatase activity. In this study, MSCs in the osteoporotic group differentiated into osteoblasts, but their potential to differentiate decreased significantly more than did the control group, as evidenced by alkaline phosphatase activities by the 3rd & 4th weeks after induction of osteogenesis (p<0.05). In all 25 specimens, however, a positive correlation between femoral neck BMD and alkaline phosphatase activity was observed (p<0.05). A similar correlation was shown in osteoblast-specific gene expression by RT-PCR.
This study had limitations. First, we did not measure number and colony forming units of MSCs, which are traditional methods for evaluating osteogenic potentials. As number and colony forming units of MSCs are commonly obtained by the treating researchers, they can lead to bias in analyzing the data. We assayed the activity of alkaline phosphatase of cultured MSCs in vitro as a way of doing quantitative analysis of osteoblastic differentiation instead of investigating the number and colony forming units of MSCs. Second, we did not analyze the distribution of age and sex between the two groups to compare outcomes. Third, there was small case.
Considering the positive correlation between BMD and the osteogenic potential of bone marrow-derived MSCs, the osteogenic potential of patients can be predicted by measurement of their BMD. To provide more evidence for a correlation between BMD and the osteogenic potential of MSCs, however, it will be necessary to run additional, clinically relevant studies such as ones on the relation between pseudoarthrosis and bone mineral density, and risk guidance of bone mineral density for a pseudoarthrosis.
Conclusions
In the present study, in vitro osteogenesis was successfully induced from bone marrow-derived mesenchymal stem cells, and the osteogenic potential of MSCs decreased in osteoporotic patients. The study revealed a positive correlation between bone mineral density and osteogenic potential from MSCs. The measurement of BMD can thus provide supplementary data for evaluating osteogenic potential clinically.