Localizing Value of Pain Distribution Patterns in Cervical Spondylosis
Article information
Abstract
Study Design
Prospective observational study.
Purpose
To investigate the value of pain distribution in localizing appropriate surgical levels in patients with cervical spondylosis.
Overview of Literature
Previous studies have investigated the value of pain drawings in its correlation with various features in degenerative spine diseases including surgical outcome, magnetic resonance imaging findings, discographic study, and psychogenic issues. However, there is no previous study on the value of pain drawings in identifying symptomatic levels for the surgery in cervical spondylosis.
Methods
The study collected data from patients with cervical spondylosis who underwent surgical treatment between August 2009 and July 2012. Pain diagrams drawn separately by each patient and physician were collected. Pain distribution patterns among various levels of surgery were analyzed by the chi-square test. Agreement between different pairs of data, including pain diagrams drawn by each patient and physician, intra-examiner agreement on interpretation of pain diagrams, inter-examiner agreement on interpretation of pain diagrams, interpretation of pain diagram by examiners and actual surgery, was analyzed by Kappa statistics.
Results
The study group consisted of 19 men and 28 women with an average age of 55.2 years. Average duration of symptoms was 16.8 months. There was no difference in the pain distribution pattern at any level of surgery. The agreement between pain diagram drawn by each patient and physician was moderate. Intra-examiner agreement was moderate. There was slight agreement of inter-examiners, examiners versus actual surgery.
Conclusions
Pain distribution pattern by itself has limited value in identifying surgical levels in patients with cervical spondylosis.
Introduction
There are a wide variety of options for the treatment of cervical spondylosis. In certain cases, when conservative treatment fails, surgical intervention is the treatment of choice. A combination of clinical information and investigational data is needed to choose appropriate surgical levels. However, even with the advent of advanced neuroimaging and electrodiagnostic technologies, selection of the symptomatic levels for surgery considerably depends on patient's symptoms and physical examination [1]. Cervical spondylosis typically presents with pain, sensory deficit, weakness, spasticity, or a combination of these symptoms. Among these clinical manifestations, pain is challenging to interpret and its value in localizing symptomatic levels is questionable [2]. The authors investigated the value of pain distribution patterns in patients with cervical spondylosis. The aim of this study was to investigate the value of pain distribution patterns in localizing proper surgical levels in patients with cervical spondylosis.
Materials and Methods
This study was conducted at the Neurosurgical Unit of King Chulalongkorn Memorial Hospital. Subjects were prospectively evaluated and recruited from among consecutive patients with cervical spondylosis who were hospitalized in the neurosurgical service for cervical spine surgery from August 2009 to July 2012. The decision making for surgical intervention was conducted in the clinic. The indications for surgery included (1) radicular pain resistant to at least 12 weeks of conservative treatment; (2) myelopathy; (3) progressive motor weakness. The levels of surgery were also pre-determined in the clinic by an attending neurosurgeon based on clinical data, radiographic studies, and supplemental electrodiagnostic studies in selected cases. Patients who had no pain as part of symptoms were excluded. Patients who had a history of cervical spine surgery, rheumatologic diseases, spinal trauma, spinal tumor, C1-2 pathology, or were unable to provide reliable information about pain were also excluded from the study.
After the patients gave their consent to participate in the study, general clinical information, and information about the duration of symptoms, visual analogue scale for pain, presence of sensory deficit, and motor weakness was collected.
First, patients were asked to complete a blank body-part diagram, which indicated the pain location (Fig. 1). They were specifically instructed to mark the location of pain only, and not that of "numbness" or "weakness".
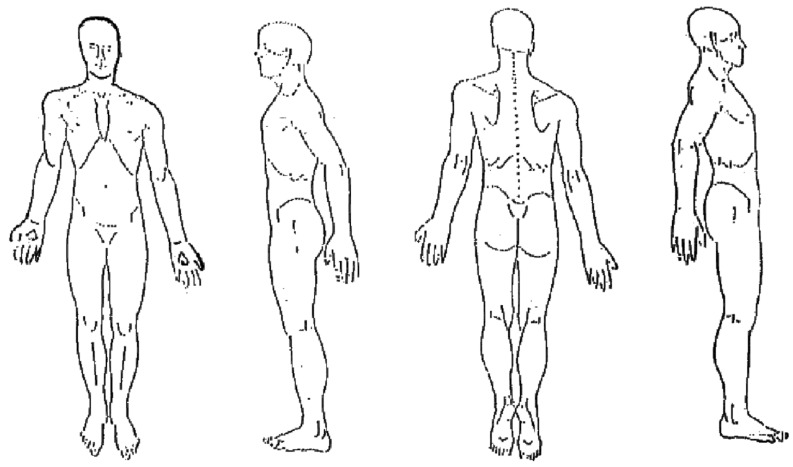
Blank body part diagram used by patients and physicians.
Once each patient had marked the pain location on the diagram, a second, physician-drawn diagram was blindly completed by the physician who performed routine patient history taking and physical examination.
The institutional preference was to use the modified Smith-Robinson technique for treating cervical spondylosis. Full details of this technique have been described in previous studies [3]; however, the following is a brief description: disk space was approached via collar incision on the right side. Platysma muscle was incised along the direction of its fibers. The avascular plane between carotid sheath laterally and esophagus/larynx medially was used to approach the anterior surface of the spinal column. The level of the disk was confirmed by fluoroscopy. A spinal curette was used to remove the disk material and to prepare endplates for subsequent fusion. Once the majority of the disk was removed, further removal of the remaining disk, posterior osteophytes, and posterior longitudinal ligament was carried out under microscopy in order to complete the decompression of the spinal cord centrally and nerve roots at the neural foramen laterally. After neural decompression was complete at all desired level(s), fusion was performed using polyetheretherketone (PEEK) cage (Fidji cervical cage, Zimmer spine, Bordeaux, France) filled with calcium phosphosilicate particles (Novabone, Musculoskeletal Transplant Foundation, Edison, NJ, USA). Additional plates may be used at the surgeon's discretion. A drain was placed in all cases and it was removed the next day. Cervical collar was seldom used in the postoperative period. Routine activities and diet were allowed as tolerated.
Patients were re-evaluated at 1 week and 1 month following the surgery. This study was not intended to investigate the lasting effects of the surgery; therefore, the authors focused only on short-term outcomes. This study was approved by the institutional review board.
1. Data analysis
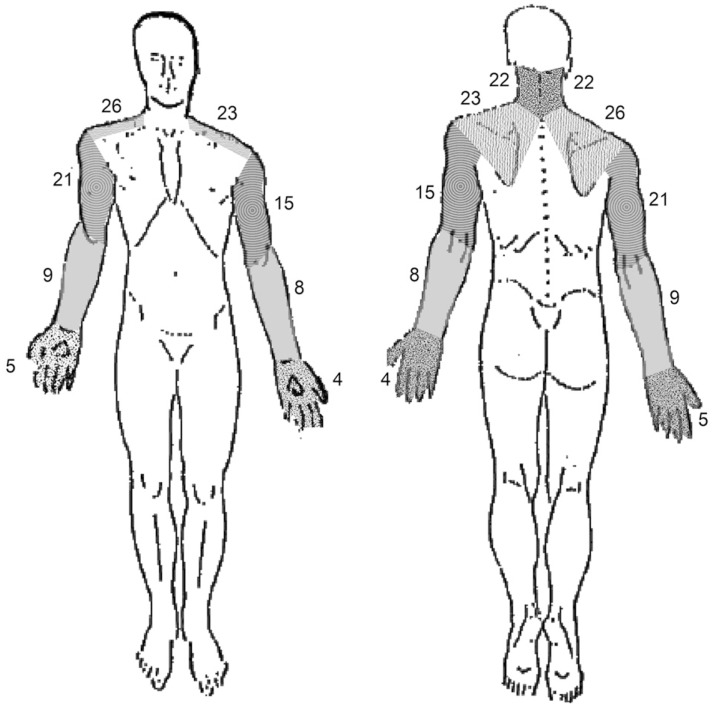
There were two parts of data analysis. 1) Pain diagrams were divided into the following 5 regions according to the common pain distribution area: neck, shoulder/scapula, arm, forearm, and hand/fingers (Fig. 2). A transparent sheet with boundaries of 5 regions was placed over each pain diagram to analyze the frequency of pain in each region. Although data on pain was collected from both sides, no differentiation was made between unilateral and bilateral pain. Based on these classified regions, two analyses were performed (1) the difference in pain location among various levels of surgery (2) agreement between patient-drawn diagrams and physician- drawn diagrams.

Classified region of pain: A, neck; B, shoulder/scapula; C, arm; D, forearm; E, hand/fingers.
2) The original pain diagrams drawn by patients were presented to two spine surgeons who were blinded to clinical data of the patients. Based on the pain diagram of each patient, each surgeon was asked to identify the "symptomatic level(s)" which would be chosen for surgery. The possible responses included C3-4, C4-5, C5-6, C6-7, C7-T1, or any combination of these, and "I cannot tell". This test was repeated for each surgeon two weeks later. Analyses of agreement were made for (1) intra-examiner, (2) inter-examiner, (3) between each examiner, and actual surgery.
2. Statistical analysis
IBM SPSS ver. 20 software (IBM Co., Armonk, NY, USA) was used for statistical analysis. Chi-square test was used to analyze the difference in pain distribution among levels of surgery. A p-value <0.05 was considered statistically significant. Kappa coefficient was used to analyze the inter-examiner and intra-examiner agreement on interpretation of pain diagrams and agreement between examiners' interpretation and actual surgery.
Results
From August 2009 to July 2012, 156 cases of cervical spondylosis were admitted for surgery. Of these 156 patients, 76 patients did not have any pain (purely myelopathic), 18 patients met other exclusion criteria (8 patients had history of previous surgery, 3 patients had spinal tumor, 3 patients had trauma, 2 patients had rheumatoid arthritis, 2 patients had cognitive impairment), and 12 patients declined to participate in this study, leaving 50 patients for data collection. Three patients had incomplete data on pain. Data of the remaining 47 patients were available for analysis. Demographic and clinical data of these patients are presented in Table 1.
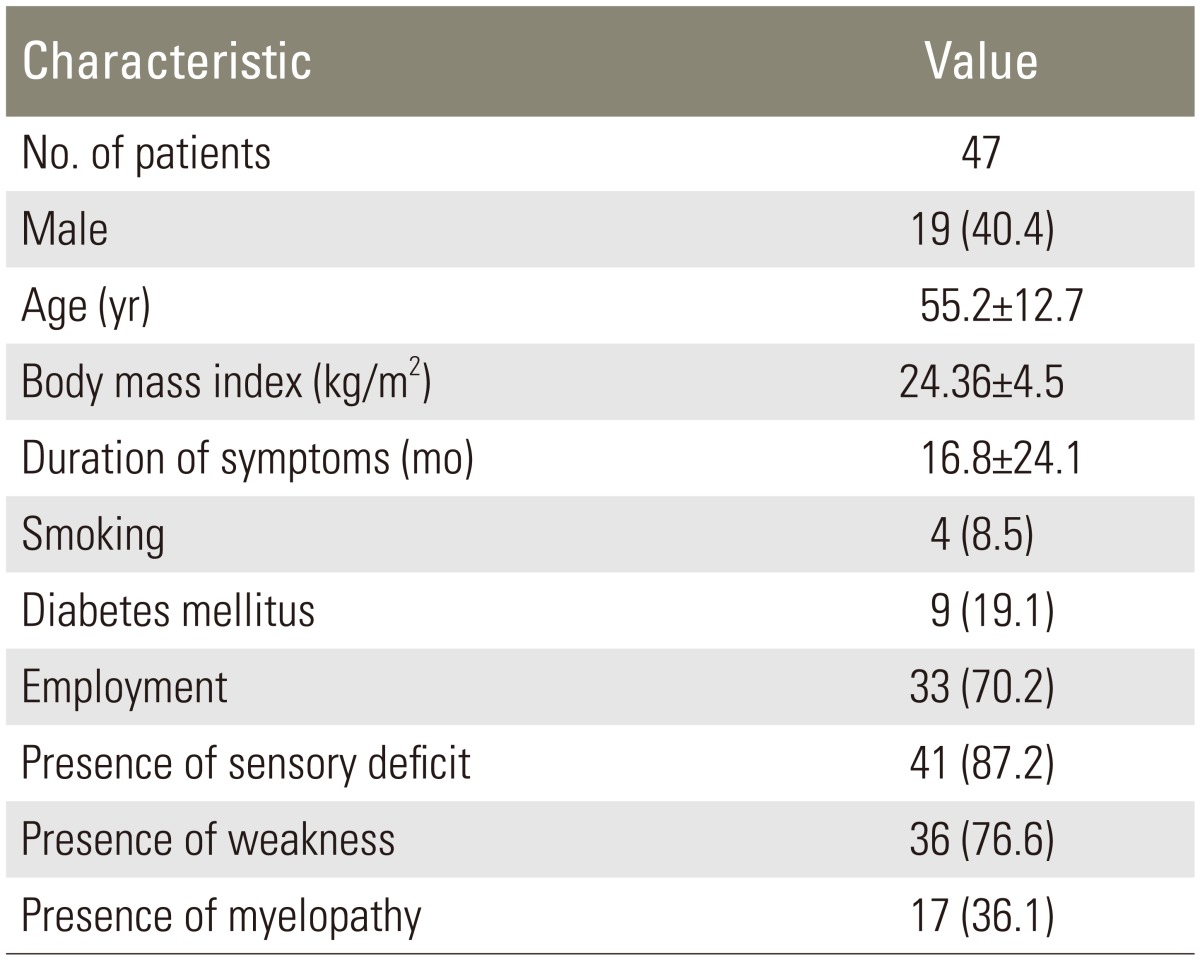
Demographic and clinical data of patients
Accumulated pain frequency in the 5 classified regions is shown in Fig. 3. Pain was predominantly located in the area of neck and shoulders. Among these 47 cases, the pain was located strictly on the right side in 21 cases, the pain was strictly located on the left side in 14 cases, the pain was symmetrically bilateral in 9 cases, and the pain was asymmetrically bilateral in 3 cases.
Accumulated frequency of pain in different classified regions.
All patients underwent anterior cervical discectomy and fusion. Twenty-eight cases (59.6%) underwent single- level surgery. Sixteen (34%) and three (6.4%) cases underwent 2- and 3-level surgery, respectively. Ten cases also required cervical plates. Distribution of level of surgery is shown in Table 2.
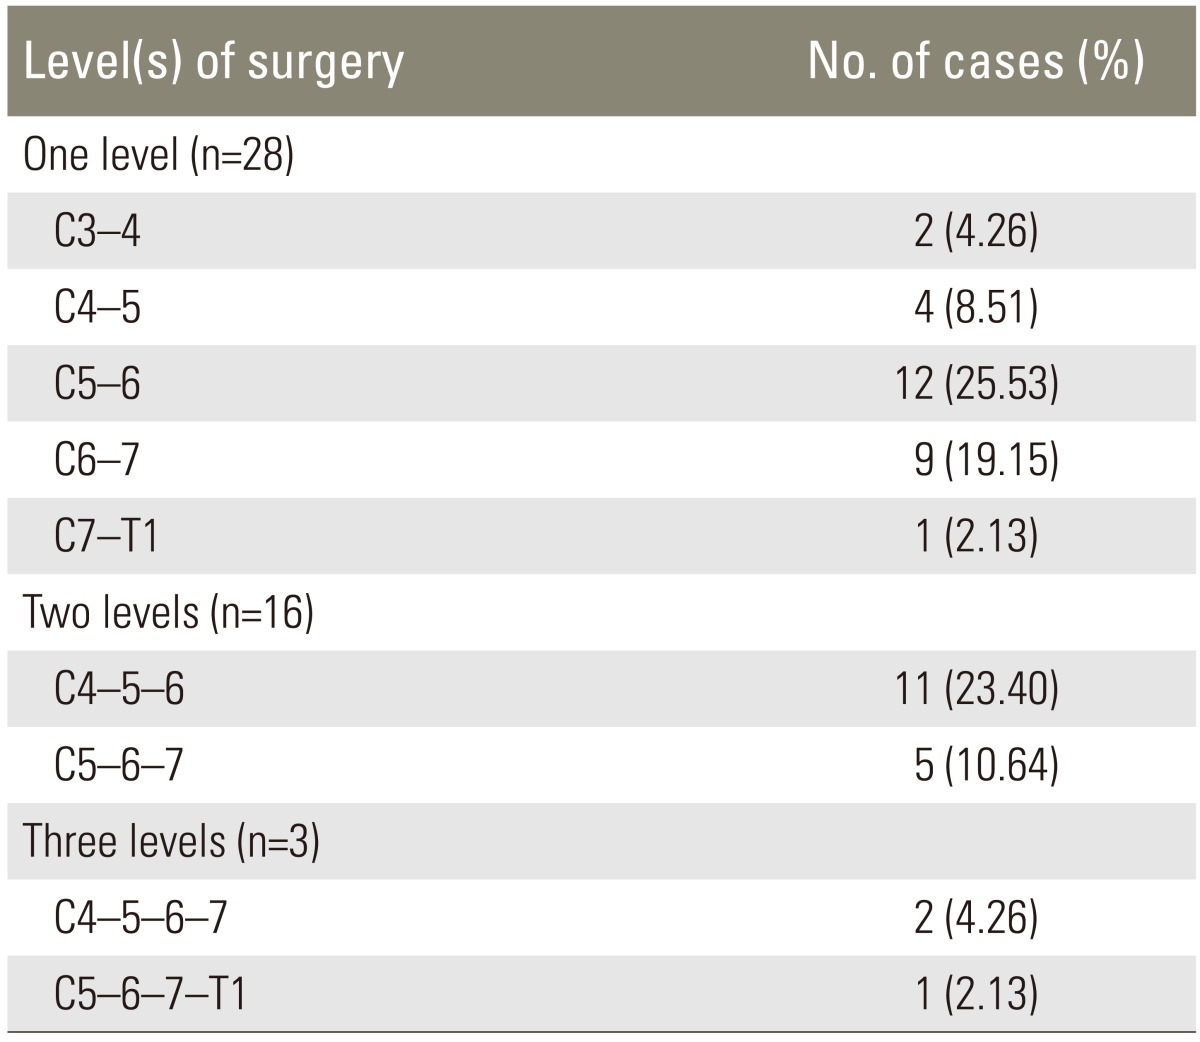
Distribution of level of surgery
The number of cases that returned for follow up at 1 week and 1 month was 41 and 40 cases, respectively. Postoperative pain relief of at least 50% was achieved in 85% and 80% of the patients at the 1 week and 1 month follow-up, respectively. Results of surgery in terms of pain relief are shown in Table 3.
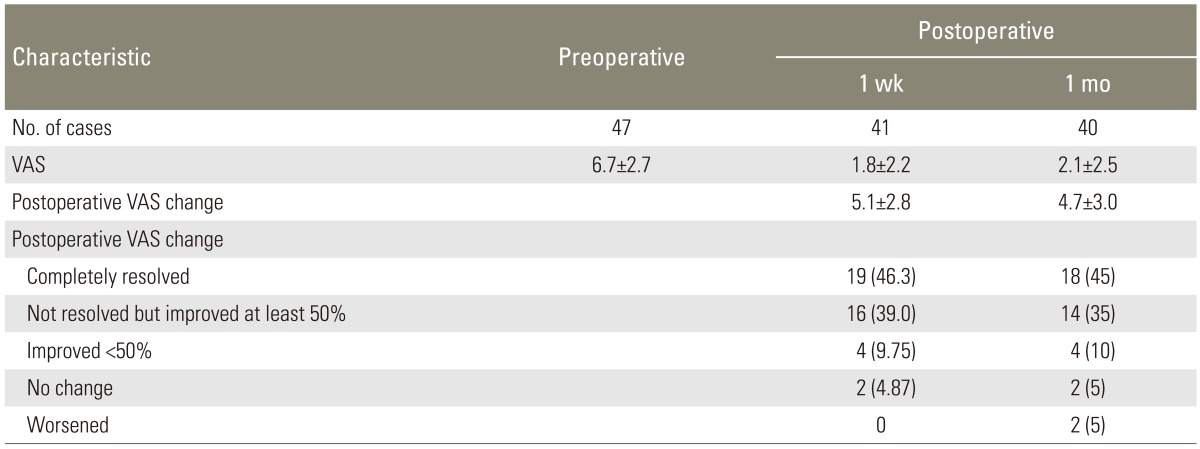
Result of postoperative pain relief
A trend for difference in pain in the shoulder region was found among surgical levels but it did not reach statistical significance. There was no difference in pain distribution over the other classified regions (Table 4).
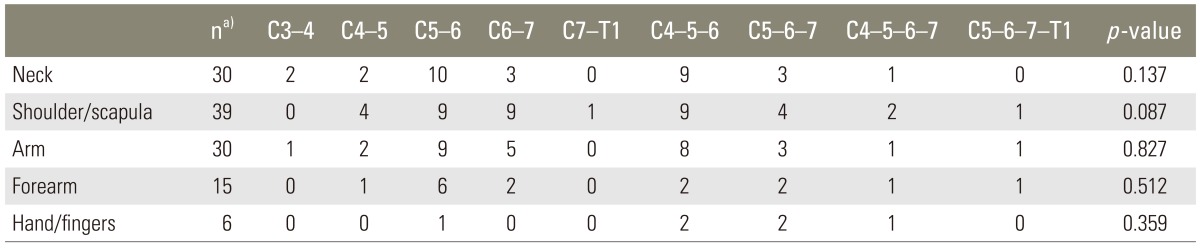
Distribution of pain drawn by patients and the operating levels
The assessment of agreement on interpretation of pain diagrams by various sources showed mixed results. According to the interpretation of Kappa previously described by Landis and Koch [4], the intra-examiner and inter-examiner agreement on interpretation of the drawings was moderate and slight, respectively. There was slight agreement between both examiners on interpretation of pain diagrams in reference to actual surgery. The agreement between patients' drawings versus physicians' drawings was moderate (Table 5).
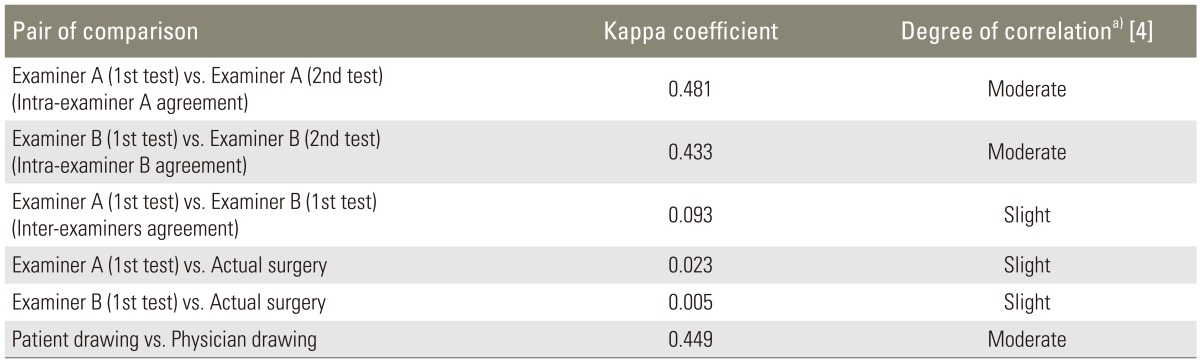
Agreement between various data
Discussion
There are a number of studies assessing the value of pain drawing patterns in degenerative spine diseases. Previous studies have investigated the value of pain drawings in its correlation with various features including surgical outcome, magnetic resonance imaging findings, discographic study, and psychogenic issues [5,6,7,8,9,10,11,12,13,14,15,16,17,18,19,20,21,22,23,24,25]. Among these studies focusing on its localizing value, Beattie et al. [6] and Rankine et al. [19] found little association between pain drawings and pathology of degenerative lumbar spine. Fewer studies have focused on pain in the cervical spine. Cooper et al. [26] and Aprill et al. [27] found a distinct map of pain patterns from cervical zygapophyseal joints based on anesthetic blocking in normal and chronic neck pain patients. Slipman et al. [22] delineated the distribution of pain at each cervical level by means of cervical discography [28].
However, there is no previous study assessing the value of pain drawings in identifying symptomatic levels for the surgery. The authors hypothesized that there is an association between pain distribution and the symptomatic levels, which will be useful in selecting proper and necessary surgical levels, particularly in the event that pain is the only symptom and neuroimaging studies are equivocal.
However, this study shows that there is no significant difference in pain distribution patterns at any level of surgery. Moreover, the agreement between various interpretations was only slight to moderate (Table 5). This suggests that there is limited concordance in the interpretation of the pain patterns by different interpreters as well as limited consistency in the interpretation by the same interpreter at different times. All of these findings suggest that the pain patterns are of limited value in localizing the surgical level not only by statistical analysis but also for actual use by different interpreters.
Plausible explanations for these results are as follows: pain patterns in patients with cervical spondylosis vary even in patients with similar pathologies and often do not show consistent recognizable dermatomal pain patterns (Fig. 4). Pain in this group of patients is due to a combination of many pain sources including but not limited to radicular pain, discogenic pain, and facet joint pain with varying predominance of each pain type [2]. The pain patterns that patients describe frequently are different from those in the textbooks that focus mainly on the dermatomal distribution of each source or each nerve root.
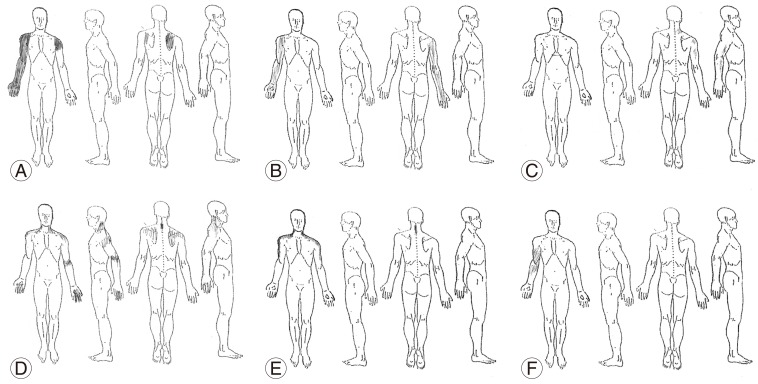
(A-F) Examples of actual patients' drawings.
Moderate agreement between patient's and physician's drawings suggested that the patient and physician report pain distribution differently. Patients have a tendency to underreport neurogenic pain areas [7] while the physician's drawings can be influenced by the clinical knowledge of the patient plausibly by drawing ones which follow the recognizable anatomical patterns and omit ones that do not [20].
A caveat is that the ultimate goal of this study is to find if pain distribution patterns can identify the "symptomatic level" in patients with cervical spondylosis. Since there is no gold standard for identifying the symptomatic levels, the authors used surgical levels with good surgical outcome as a surrogate. However, surgical levels may not truly represent symptomatic levels. This is especially the case when performing surgery at symptomatic levels with inclusion of asymptomatic levels which would have had an equally good outcome.
Conclusions
Pain distribution pattern by itself has limited value in identifying surgical levels in patients with cervical spondylosis. Hence, a physician needs to combine pain location with other clinical information and results of other diagnostic studies to identify the appropriate surgical levels.
Notes
Conflict of Interest: No potential conflict of interest relevant to this article was reported.