


Introduction
Lumbar extensor muscle size and strength have been considered to play an essential role in patients with lower back pain and functional disability and the planning of rehabilitation modalities [1-3]. There are many studies concerning back muscle degeneration or atrophy and the decrease in back extensor muscle strength in patients with lower back pain [2,4,5]. Back muscle strength in patients with symptomatic lumbar degenerative disease has also been shown to decrease, particularly in females and older patients [6]. The maintenance of lumbar extensor strength is critical to improving physical function after lumbar fusion in patients with lumbar disc disease because back extensor strength is significantly decreased [7].
Back muscle size is measured in cross-sectional areas (CSAs) and has been previously used as a parameter to evaluate the relationship of muscle strength with variables such as age and weight [2,4]. Several studies have reported that the CSA of back muscle is one of the most powerful predictors of back muscle strength [3,8]. However, Parkkola et al. [9] reported that the size of back muscles was not related to the maximum extension strength of the trunk. Likewise, there is no consensus regarding the correlation between the CSAs of lumbar muscles and muscle strength, which could be explained by the use of different methods, such as isokinetic or isometric tests, for evaluating lumbar back muscle strength in previous studies [3,8,9].
Various equipment has been developed to correctly quantify the strength of back muscles and to exercise for patients with lower back pain and dysfunction [2,3,8,9]. However, controversy remains over objective measurement methods of back muscle strength and correlations between back muscle strength and radiological or clinical parameters [10]. Of the many techniques available, an isometric back muscle strength test is one of the most objective method [11,12]. Keller et al. [8] evaluated back muscle strength using a Roman Chair device with the BieringŌĆōSorensen test, Hakkinen et al. [13] used a strain-gauge dynamometer, and Roussel et al. [14] tested strength by positioning the equipment in an upright sitting position. The evaluation of lumbar strength using a MedX lumbar extension demonstrated high reliability of repeated measurements of isometric lumbar extension through a range of motion [6]. Few studies have investigated distinctive characteristics of muscle size and strength or their correlation in patients with lumbar degenerative diseases.
This study aims to determine the characteristics of lumbar extensor muscle size and strength and to examine their correlation in women with lumbar degenerative diseases. These results will aid in the planning of rehabilitation of patients with lumbar degenerative disease to specifically improve function and reduce pain.
Materials and Methods
1. Study participants
Between 2007 and 2009, we recruited a final cohort of 74 female patients who failed adequate conservative management for >6 months and consecutively underwent posterior lumbar interbody fusion for lumbar degenerative disease. Those who could not adhere to the protocol of lumbar extensor strength measurement and those who underwent simple decompression without instrumentation, a previous lumbar spinal operation, fusion surgery for infection or fracture, and lumbar fusion of four or more segments (for lumbar degenerative kyphosis) were excluded.
All data were prospectively collected before surgery. The mean patient age was 66 years (range, 46ŌĆō72 years). The weight of each patient was measured to calculate the body mass index (BMI). The Oswestry Disability Index (ODI; range, 0ŌĆō100) and pain Visual Analog Scale (VAS; range, 0ŌĆō10) of the lower back were also recorded.
The study population included patients with combined degenerative disc disease and spinal stenosis (n=42), degenerative spondylolisthesis (n=21), spondylolytic spondylolisthesis (n=8), and segmental instability with degenerative disc disease (n=3). The patients underwent surgery at intervertebral disc level from L1ŌĆō2 to L5ŌĆōS1 for the fusion of one segment (L4ŌĆō5, n=26), two segments (L4ŌĆōS1, n=33), three segments (L3ŌĆōS1, n=10), or four segments (L1ŌĆō5, n =5). A) This study protocol was approved by the Institutional Review Board of Samsung Medical Center (IRB approval no., SMC 2007-09-033).
2. Lumbar extensor muscle size
The CSA of the lumbar extensor muscle including the multifidus and erector spinae muscles was measured at each intervertebral disc level between L1ŌĆō2 and L5ŌĆōS1 on an axial T2-weighted magnetic resonance imaging (MRI), and the total sum of all CSAs from L1ŌĆō2 to L5ŌĆōS1 was calculated [15,16]. The sizes of the back extensor muscle were measured on each axial MRI by constructing polygon points around the outer margin of the extensor muscle in the picture archiving and communication system. The measurers attempted to maintain the same distance between each point of the polygon (Fig. 1). To minimize inter and intraobserver errors, two orthopedic surgeons evaluated the digitized radiographs twice using MRIs with 2├Ś magnification. The inter- and intraobserver intraclass correlation coefficients were assessed for the CSA of the back extensor muscles (0.816 and 0.863, respectively).
3. Lumbar extensor muscle strength
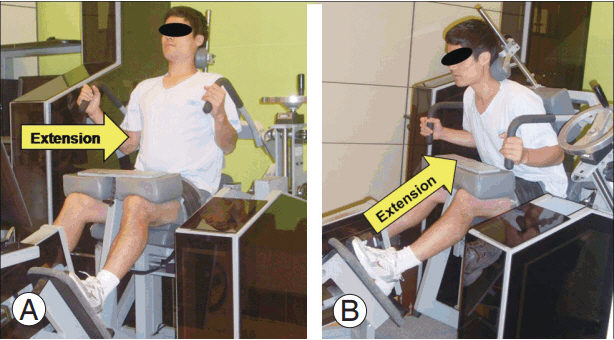
Prior to surgery, the maximal voluntary isometric strength of the lumbar extensor muscles (ft-lb) was measured using a MedX lumbar extension machine (MedX, Ocala, FL, USA) at 0┬░, 12┬░, 24┬░, 36┬░, 48┬░, 60┬░, and 72┬░ of lumbar flexion. All subjects were thoroughly instructed on the method for accurate testing and were asked to perform warm-up exercises 15 minutes beforehand. The patients were positioned according to the established protocol and asked to increase the lumbar extension torque over 3 seconds. After reaching the maximum torque, they were asked to slowly decrease the torque for 3 seconds. During contractions, concurrent visual feedback was provided on a video display screen interfaced with the machine, and the patients were verbally encouraged to exert the maximum effort, even if they had a severe dysfunction or back pain (Fig. 2) [11,17]. A 10-second rest period was allowed between angle conditions. All subjects completed the seven trials of lumbar isometric extension strength tests, and the average test strength was used in this study. All patients were assessed by one examiner who was blinded to other results.
4. Oswestry Disability Index/Visual Analog Scale and body composition parameters
ODI (0ŌĆō100) and VAS (0ŌĆō10) scores of lower back pain were recorded. Body composition parameters (body weight and BMI) were obtained using an InBody ver. 4.0 body composition analyzer (Biospace, Seoul, Korea).
5. Statistical analysis
A professional medical statistical consultant performed the statistical analyses using SAS ver. 9.1 (SAS Institute Inc., Cary, NC, USA). Correlations between isometric back muscle strength and radiographic (CSA of back muscle) or clinical (age, body weight, BMI, ODI, and VAS) parameters were analyzed using PearsonŌĆÖs product moment correlation coefficient and SpearmanŌĆÖs rank correlation coefficient (rho), and BonferroniŌĆÖs corrections were conducted on each p-value. A p-value of <0.05 was considered significant.
Results
1. Isometric back muscle strength versus cross-sectional area of back muscle
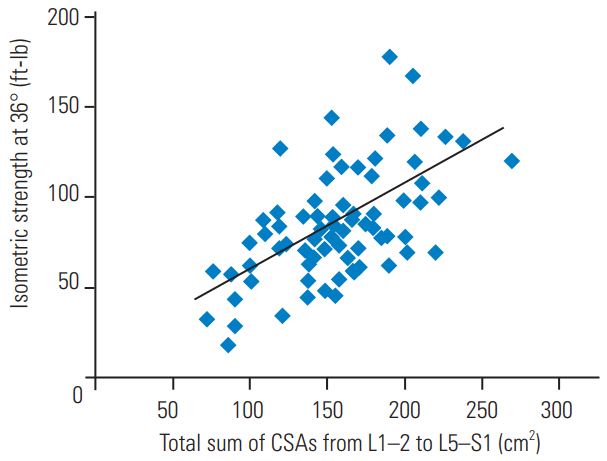
The mean isometric strengths at each angle (0┬░, 12┬░, 24┬░, 36┬░, 48┬░, 60┬░, and 72┬░) were 32.5┬▒21.9, 50.1┬▒29.2, 72.0┬▒33.0, 88.7┬▒37.5, 100.7┬▒41.0, 112.2┬▒43.6, and 126.2┬▒47.2 ft-lb. The mean CSAs of the back extensor muscle at each intervertebral disc level were 34.3┬▒8.2 (L1ŌĆō2), 36.3┬▒8.0 (L2ŌĆō3), 35.1┬▒7.2 (L3ŌĆō4), 31.4┬▒7.5 (L4ŌĆō5), and 21.9┬▒6.9 (L5ŌĆōS1) cm2 and the total sum of all CSAs (L1ŌĆōS1) was 156.2┬▒34.7 cm2.
The isometric back muscle strengths at all lumbar flexion angles were significantly associated with the total sum of the CSAs of the back extensor muscles (p<0.05) (Fig. 3). The isometric strengths were mainly associated with the CSAs of the upper lumbar level back extensor muscles (from L1ŌĆō2 to L3ŌĆō4), but scarcely with the CSAs of the lower lumbar level back extensor muscles (L4ŌĆō5 and L5ŌĆōS1). Notably, isometric strengths were strongly correlated with the CSA at L1ŌĆō2 intervertebral disc level, and no significant correlation with the CSA at L5ŌĆōS1 intervertebral disc level was observed (Table 1).
2. Correlation between isometric back muscle strength versus age, Oswestry Disability Index/Visual Analog Scale, and body composition parameters
The mean ODI and pain VAS scores for the lower back were 54.7┬▒12.4 and 6.6┬▒2.5, respectively. The mean body weight and BMI of the patients were 59.9┬▒11.4 kg and 24.9┬▒3.74 kg/m2, respectively.
The isometric back muscle strengths at angles 12┬░ŌĆō60┬░ were negatively associated with patientsŌĆÖ age. Body weight and BMI were associated with isometric strength at all lumbar flexion angles, demonstrating particularly strong correlations with the isometric strength at higher lumbar flexion angles (48┬░ŌĆō72┬░). Isometric strengths at most of the lumbar flexion angles showed significant but weak negative correlations with ODI (correlation coefficients <0.4). VAS scores showed only a tendency toward negative correlation with isometric strength at lower angles (0┬░, p=0.055; 12┬░, p=0.077), but this was not statistically significant (Table 2).
Additionally, correlation analyses between ODI and other variables revealed that ODI was significantly associated with age (p=0.031, r=0.330) and isometric strength (p=0.050, r=ŌĆō0.306) and showed a tendency toward positive correlation with body weight (p=0.064, r=ŌłÆ0.285).
Discussion
In this study, isometric strength was associated with the total sum of the CSAs of the back extensor muscles, mainly with the CSAs of the upper lumbar back muscles from L1ŌĆō2 to L3ŌĆō4. The isometric strength at most of the angles of lumbar flexion showed significant negative correlations with ODI score, but not with VAS score. Also, patient age was negatively associated with isometric strength at lumbar flexion angles of 12┬░ŌĆō60┬░. Body weight and BMI were associated with isometric strength, especially at higher angles (48┬░ŌĆō72┬░).
Many studies have reported the association of chronic lower back pain and decreased back muscle strength and size [2-4]. The CSA measurement was considered the most easily accessible method without requiring a specialized program or device [18]. However, the measurement of muscle CSAs had some potential bias, such as infiltrating fat components, inhomogeneous muscle contents, and irregular margins between muscle and fat. Previous study results of correlations between muscle strength and size are controversial. Parkkola et al. [9] verified that isometric back muscle strength, determined using specialized equipment, was not related with the measured CSA of the back muscle (L4ŌĆō5). Another study [3] also demonstrated a lack of correlation between the CSA of back extensors and the extensor strength. However, Peltonen et al. [19] found that an increased CSA of back extensors was correlated with increased back muscle strength. We suggest that the discrepancy in the results of previous studies may be due to the measuring technique (computed tomography [8,20] versus MRI [16,21], or isometric [6,7,14] versus isokinetic [4]) or the measuring site (L3 versus L4 versus L5) as well as the fatty infiltration ratio and muscle fiber elasticity.
Our present study revealed an association between back extensor strength and CSA at the upper intervertebral disc levels from L1ŌĆō2 to L3ŌĆō4, but not at the lower levels from L4ŌĆō5 to L5ŌĆōS1. In general, the muscle at the L1ŌĆō2 level was not considered clinically significant because most of the lumbar degenerative diseases occurred at the lower lumbar levels. Previous studies have proposed that the back muscle at the upper lumbar level plays a compensatory role for the atrophied back muscle at the lower lumbar level [22,23]. Therefore, to correctly predict the back muscle strength or remaining functional potential of patients with severe lumbar degenerative disease, we recommend that evaluation considering the testing position of the upper lumbar muscles is necessary.
In our study, isometric back muscle strength showed a significant inverse correlation with the ODI score. Although the correlation was weak (r<ŌłÆ0.4), we thought this result clinically important because few studies have shown a direct association between back muscle strength and patient dysfunction [24,25], and this could be used as basic data in back muscle strengthening exercise programs for patients with lumbar degenerative disease. Furthermore, additional studies using other function-specific assessments, such as the RolandŌĆōMorris Disability Questionnaire and 36-item Short-Form Health Survey, would be helpful to elucidate the relationship between back muscle strength and dysfunction. On the other hand, the VAS score did not demonstrate a significant correlation with isometric strength and only showed a tendency toward negative correlations with isometric strength at lower angles (0┬░ŌĆō12┬░). A lower angle (0┬░ŌĆō12┬░) in the MedX isometric muscle test means a maximally extended trunk position. Although our results contradict previous reports that showed the association between lower back pain and decreased muscle strength [1,26], this result could be an important clinical finding because most patients with degenerative disc disease complain of severe back pain when the trunk is in an extended position [27]. Based on the finding that strong back extensor muscles at lower angles are related to decreased lower back pain, we propose that isometric back extensor strength in the extended position could be an important clinical factor to evaluate the correlation between back muscle strength and back pain severity.
Isometric strength at higher lumbar flexion angles was associated with body weight and BMI. This result is consistent with previous studies [10,28] that demonstrated age and BMI as influencing factors in females. In the MedX isometric muscle test, the back extensor strength tends to gradually decrease as the trunk extension angle increases [6]. The absolute back extensor muscle strength can be obtained at a flexion angle of 72┬░ because the optimal muscle length, explained as the lengthŌĆōforce relationship, is observed at 72┬░ flexion angle to evaluate the maximal muscle force, and it gradually decreases as the trunk extension angle increases [29]. Based on previous studies [28,29], we propose that the maximal muscle force could be demonstrated in patients with a higher BMI because the absolute back muscle strength of our results did not take into account the body weight of each patient [28]. We recommended that the relative results (results/kg), taking into account the body weight, should be evaluated for measuring the function of back extensor muscles in these patients.
This study had some limitations. First, we did not examine a control group of healthy individuals. The results of comparison with a control group could aid the establishment of standards in back muscle strengthening exercises. Second, we only examined the back extensor muscles. Because lumbar spine motion is multiplanar, the evaluation of other paraspinal muscles including abdominal muscles, the psoas, quadratus lumborum, or gluteal muscles is necessary for the thorough investigation of back muscles. In this study, however, we focused on the extensor muscle strength and size and examined the correlation between extensor muscles and clinical parameters. Lastly, it was difficult to precisely evaluate the back muscle strength of the patients due to their back pain. To minimize this bias, one specialist at our sports medicine center assessed all patientsŌĆÖ muscle strengths and continually encouraged them to exert maximal effort during the testing. The patients who could not correctly perform the protocol of strength measurement were excluded.
Conclusions
In female patients with lumbar degenerative disease, isometric strength was positively associated with the CSA of back extensor muscles, especially at the upper lumbar level (L1ŌĆō4), and body weight/BMI and negatively associated with age and ODI score. The back extensor strength at the extended position (0┬░ŌĆō12┬░) and upper lumbar level (L1ŌĆō4) is an important parameter to consider when evaluating muscle function and back pain in these patients. Our findings will be helpful in evaluating back extensor function and prescribing optimal exercise intervention.