Cross-Cultural Adaptation, Validity, and Reliability Study of the Turkish Version of the Back Pain Functional Scale
Article information
Abstract
Study Design
Prospective study.
Purpose
To investigate the cross-cultural adaptation, validity, and reliability of the Turkish version of the Back Pain Functional Scale (BPFS).
Overview of Literature
Low back pain is a common disorder in the population that negatively affects the patient’s daily, professional, and social life. Self-report questionnaires are important to precisely evaluate back pain and making better and appropriate treatment decisions. Currently, there are several questionnaires for investigating mobility in patients with low back pain.
Methods
We recruited 360 patients with chronic low back pain. For assessing the reliability of the scale, we performed test–retest and internal consistency analyses. Test–retest analysis was performed using intraclass correlation coefficient (ICC). Internal consistency was analyzed by calculating Cronbach’s alpha value. Construct validity of the questionnaire was evaluated by comparing total scores on the BPFS with those on Roland Morris Disability Questionnaire (RMDQ) and Oswestry Disability Index (ODI) using Pearson’s correlation coefficient analysis.
Results
Cronbach’s alpha value was 0.910, indicating high internal consistency. The test–retest reliability was excellent (ICC, 0.958; 95% confidence interval, 0.710–0.908). No floor or ceiling effects were observed. Factor analysis indicated that the scale had a single-factor structure. Pearson correlation coefficient was −0.669 when BPFS was compared with RMDQ and −0.701 when compared with ODI. These values indicate a significant correlation of BPFS with RMDQ and ODI.
Conclusions
These data indicate the validity and reliability of the Turkish version of the BPFS.
Introduction
Low back pain is defined as pain in the area between the lower border of the scapula and the buttocks, which sometimes radiates to the lower extremities [1]. Low back pain is the second most common health problem in the community following common cold [2]. Chronic low back pain is less common than acute and subacute low back pain, and it results in high treatment cost, severe pain, and significant limitations in physical activity [3].
The cost of direct healthcare resulting from low back pain is 3 times the annual cost of all cancer cases [4]. Although the cost of treatment and psychosocial consequences of low back pain were considered a concern of only developed countries until 10–15 years ago, recent studies have been suggesting that low- and middle-income countries also face this problem. Therefore, it is important to investigate low back pain [5,6].
In patients with low back pain, spinal mobility and muscle strength are the most commonly assessed physiological parameters in clinical practice and research [7]. The appropriate use of functional measurement questionnaires is one of the most crucial factors in determining the functional level of a patient with low back pain and in constructing a successful treatment protocol [8]. The objective and functional evaluation of the spine should therefore be performed using validated questionnaires in patients with low back pain [9]. The developed questionnaires should be highly reliable in evaluating the changes that occur over time in such patients [10].
Calmels et al. [11] indicated that there is currently no gold standard questionnaire to evaluate disability in patients with low back pain. Therefore, increasing the number of questionnaires to assess back pain would provide better perspective for clinicians and researchers. Although the Roland Morris Disability Questionnaire (RMDQ) and the Oswestry Disability Index (ODI) are valid, reliable, and widely used scales for low back pain, they have some limitations [12,13]. Notably, these questionnaires also have respective Turkish versions. The Back Pain Functional Scale (BPFS) has better internal consistency, test–retest reliability, and point estimate of susceptibility to change compared with RMDQ, suggesting its superiority over RMDQ [14]. Furthermore, the RMDQ and ODI are insufficient in indicating the level of disability, despite being the most frequently used scales in research [15]. A previous study has shown that BPFS is more successful than RMDQ in detecting clinical changes in patients with a back pain duration of less than 2 weeks [14].
The BPFS was developed by Stratford et al. [16] to compensate for deficiencies in the existing scales, and it is used to evaluate the functional status of patients with low back pain in clinical practice and research. The BPFS, which is valid and reliable in patients with low back pain, has 12 questions, is easy to administer with completion time less than 5 minutes, and can be scored in less than 30 seconds [16]. There is only one version of this scale in Persian [17]. Therefore, we aimed to investigate the reliability and validity of the Turkish version of the BPFS.
Materials and Methods
The study was approved by the Gazi University Ethics Commission (#77082166-302.08.01-39582). Written permission was obtained from Stratford to translate the original BPFS into the Turkish language. Subsequently, the translation and cultural adaptation were performed according to the procedure established by Beaton et al. [18]. A total of 380 patients with low back pain patients were recruited to this study. Written informed consent was obtained from all study participants. However, 20 patients were excluded from the study for incorrect filling of the questionnaire, thereby reducing the total number of participants to 360 (Fig. 1). The test–retest analysis was performed on 96 of the 360 patients in a 7-day interval when they received no treatment.
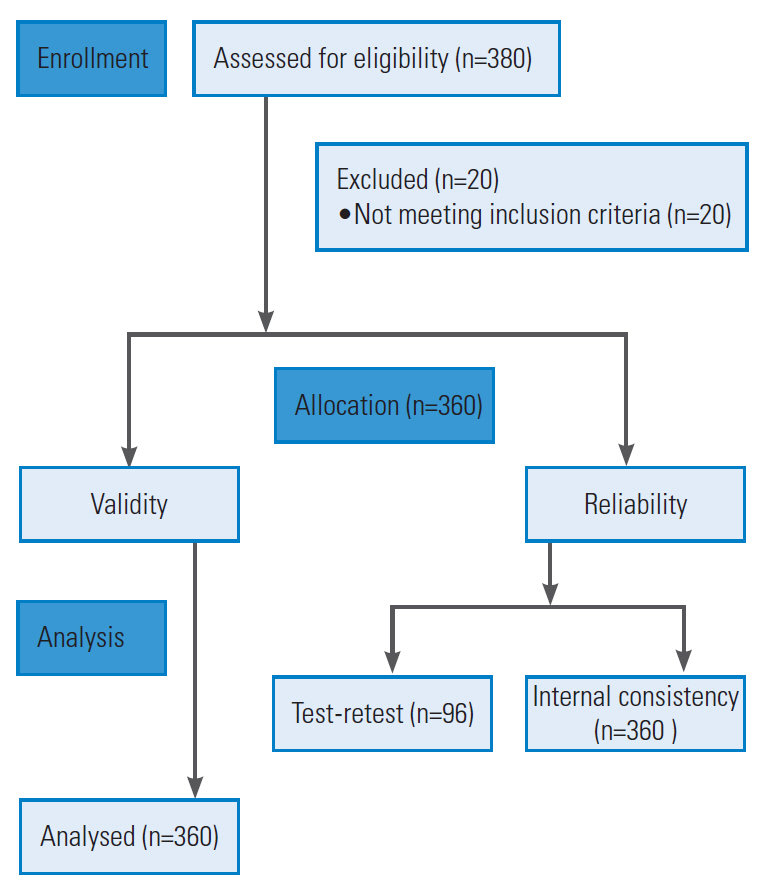
Flow diagram of the study patients.
1. Participants
The inclusion criteria were as follows: (1) patients who were literate; (2) patients between the ages of 18 and 65 years with chronic low back pain. The exclusion criteria were as follows: (1) patients with rheumatologic or neurological diseases, and a history of surgery for low back pain; (2) patients with specific low back pain caused by infection, tumor, or fracture.
2. Translation and cultural adaptation procedure
1) The original English form of the scale was translated into Turkish by two native Turkish speakers fluent in English. One translator was a physiotherapist with knowledge of the concepts presented in the study, and the other translator was a scientist in English linguistics with no background knowledge of these concepts.
2) The two Turkish translated versions were evaluated and merged by the two translators to produce a single consensus translation.
3) This final Turkish version of the scale was translated back to English by two bilingual translators (native English speakers with a good command of Turkish). The bilingual translators were blinded to the study aims.
4) The two versions of the English translation were evaluated and merged by the two bilingual translators, producing a single consensus translation.
5) After back translation and cultural adaptation, performed by an expert committee comprising a physiotherapist, an English linguistics scientist, a Turkish philology specialist, and two bilingual translators, the pre-final form of the scale was created.
6) The comprehensiveness of the scale was evaluated in a pilot group of 40 people (20 patients and 20 healthy individuals). Participants were asked to rate the comprehensibility of each item in the scale.
7) The pilot participants found the questionnaire comprehensible.
8) The committee established the final form of the questionnaire based on the pilot findings.
3. The Back Pain Functional Scale
The BPFS consists of 12 items that measure the ability of patients to perform physical activities. The 12 items cover different domains such as work, school, home activities, hobbies, heavy activities, bending forward, wearing shoes or socks, lifting an object from the ground, sleeping, sitting, standing, walking, climbing stairs, and driving. Each item is scored on a 6-point Likert scale ranging from 0 to 5. A score of ‘0’ indicates inability to perform the specified activity because of back pain and a score of ‘5’ indicates no difficulty in performing the specified activity. The total score ranges from 0 to 60, with a higher score indicating better patient condition [16].
4. The Roland Morris Disability Questionnaire
The RMDQ consists of 24 items related to the patient’s perceptions of his or her low back pain and associated disability. The scoring is performed by calculating the number of ‘yes’ responses among the ‘yes/no’ boxes. Therefore, the score ranges from 0 (no disability) to 24 (maximal disability) [19]. The Turkish version of the RMDQ has been found to be valid and reliable by Küçükdeveci et al. [12].
5. The Oswestry Disability Index
The ODI consists of 10 items that address different aspects of functioning in patients with low back pain. Each item is scored from 0 to 5. The total score is calculated by multiplying the sum of the scores by 2, giving a range of 0 to 100. A higher score reflects higher disability [20]. The Turkish version of the ODI has been found to be valid and reliable by Yakut et al. [13].
6. Statistical analysis
All statistical analyses were performed using the IBM SPSS ver. 22.0 (IBM Corp., Armonk, NY, USA). The percentage of patients with a score of 0 or 60 was calculated to detect the floor and ceiling effects. Test–retest and internal consistency analyses were performed to determine the reliability of the BPFS. Intraclass correlation coefficient (ICC), 95% confidence interval, was used for analyzing the test–retest value. Cronbach’s alpha was used to analyze the internal consistency, with 0.80 or higher being considered as excellent [21]. Construct validity of the questionnaire was assessed by factor analysis and convergent validity. Kaiser Meyer Olkin (to determine the adequacy of the sample) and Bartlett (to determine the suitability of the sample) tests were used before factor analyses. The convergent validity of the scale was determined using the Pearson’s correlation analysis after the total scores were obtained from BPFS, RMDQ, and ODI.
For the Pearson correlation coefficient, intervals of 0.81–1.00 were considered excellent, 0.61–0.80 were considered very good, 0.41–0.60 was considered good, 0.21–0.40 was considered poor, and 0–0.20 was considered as having no correlation. The level of statistical significance was set at p<0.05 [22].
Results
1. Demographic and clinical characteristics
Demographic and clinical characteristics of the study patients are summarized in Table 1.

Demographic characteristic of patients (N=360)
2. Reliability
We included 96 patients who did not receive treatment in the test–retest reliability analysis with an interval of 7 days. Test–retest ICC values ranged from 0.710 to 0.908, and the ICC value of the total score of the scale was 0.958 (Table 2). Based on the ICC values, the BPFS test–retest results were high. The Cronbach’s alpha of the BPFS was 0.910, indicating high internal consistency. When each question of the scale was omitted, the Cronbach’s alpha value of the questionnaire ranged from 0.897 to 0.910 (Table 3).

ICC values of Back Pain Functional Scale
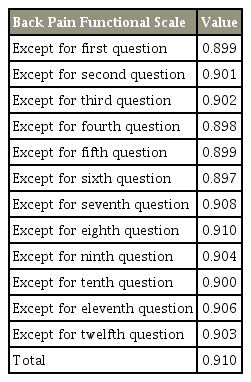
Cronbach alpha values of Back Pain Functional Scale
3. Convergent validity
The correlation of the BPFS with RMDQ was r=−0.669 and ODI was r=−0.701, indicating that the BPFS was strongly negatively correlated with the RMDQ and ODI (Table 4).
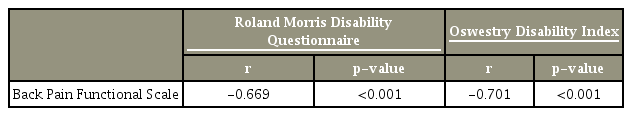
Convergent validity of Back Pain Functional Scale
4. Factor analysis
The values of the Kaiser Meyer Olkin and Bartlett tests indicate that the sample was suitable and adequate for factor analysis (Table 5). On factor analysis, the questionnaire had a single factorial structure by scree plot graph (Fig. 2). According to the total variance analysis, the single factor of the BPFS constitutes 54.2% of the total variance, which supports the questionnaire having a single-factor structure (Table 6).

Kaiser Meyer Olkin and Barlett’s test

Scree plot graph.
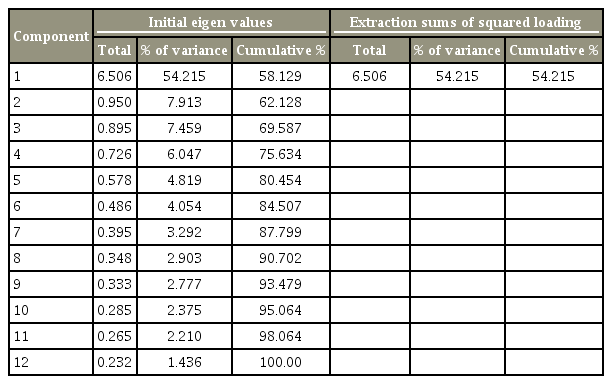
Total variance analysis of Back Pain Functional Scale
Discussion
The aim of this study was to determine the validity and reliability of the Turkish version of the BPFS in patients with chronic low back pain. Cross-cultural adaptation and statistical testing indicated that the Turkish version of the BPFS is a suitable, valid, and reliable assessment tool for Turkish patients with chronic low back pain. Low back pain is a common concern that negatively affects the patient’s daily, social, and professional life [23]. In addition to the objective measurements performed by a therapist or physician during planning and implementation of treatment and rehabilitation, self-report questionnaires are used [24]. Appropriate selection and use of these questionnaires is necessary to plan a successful treatment program and follow-ups [25]. Calmels et al. [11] reported that no gold standard questionnaire is available for the evaluation of the disability of patients with low back pain. However, although the RMDQ [12,19] and ODI [13,26] are the commonly used valid and reliable scales, they are not recommended for patients with low back pain for their insufficiency in indicating the level of disability [15]. Moreover, the RMDQ is recommended to be used in combination with other measures when low back pain is associated with psychological or social problems [15]. Compared with RMDQ, the BPFS has better internal consistency, test–retest reliability, and point estimate of susceptibility to change, suggesting its superiority over RMDQ [14].
Based on the duration, low back pain is classified as acute (<4 weeks), subacute (4–12 weeks), and chronic (>12 weeks) [27]. To obtain a homogeneous group, only patients with chronic low back pain were included in this study. Stratford et al. [16] who created the original version of the BPFS, and also Nakhostin Ansari et al. [17], who conducted the Persian version, did not separately report the status of patients for acute, subacute, or chronic low back pain.
The internal consistency analysis of the BPFS was assessed using the Cronbach’s alpha coefficient, and it was found as 0.910. This rate indicates that the Turkish version of the BPFS is quite reliable. In previous studies, Cronbach alpha values of the BPFS were investigated and found as 0.930 by Stratford et al. [16], and 0.895 by Nakhostin Ansari et al. [17]. We found similarly high Cronbach’s alpha values, suggesting the significant reliability and a high level of internal consistency of the Turkish version of the BPFS.
According to the literature, there is no definite time interval fortest–retest analysis [28]. Patients are more likely to remember the questions and the results may be relatively high when the questionnaire is re-administered in a short time span. Conversely, if the time between the tests is too long, the condition of the patients may change [29]. Marx et al. [28] reported no significant difference between test–retest results when the retest was performed after 2 days or 2 weeks from the first questionnaire, indicating this time interval to be optimum. Therefore, following these guidelines [28], we used a 7-day test–retest interval. In the original BPFS study, Stratford et al. [16] performed test–retest analysis on 28 patients, and repeated the questionnaire within the first 48 hours, within 1–2 weeks, and 3 weeks following the first questionnaire, and reported that test–retest ICC results of each question varied between 0.77 and 0.94, and the test–retest ICC value of the total score was 0.88. Nakhostin Ansari et al. [17] reported that the test–retest interval ranged between 7 and 10 days, with an ICC value of 0.88 (0.80–0.93). In the Turkish version of the BPFS, 96 patients were asked to complete the BPFS again 7 days after the first completion to determine the test–retest reliability. According to the statistical analyses, the ICC value for each question of the Turkish version of the BPFS varied between 0.911 and 0.980, and the total ICC value was 0.958. We found the Turkish version of the BPFS to be highly stable over time, similar to the original English and Persian versions.
In the original BPFS study, validity analysis was performed on 77 patients with low back pain and compared with the total RMDQ scores using the Pearson correlation coefficient, which was reported as 0.79. In the Persian version, authors analyzed the BPFS and Persian Functional Rating Index total scores for validity and found the Pearson correlation coefficient to be −0.77 [17]. We conducted an identical validity study of the Turkish BPFS version on 360 patients with chronic low back pain, For the validity of the scale, total scores from the BPFS, RMDQ, and ODI were analyzed using Pearson correlation coefficient. The Pearson correlation coefficient value of the BPFS with the RMDQ was determined as −0.669 and −0.701 with ODI. and found similar values for the correlation of the Turkish BPFS version with RMDQ and ODI, suggesting a good correlation.
The Kaiser Meyer Olkin and Bartlett tests showed that the sample was suitable and adequate for factor analysis, which revealed that the BPFS had a single-factor structure. There was a single common factor in the original BPFS study [16], whereas there were two common factors in the Persian BPFS version [17]. The results obtained in the original English BPFS study support our findings. These factor loadings were planned to measure the construct validity of the functional capability of the original BPFS [16]. We believe that the factor analysis will be useful for future validity and reliability studies for different languages.
Several limitations of this study warrant discussion. The responsiveness analysis of the original BPFS is considered to be one of the most important parameters for questionnaires, and shows similar responsivity with RMDQ, suggesting that the BPFS could be very sensitive to clinical changes [16]. However, we did not perform this responsiveness analysis in the Turkish version. In our opinion, evaluating the response in treatment groups in patients with acute and subacute low back pain will be beneficial in future studies. In addition, it is necessary to analyze the validity and reliability of the Turkish BPFS version in patients with acute and subacute low back pain. Finally, it is difficult to assess the validity of assessment tools because of the current unavailability of a ‘gold standard’ tool. Therefore, in the absence of a consensus gold standard, it is possible that our reliable and valid questionnaire can be used as a ‘gold standard.’
Conclusions
We successfully adapted the BPFS into Turkish language and showed acceptable psychometric properties of reliability and validity consistent with the original version when used in patients with chronic low back pain. The Turkish version of the BPFS has high test–retest and internal consistency, sufficient test–retest reliability, and high convergent validity. Thus, the Turkish BPFS version is found to be reliable, valid, and responsive in patients with chronic low back pain. The BPFS is an extremely useful and robust tool for the clinical evaluation of patients with chronic low back pain, as it assesses the activity and participation in detail, focusing specifically on different aspects of mobility [30].
Notes
No potential conflict of interest relevant to this article was reported.