Determination of Any Correlation between Sagittal Spinopelvic Configuration and Progressive Collapse of Acute Osteoporotic Compression Spine Fractures: A Retrospective Radiological Analysis
Article information
Abstract
Study Design
A retrospective cohort study.
Purpose
The aim of this study was to determine any correlations between spinopelvic configuration and progressive collapse following acute osteoporotic compression spine fractures.
Overview of Literature
Few studies have investigated the risk factors for progressive osteoporotic compression spine fractures. However, the correlation between the spinopelvic configuration, which is a crucial to optimize the management of lumbar degenerative diseases, and progressive collapse following acute osteoporotic compression spine fractures was not analyzed.
Methods
We retrospectively identified all patients treated for thoracolumbar fractures in Assaf Harofe Medical Center between January 2008 and July 2013. Pelvic incidence (PI), sacral slope (SS), and pelvic tilt (PT) were measured for the pelvic parameters. For each patient, we classified the fracture according to the AOSpine Thoracolumbar Spine Injury Classification System. Height loss was measured initially and at a minimum of 3-month follow-up. The difference between initial and final height loss was documented as height loss difference.
Results
The study included 124 patients comprised 86 women and 38 men. The mean patient age was 69±9.6 years. The mean length of follow-up was 14±15 months. No significant effect of the PI, PT, and SS angles on the vertebral fracture level (p>0.05) was found. Similarly, no significant relationship between the PI, PT, and SS angle and the fracture type according to the AO classification (p>0.05) was found. There was no correlation between PI, PT, and SS angles and initial height loss, final height loss and height loss difference (p>0.05)
Conclusions
The spinopelvic configuration represented by the PI, PT, and SS angle does not influence progressive collapse following acute osteoporotic compression spine fractures.
Introduction
Osteoporotic compression spine fractures are different from spinal fractures occurring in the younger population. Osteoporotic compression spine fractures are associated with significant morbidity and mortality [1,2]. Neurologic complications as a result of progressive collapse of the fractures have been reported [3-5]. Risk factors for progressive collapse of osteoporotic compression spine fractures have been previously studied [6,7]. In a previous study, we found that during a minimum 3-month follow-up of conservative treatment for acute osteoporotic vertebral compression fracture, age and the AOSpine Thoracolumbar Spine Injury Classification System were predictive factors for progressive collapse [7].
Spinopelvic configuration correlates with degenerative diseases of the spine, such as degenerative disc disease, spondylolisthesis, and lumbar disc herniation [8-11]. According to recent studies, analysis of sagittal balance is crucial to optimize the management of lumbar degenerative diseases [5,7,12,13]. However, only a few studies have investigated the correlation between pelvic parameters and osteoporotic compression spine fractures [12,14,15].
The purpose of this study was to analyze the correlation between spinopelvic configuration and progressive collapse following acute osteoporotic compression spine fractures.
Materials and Methods
Following approval of the Institutional Review Board of Assaf Harofeh Medical Center (55–14), we retrospectively identified all patients treated for thoracolumbar fractures in our institution between January 2008 and July 2013, through a computerized search of International Classification of Diseases, 9th revision (ICD-9) codes. The ICD-9 codes that were used were 733.13, 805.2, 805.4, and 805.8. Candidates for inclusion in the study were patients aged 50 years or older who presented with acute osteoporotic compression spine fractures. Because of the retrospective nature of the study, informed consent was not obtained from all individual participants included in the study.
The exclusion criteria included pathological fractures, transverse process or spinous process fractures, and fractures due to high energy trauma. Patients with old fractures and patients who had radiological follow-up of less than 3 months were also excluded from the study.
Overall, 335 cases were identified and their medical records were reviewed for demographic characteristics, fracture type and level, and clinical follow-up. Of these, 34 patients were excluded from the study due to transverse process or spinous process fractures, 34 patients were excluded due to high energy trauma, 44 patients were excluded for age criteria (<50 years), 21 were excluded due to old fractures, and five were excluded for pathological fractures. Out of the 197 remaining patients, 44 patients did not have the required 3-month follow-up and in 29 of the remaining cases, the radiographs did not include both hips so spinopelvic parameters could not be measured. Thus, the study group included 124 patients with acute osteoporotic compression spine fractures (Fig. 1).
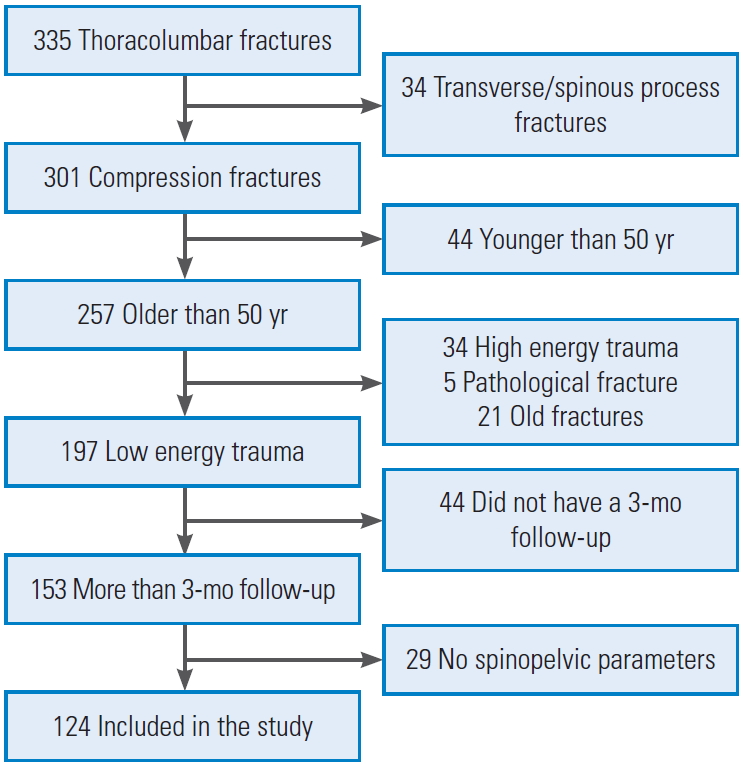
The study’s flow chart.
All patients were treated with a spinal orthosis for 3 months. For patients with anterior column fracture from T8 to L2, a hyperextension orthosis (Jewett brace) was used. For patients with L3 or L4 fracture, a lumbar sacral orthosis was used and for patients with a two-column fracture from T6 to L2, a thoracolumbar sacral orthosis was used.
All included cases were examined by plain radiographs, and 90% of them also had a computed tomography (CT) scan. The findings of plain radiographs and CT scans were reviewed and recorded.
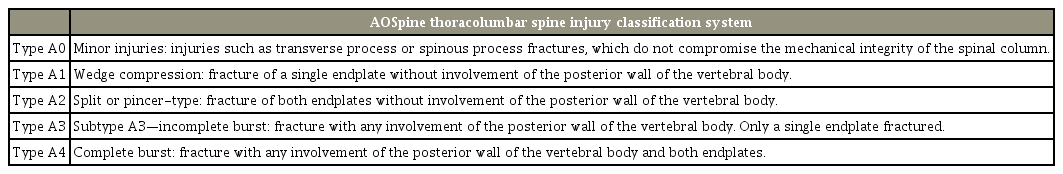
Pelvic incidence (PI), sacral slope (SS), and pelvic tilt (PT) were measured for the pelvic parameters. The PI is the angle between a perpendicular line passing through the midpoint of the sacral endplate and a line joining this point and the center of the femoral head. The SS is the angle between a horizontal line and the superior endplate of S1. The PT is the angle between a vertical line passing through the center of the femoral head and a line joining this point and the midpoint of the sacral endplate (Fig. 2).

The SS is the angle between the superior sacral endplate and a horizontal reference line. The PT is the angle between the line connecting the midpoint of the superior sacral plate to the center axis of the femoral heads and a vertical reference line. The PI is the angle subtended by a line drawn from the center of the femoral heads to the midpoint of the sacral endplate and a line perpendicular to the center of the sacral endplate (S1). SS, sacral slope; PT, pelvic tilt; PI, pelvic incidence.
For each patient, we classified the fracture according to the AOSpine Thoracolumbar Spine Injury Classification System (Table 1) [13]. Vertebral height was measured at the point of maximal collapse of the affected vertebral body and the height loss (%) was calculated with a formula: {(lower vertebral height+upper vertebral height)/2−affected vertebral height}/{(lower vertebral height+upper vertebral height)/2}×100 (Fig. 3) [5]. Height loss was measured initially and at a minimum of 3-month follow-up. The difference between initial and final height loss was documented as height loss difference.
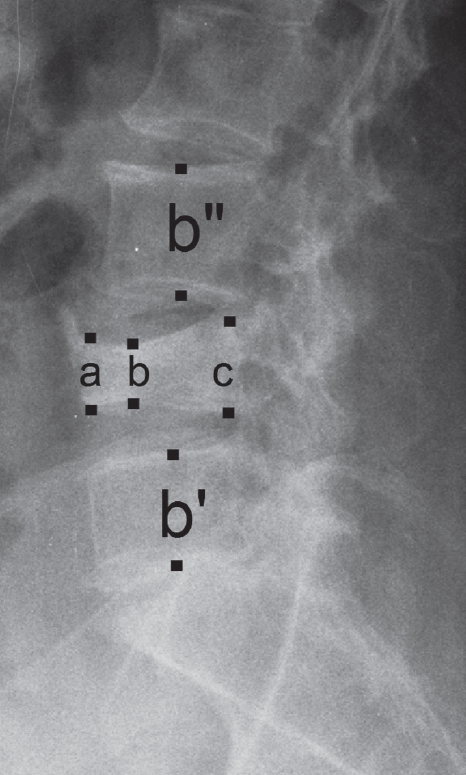
AOSpine thoracolumbar spine injury classification system
Measurement of height loss. After determination of maximal height loss among anterior (a), middle (b), and posterior (c), the point of maximal collapse of the affected vertebral body was measured. Height loss (%) was calculated with the formula {(b'+b")/2–b}/{(b'+b")/2}×100.
The statistical analysis was conducted using IBM SPSS software ver. 21.0 (IBM Corp., Armonk, NY, USA). Correlations were tested using the pearson's correlation coefficient. The Student t-test was used to compare means. The differences between categorical variables with more than two categories were examined using the analysis of variance test. The statistical significance threshold was determined as a p-value equal to or less than 0.05.
Results
The study included 124 patients, consisting of 86 females and 38 males. The mean patient age was 69±9.6 years (range, 51–89 years). The mean follow-up was 14±15 months (range, 3–96 months). Most fractures (103 cases) were at the thoracolumbar junction T11–L2. When using the AOSpine Thoracolumbar Spine Injury Classification System, the study included 49 type A1 (49 cases, 39%), 7 type A2 (7 cases, 6%), 41 type A3 (41 cases, 33%), and 27 type A4 fractures (27 cases, 22%). The demographic data of the examined patients is presented in Table 2.

Demographic data of the patients
Regarding the spinopelvic parameters, the PI angle showed a mean of 53°±11° (range, 27°–83°) for all patients; there was no statistically significant distinction of the PI angle between males and females (52.3° versus. 54.6°) (Table 3). The PT angle and SS angle showed a mean of 14°±9° (range, −7° to 48°) and 39.5°±8.9° (range, 18°–57°), respectively.
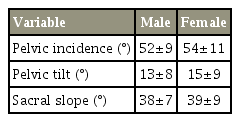
Spinopelvic parameters in males and female’s patients
There was no significant effect of the PI, PT and SS angles on the vertebral fracture level (p>0.05); there was also no significant relationship between the PI, PT, and SS angle and the fracture type according to the AO classification (p>0.05).
Initial vertebral height, which was measured at the point of maximal collapse of the affected vertebral body, was 16.86 mm. The initial calculated height loss was 27%. Final vertebral height, which was measured at a minimum 3-month follow-up, was 12.58 mm. The final height loss was 50%. There was no correlation between PI, PT, and SS angles and initial height loss, final height loss, and height loss difference (p>0.05) (Table 4). Correlation between these parameters also could not be found when the data for 85 patients with a minimum 6-months follow-up and the data for 49 patients with at least 1-year follow-up were inspected.
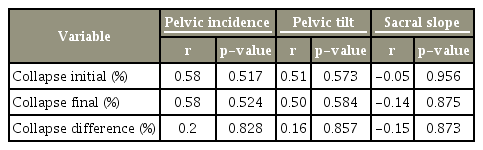
Correlation between continuous variables
There was no correlation between PI, PT, and SS angles and initial height loss, final height loss, and height loss difference (p>0.05) even when each location of fracture (thoracic spine, thoracolumbar junction, and lumbar spine) was evaluated separately. There was the limitation that 103 of 124 cases (83%) were at the thoracolumbar junction.
Discussion
We have previously found that age and the AOSpine Thoracolumbar Spine Injury Classification System were predictive factors for progressive collapse of acute osteoporotic vertebral compression fractures [7]. Others have shown that involvement of the posterior wall, midportion type fractures, and fractures at the thoracolumbar area were also predictive for progressive collapse following acute osteoporotic compression spine fractures [6].
However, the potential influence of sagittal balance of the spine in the pathogenesis of progressive fractured vertebra collapse is not well understood. Dai et al. [14] have found that patients with osteoporosis with low lumbar lordosis and PI could be at high risk of lumbar vertebral fracture. Another study has found that segmental kyphotic angle, lumbar lordosis, sagittal vertical axis, and SS may be potential predictors for adjacent vertebral fractures following percutaneous vertebroplasty [12]. On the other hand, Bouaicha et al. [15] showed that spinopelvic configuration, as represented by the PI angle, does not affect the level of vertebral fractures or the type of vertebral fractures in trauma patients.
In the present study, we analyzed a possible relationship between fractured vertebra collapse and the spinopelvic configuration represented by the PI, PT, and SS angles. Our data did not demonstrate a significant correlation between spinopelvic alignment and fractured vertebra collapse progression.
Our study has some obvious limitations, which include mainly the retrospective nature of the study, with a significant number of patients who did not reach 3-month follow-up. However, analyzing the data for patients with 6- and 12-month follow-up showed the same results. There is also the fact that more than 80% of the fractures were at the thoracolumbar junction; further studies with larger sample sizes for the thoracic and lumbar spine may show different results.
Conclusions
The spinopelvic configuration represented by the PI, PT, and SS angle does not seem to influence progressive collapse following acute osteoporotic compression spine fractures.
Notes
No potential conflict of interest relevant to this article was reported.