Magnetic Resonance Spectroscopic Analysis of Multifidus Muscle Lipid Contents and Association with Nociceptive Pain in Chronic Low Back Pain
Article information
Abstract
Study Design
Cross-sectional study.
Purpose
This study aimed to analyze the differences in the lipid contents in chronic low back pain (CLBP) patients with nociceptive pain (NocP) and neuropathic pain (NeP) using magnetic resonance spectroscopy (MRS) of the multifidus muscle (Mm).
Overview of Literature
Early identification of the pain characteristics with CLBP is important because specific treatment approaches are required, depending on NocP and NeP.
Methods
The participants were 50 patients with CLBP (23 men and 27 women; mean age, 63.1±17.8 years; range, 41–79 years). We compared the Visual Analog Scale (VAS) scores, intramyocellular lipids (IMCLs) and extramyocellular lipids (EMCLs) of the Mm in NocP and NeP groups, as evaluated with the Japanese NeP screening questionnaire.
Results
The patients were categorized into the NocP (n=32) and NeP (n=18) groups. The mean VAS score of the NocP group was 59.3±3.1 mm and that of the NeP group was 73.6±4.6 mm. The mean VAS score was significantly higher in the NeP group as compared to that in the NocP group (p<0.01). As per the analysis of covariance for the VAS score, the mean IMCL levels of the Mm in the NocP and NeP groups were 722.3 mmol/L (95% confidence interval [CI], 611.4–833.1) and 484.8 mmol/L (95% CI, 381.1–588.5), respectively. The mean IMCL level was significantly higher in the NocP group than in the NeP group (p<0.05). The mean EMCL levels of the Mm for the NocP and NeP groups were 6,022.9 mmol/L (95% CI, 4,510.6–7,535.2) and 5,558.1 mmol/L (95% CI, 4,298.3–6,817.9), respectively; however, the difference was not significant (p=0.72).
Conclusions
The results indicated an association between the IMCL level of the Mm and NocP. Our results suggest that MRS of the Mm might be beneficial for the assessment of CLBP as well as appropriate targeted analgesic therapies.
Introduction
Low back pain (LBP) is one of the most common physiological issues worldwide [1]. Recently, Suzuki et al. [2] reported that 78% of patients with LBP were diagnosed based on the data collected using questionnaires, physical findings, and the various block injections. In particular, disorders of the multifidus muscle (Mm) that plays an important role in trunk function [3] have been associated with chronic low back pain (CLBP) [4].
Pain symptoms, including LBP, were classified into two broad mechanism-based pain categories as follows: nociceptive pain (NocP) that is caused by tissue-injury and/or inflammation and neuropathic pain (NeP) that is caused by nervous system injury [5,6]. A different treatment approach is required for each pain category [7]; therefore, early identification of the involvement of NocP and NeP in patients with chronic pain is important for effective pain management [8].
Recently, several studies have reported on the quantitative evaluation of Mm fatty degeneration with magnetic resonance spectroscopy (MRS) [9-16]. MRS analysis of muscle physiology has facilitated detailed analyses of muscular fat masses via the identification of intramyocellular lipids (IMCLs) and extramyocellular lipids (EMCLs) that has enabled detailed assessment of fatty degeneration [9,10]. IMCLs cannot be detected using conventional magnetic resonance imaging (MRI) because they appear as lipid droplets in the skeletal muscle cells that are in close contact with skeletal mitochondria [10,11]. In contrast, EMCLs represent subcutaneous and extracellular fat in the cells between the muscle fibers [9,17,18]. In our previous study, MRS analyses of the Mm showed that CLBP patients had significantly higher IMCL levels than controls [12,15,16].
This study aimed to analyze the differences in the lipid contents in NocP and NeP by performing MRS of the Mm in CLBP patients.
Materials and Methods
The institutional review board of the Sapporo Medical University approved this study (IRB approval no., 262-1074). All the participants were provided with written and verbal explanations of the study procedure, and all of them provided their consent before participating.
1. Participants
Participants were patients (range, 41−79 years old) with non-specific CLBP, characterized by pain, stiffness, and discomfort in the lower back from the 12th rib to the lumbar area or the lumbosacral area, wherein the source of the pain was difficult to identify. Furthermore, the symptoms of all participants had persisted for more than 3 months despite conservative treatments, such as medication and therapeutic exercise. As per the exclusion criteria, we did not enroll patients with neoplasm, infection, fracture, history of lumbar vertebral surgery, neurologic symptoms of the lower leg, or obvious instability that could be the source of LBP and might be improved with surgical treatment. LBP was assessed using the Visual Analog Scale (VAS, 0–100) and the Japanese NeP screening questionnaire after a washout period of at least 4 weeks [19] (Table 1). The Japanese NeP screening questionnaire categorizes patients with a score <4 as having NocP, while those with a score ≥4 were characterized as having NeP.
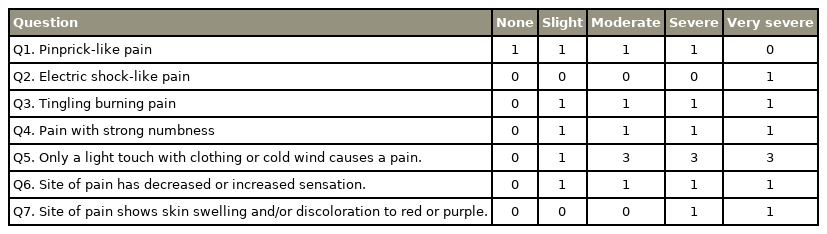
Questions on the nature of pain
2. Magnetic resonance imaging protocol and analysis for magnetic resonance spectroscopic data
We used the previously described MRI protocol and methods of analysis for magnetic resonance (MR) spectroscopic data [12-16]. In brief, the Signa HDx 1.5-T MRI system (GE Healthcare, Milwaukee, WI, USA) with a spine coil was employed to obtain T2 weighted sagittal and transverse MR images. From these images, the proton MRS volume of interest (VOI) was positioned in the center of the Mm at L4/L5 on the right side (Fig. 1). The single voxel point-resolved spectroscopy sequence was performed with the following parameters: repetition time, 2,000 ms; echo time, 35 ms; average number of signals, 64; VOI size, 15×15×15 mm (3.4 mL); and acquisition time, 164 seconds.
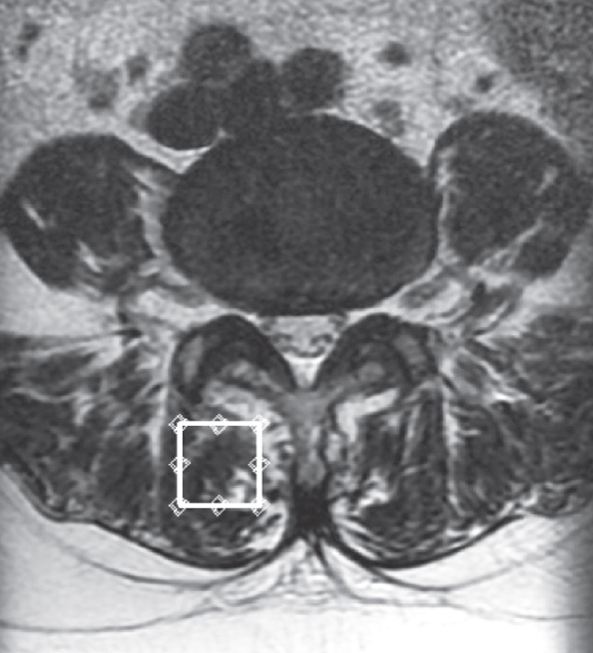
Volume of interest for magnetic resonance spectroscopy measurements of the right multifidus muscle as indicated on the T2 weighted-image at the L4/5 level.
The recorded spectral data were used to measure the levels of IMCLs and EMCLs using the LCModel software (Stephen Provencher Inc., Oakville, ON, USA) [20]. Data were transferred from the scanners to a Linux workstation, and metabolite quantification was performed with Eddy current correction and water scaling. The methylene signals of IMCLs (1.3 ppm) and EMCLs (1.5 ppm) were used for quantification. Estimates of IMCL and EMCL concentrations were automatically scaled to an unsuppressed water peak (4.7 ppm) and the total creatine peak (approximately 3.03 ppm) to determine the lipid concentrations in mmol/L [21,22]. A typical MR spectrum is presented in Fig. 2. Participants with Mm IMCLs or EMCLs content >15% above the standard deviation were excluded from the LCModel analysis.
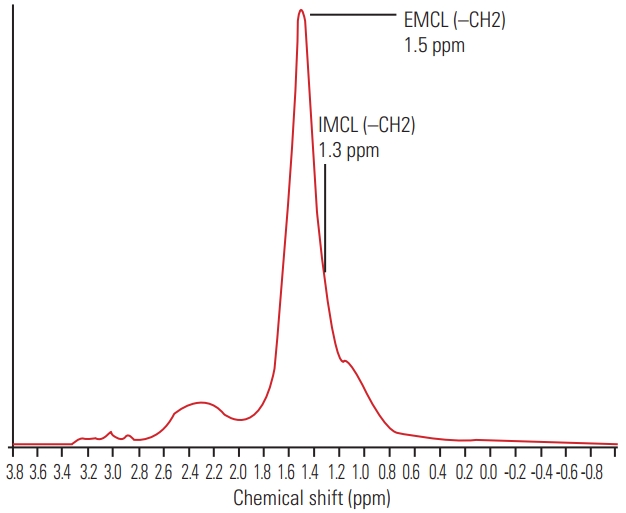
Proton magnetic resonance spectrum of multifidus muscle analyzed using LCModel software (Stephen Provencher Inc., Oakville, ON, USA). The following metabolites are identified; IMCLs (–CH2) methylene protons at 1.3 ppm; EMCLs (–CH2) methylene protons at 1.5 ppm. IMCLs, intramyocellular lipids; EMCLs, extramyocellular lipids.
3. Statistical analyses
Demographic data regarding sex-distribution were analyzed by the chi-square test. Differences among the groups were compared using the Mann-Whitney U-test. We compared the IMCLs and EMCLs of the Mm in the NocP and NeP groups using analysis of covariance (ANCOVA) as covariance of the VAS score. A p-value <0.05 indicated statistical significance. Numerical data are expressed as mean±standard error of the mean or mean (95% confidence interval [CI]).
Results
In total, 50 patients (23 males, 27 females; mean age, 63.1±17.8 years; range, 41–79 years) met the diagnostic criteria. The mean body mass index (BMI) was 23.7±0.5 kg/m2, and the mean VAS score was 65.3±2.9 mm.
As shown in Table 2 and Fig. 3, the patients were categorized as having NocP (n=32) or NeP (n=18). The patients had an almost equal number of men and women, with no significant differences (p=0.87). There were no significant differences in the mean age and BMI of the two groups (p=0.81 and p=0.83), respectively. The average values of the NeP scores were 2.1±0.1 and 5.6±0.4 in the NocP and NeP groups, respectively. The mean VAS score of the NocP group was 59.3±3.1 mm and that of the NeP group was 73.6±4.6 mm (Fig. 4). The mean VAS score was significantly higher in the NeP as compared to that in the NocP group (p<0.01).
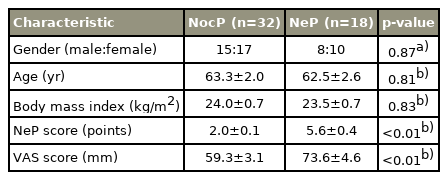
Patient demographic data concerning the gender, age, NeP, and VAS score
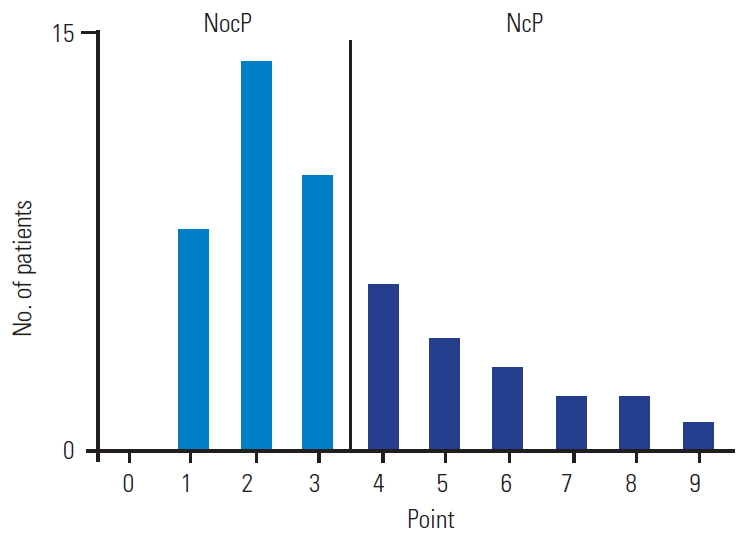
Bar chart of the number of patients in each neuropathic pain (NeP) score. Patients were categorized into the nociceptive pain (NocP) group (n=32) and the NeP (n=18) group.
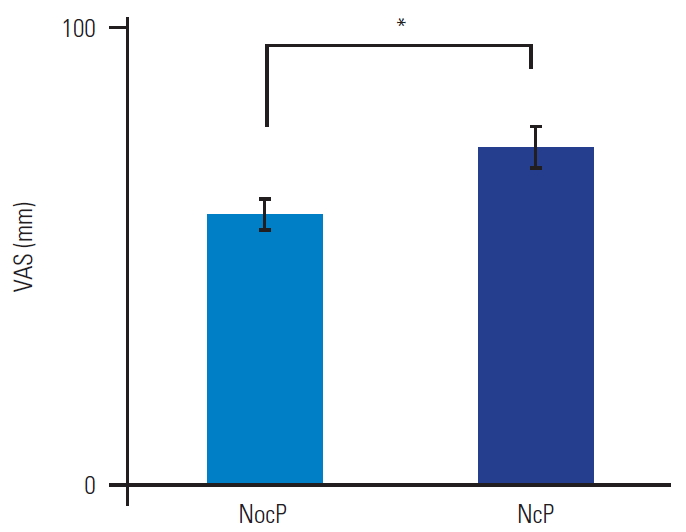
Bar chart showing Visual Analog Scale (VAS) scores in the nociceptive pain (NocP) and neuropathic pain (NeP) groups. VAS scores were significantly higher in the NeP than in the NocP group (p<0.01). Error bars denote the standard error of the mean. *p<0.01 (by the Mann-Whitney U-test).
According to ANCOVA as covariance of the VAS score, the mean IMCLs of the Mm in the NocP and NeP groups were 722.3 mmol/L (95% CI, 611.4–833.1), and 484.8 mmol/L (95% CI, 381.1–588.5), respectively. The mean IMCLs was significantly higher in the NocP group than in the NeP group (p<0.05) (Fig. 5A). The mean EMCLs of the Mm for the NocP and NeP groups were 6,022.9 mmol/L (95% CI, 4,510.6–7,535.2) and 5,558.1 mmol/L (95% CI, 4,298.3–6,817.9), respectively; however, the difference was not significant (p=0.72) (Fig. 5B).

Bar chart showing intramyocellular lipids (IMCLs) (A) and extramyocellular lipids (EMCLs) (B) of the multifidus muscle in the nociceptive pain (NocP) and neuropathic pain (NeP) groups. The mean IMCLs was significantly higher in the NocP than in the NeP group. The mean EMCLs was not significantly different between the NocP and NeP groups. Error bars denote the 95% confidence interval. *p<0.05 (by the analysis of covariance as covariance of Visual Analog Scale score).
Discussion
Non-specific LBP is estimated to account for >85% of all LBP cases [1]. Mm is considered a cause of pain onset for LBP [4]; however, the detail of pain remains unclear. The diagnosis of NocP and NeP components as the cause of LBP is difficult because a gold standard examination is lacking. The diagnostic value of clinical interviews, physical examinations and imaging analyses has not been well documented. Previous reports have shown that NocP is underdiagnosed and undertreated [23]. Thus, no specific diagnostic method has been established, and diagnosing and treating this condition remains a challenge.
In previous studies, the adipose tissue of the Mm was separated into IMCLs and EMCLs, and we identified an association between the levels of IMCLs and LBP [12,15,16]. In the present study, we used MRS of the Mm in CLBP in order to quantitatively investigate the differences between NocP and NeP, revealing the correlations between IMCLs, VAS scores, NocP, and NeP. There was an association between the IMCL levels and VAS scores. Therefore, it is possible that the mitochondrial activity of the Mm is impaired, resulting in an increased level of inflammatory cytokines, such as interleukin-6 (IL-6) and tumor necrosis factor-α (TNF-α) in the Mm of patients with CLBP [24,25]. Tesarz et al. [26] reported that the thoracolumbar fascia is a densely innervated tissue with marked differences in the distribution of nerve endings throughout the fascial layers. Sensory nerve innervation of the thoracolumbar fascia and increases in the levels of cytokines, such as IL-6 and TNF-α, associated with IMCLs in the Mm might be the irrelevant NocP pathophysiology.
This study has important implications for targeted analgesic therapies in clinical settings. A correct understanding of NocP and NeP in CLBP and suitable treatments might enable more effective and patient-oriented pain control. The present results suggest that the IMCL level in the Mm could help in the assessment of CLBP as well as appropriate targeted analgesic therapies.
This study has certain limitations. First, the sample size was relatively small, and there was no control group. Second, the Japanese NeP screening questionnaire might be an inadequate diagnostic tool for detecting NeP caused by spinal disorders. As per a nationwide study in Japan using the NeP screening questionnaire, higher pain scores were associated with higher NeP rates [27]. It has been suggested that the mechanism, nature, and intensity of pain should have been independent factors; however, these might be confounding factors that lead to an increase in apparent pain intensity and give a false high NeP score. Therefore, we conducted ANCOVA analyses to exclude confounding with the VAS score.
Conclusions
Our results indicate an association between the IMCLs of the Mm and NocP. This study suggests that MRS of the Mm might enable the assessment of CLBP as well as appropriate targeted analgesic therapies.
Notes
No potential conflict of interest relevant to this article was reported.
Acknowledgements
This work was supported by the Japan Society for the Promotion of Science KAKENHI (Grant no., 18K16667).