Endoscopic Facet Joint Denervation on the Lumbar Spine: A Retrospective Analysis
Article information

Abstract
Study Design
This single-center retrospective study analyzed patients with chronic low back pain (CLBP) who underwent endoscopic facet joint denervation (EFJD) between April 2018 and May 2019.
Purpose
This study was designed to investigate the effectiveness of EFJD in treating CLBP.
Overview of Literature
CLBP is a challenging burden to healthcare systems worldwide. As up to 45% of cases originate from the lumbar facet joints, sufficient therapy strategies must be developed. EFJD offers a precise depiction of the dorsal medial ramus and the facet joint capsule.
Methods
In this study, 64 patients who underwent EFJD were included. The main outcome of interest was patients’ Visual Analog Scale (VAS) pain score, which was recorded at 3-time points (i.e., before operation and 6 weeks and 12 months after surgery).
Results
EFJD effectively reduced the VAS pain scores by 58% in the short term (6 weeks) and 38% in the long term (12 months). Patients with isolated facet joint osteoarthritis benefited more (p<0.001).
Conclusions
EFJD is a good treatment alternative for CLBP originating from the facet joints, particularly in patients with isolated facet joint osteoarthritis. Moreover, this method can address not only the dorsal medial ramus but also the surrounding tissue (e.g., facet joint capsule, facet joint effusion, and osteophytes) as the origin of CLBP.
Introduction
Low back pain (LBP) is the most common reason for individuals to consult a practitioner in Western countries and therefore increases the burden on healthcare systems [1]. It is assumed that 15%–45% of cases of LBP originate from the lumbar facet joint (FJ) [2]. The lumbar FJ is a true synovial joint and consists of the processus articularis superior and processus articularis inferior, which link the adjacent vertebrae as paired joints [3]. It is encircled by a joint capsule, and the nerval innervation originates from the medial branch (MB) of the ramus dorsalis of the segmental spinal nerve and the cranial and caudal spinal nerves. The segmental MB reaches the FJ capsule by passing the processus transversus. The joint capsule is densely innervated with nociceptors [4].
FJ osteoarthritis has a high prevalence in the community, which increases with age. The L4/L5 level is the most affected site; however, the association between the severity of FJ osteoarthritis and LBP could not be found yet [5]. Furthermore, FJ effusion could be a hint considering LBP because of instability or osteoarthritis; however, the role of FJ effusion has not been fully understood and discussed critically ever since [6–8].
Different tools are used to determine the origin of LBP; physical examination and radiographic imaging are commonly performed [9]. Controlled diagnostic blocks with local anesthesia are an established procedure to diagnose FJ pain as long as they lead to pain relief of 75% [10].
To treat LBP originating from the FJs, different types of therapies have been developed. One method is kryorhizotomy, which is used to destroy the MB of the ramus dorsalis with cold CO2 [11,12]. A good response with pain relief of more than 50% for 12 months could be achieved in 40%–62% of patients who underwent this procedure in a few studies [11,13]. Radiofrequency denervation is also used to destroy the MB; however, it uses a heated probe [14]. Both procedures interrupt pain transmission from the FJs to the brain. Another approach is to not only destroy the MB but also manipulate and debride the FJ capsule so that not only the pain transmission but also the pain perception through the nociceptors are interrupted [15]. Endoscopic rhizotomy offers the possibility of visualization of the FJ capsule and the MB [16].
Few studies have focused on the clinical outcomes of endoscopic facet joint denervation (EFJD) [17,18]. However, factors, such as patients’ constitution (e.g., body mass index [BMI] and American Society of Anesthesiologists [ASA] physical status), the duration of symptoms, and pain relief after infiltration of the lumbar FJs, which could influence the outcome, were not considered in these studies.
Therefore, this study was designed to evaluate whether EFJD on the lumbar spine leads to long-term pain relief and to identify factors influencing the clinical outcome.
Materials and Methods
1. Study design
This study was approved by the Ethics Committee of University of Cologne (no. 19-1556). Informed consent was obtained from all individual participants included in the study. A retrospective study of all consecutive patients who underwent EFJD in the lumbar spine between May 2018 and April 2019 was conducted. Among these patients, 83 patients with chronic low back pain (CLBP) who underwent EFJD on the lumbar spine from L3 to S1 fulfilled the inclusion criteria.
The inclusion criteria in this study were as follows: (1) LBP for at least 3 months that could not be relieved by conservative treatment (e.g., physiotherapy, analgesic medication, and infiltrations); (2) FJ degeneration in the lower lumbar spine affecting at least two segments in a magnetic resonance imaging (MRI) scan not older than 6 months; and (3) At least 50% pain reduction after a diagnostic X-ray-controlled FJ block from L3 to S1 with 1–2 mL each (Mecain 2%/Bucain 0.5%).
Meanwhile, the exclusion criteria were as follows: (1) recent neurological deficit or radiculopathy; (2) less than 50% pain reduction after a diagnostic X-ray-controlled FJ block from L3 to S1 with 1–2 mL each (Mecain 2%/Bucain 0.5%); (3) missing documentation of the Visual Analog Scale (VAS) preoperatively; and (4) missing follow-up examination after 6 weeks.
2. Diagnostic method for facet joint syndrome
To diagnose FJ syndrome, the patients underwent a clinical examination, presented with an MRI scan of the lumbar spine, and underwent a diagnostic X-ray-controlled FJ block. Most patients had pressure pain in the anatomical location of the lumbar FJs. They presented with an MRI scan that showed FJ degeneration. All patients included in this study presented with FJ degeneration affecting at least two segments of the lower lumbar spine. The L4/L5 segment was the most commonly affected site. The combination of L4/L5 and L5/S1 was significantly more common than the combination of L4/L5 and L3/L4. Most patients had a history of several monosegmental FJ blocks. The diagnostic X-ray-controlled FJ block from L3 to S1 before EFJD was performed to ensure that FJ degeneration was likely to cause LBP.
3. Clinical outcome
Clinical symptoms were evaluated before, 6 weeks after, and 12 months after the intervention. Therefore, a 10-point VAS (from 0=no pain to 10=worst pain imaginable) was used, and patient characteristics, such as ASA, BMI, pain duration, analgesic intake, and radiological findings concerning lumbar degeneration, were considered. Because of a loss of follow-up, the data of 64 patients were included in the retrospective analyses. However, 17 patients could not be evaluated after the second follow-up as they underwent another operation on the lumbar spine (13 underwent transforaminal lumbar interbody fusion and four underwent decompression). The patients who underwent transforaminal interbody fusion and were therefore not evaluated did not develop spinal instability because of damage to the FJ capsular caused by ablation. An X-ray of the lumbar spine was performed before EFJD and before transforaminal interbody fusion. No patients showed progression of degenerative spinal instability, and no new spinal instability occurred, comparing the X-ray images of the lumbar spine before and after EFJD.
4. Surgical method
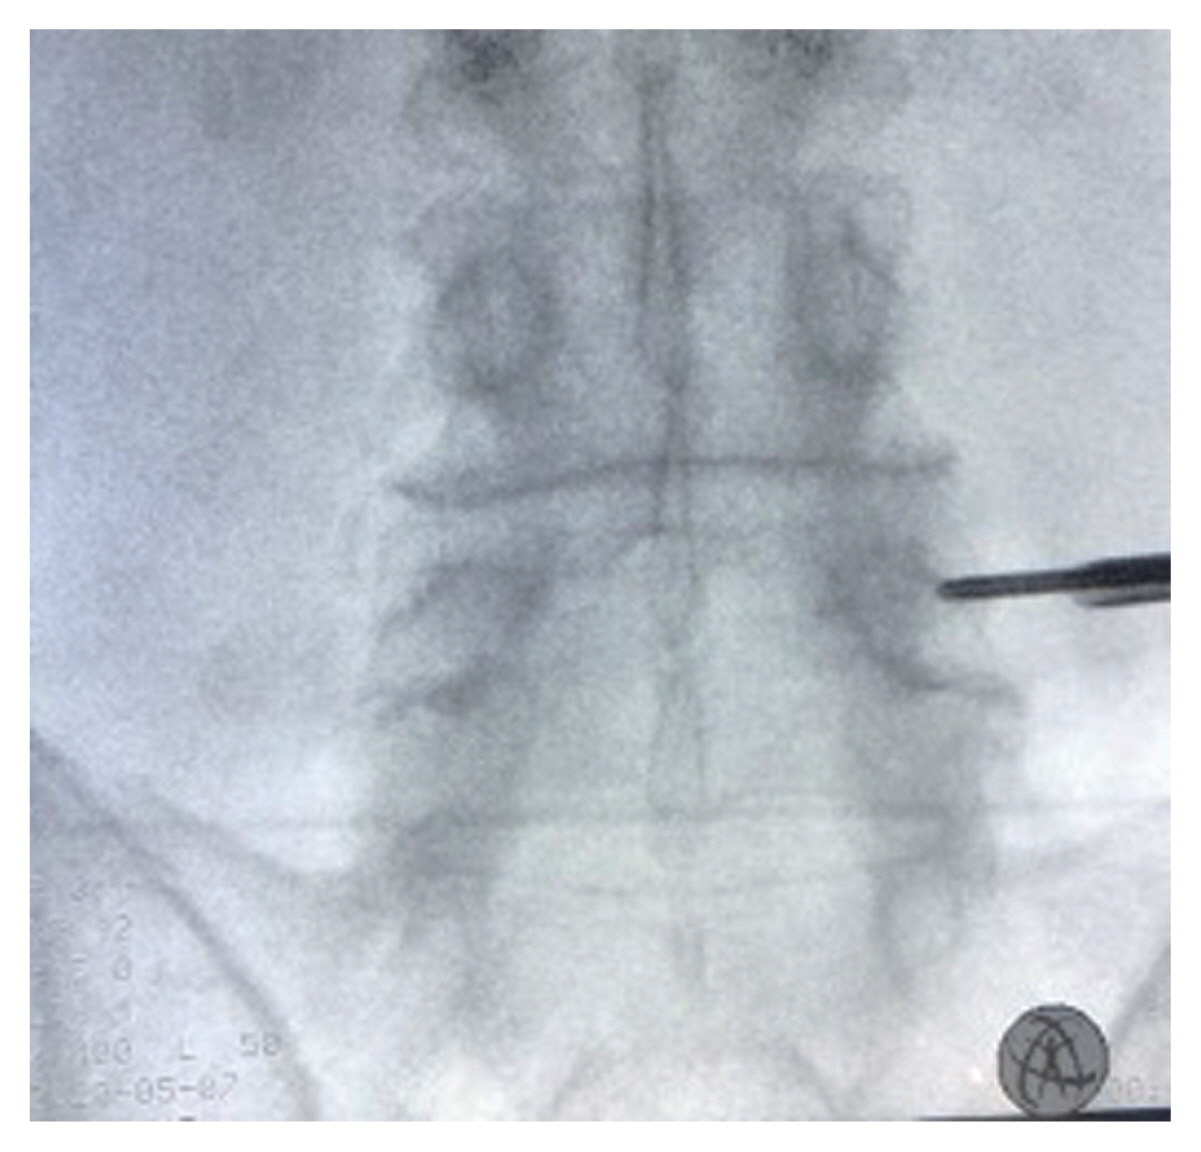
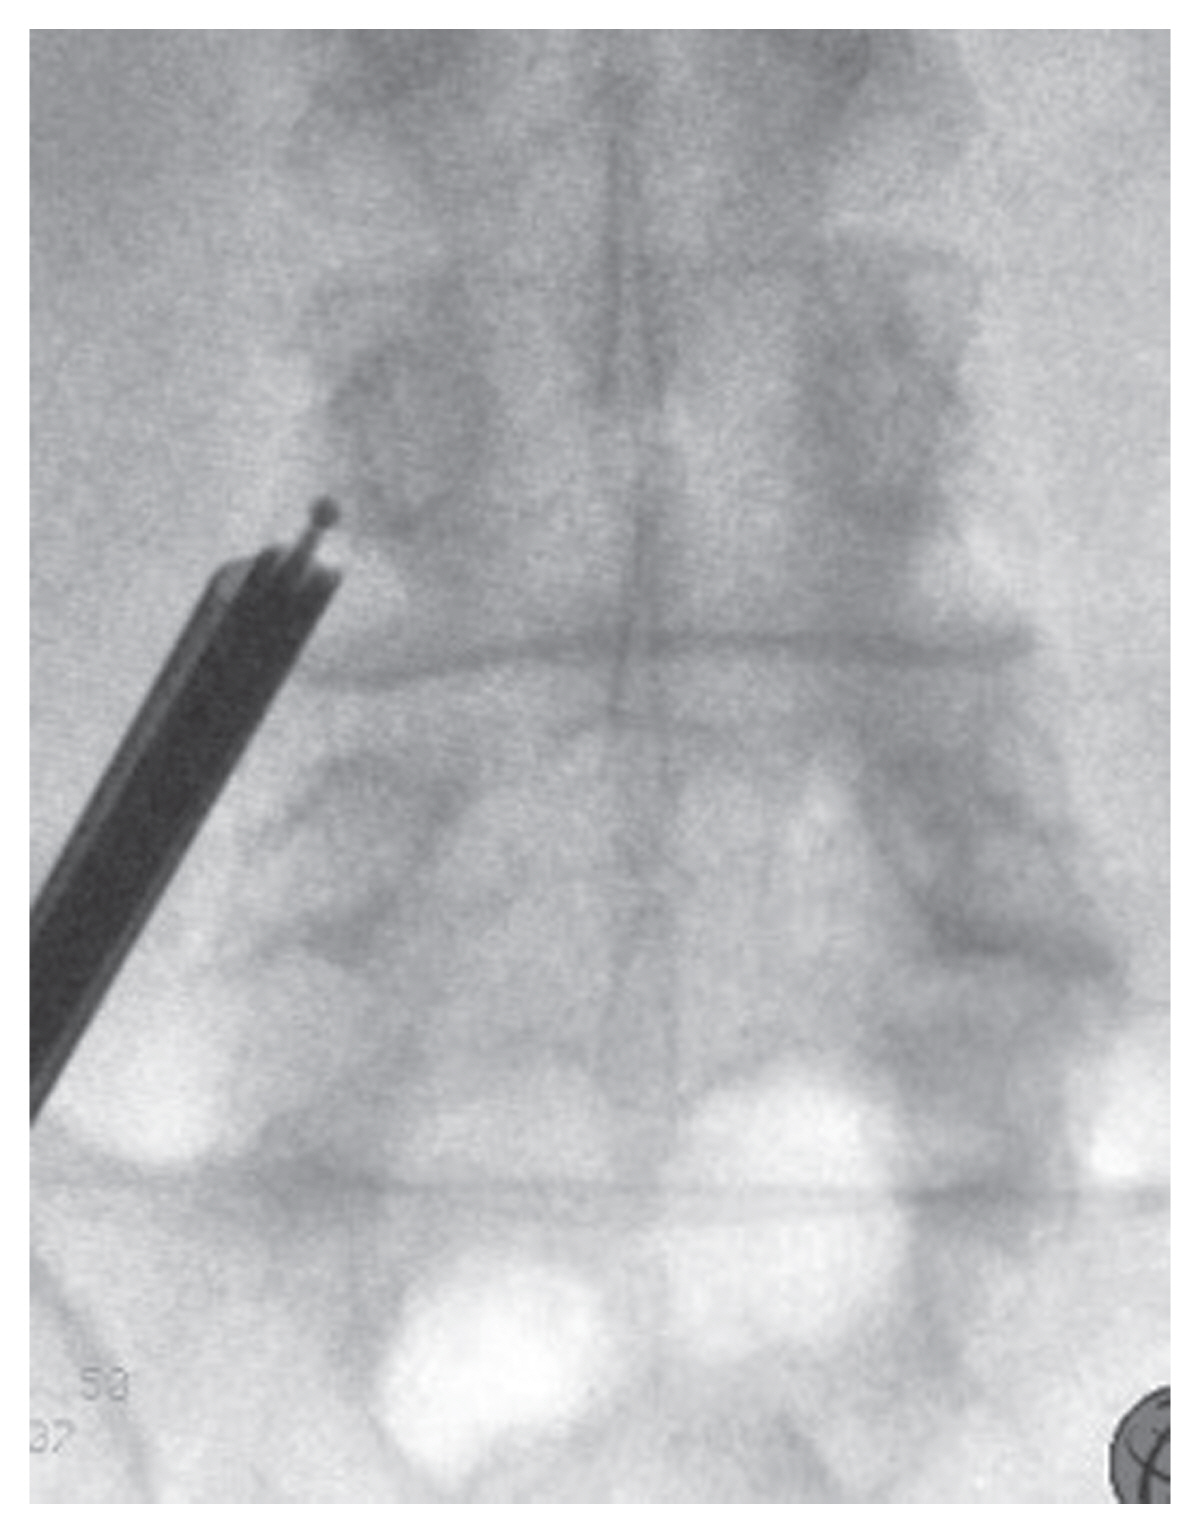
The operation was performed under general anesthesia using the MultiZYTE system (Joimax, Karlsruhe, Germany) (Fig. 1). The patients were placed in the prone position. EFJD was performed from L3 to S1 on both sides through one approach per side, starting from L4/L5. Therefore, there was one skin port on approximately 2 cm from the midline on the right and one skin port on the left to the tune of L4/L5. Therefore, the certain segment was pinpointed using a C-arm, and a needle was inserted into the caudal edge of the ascending part of the FJ where the processus transverus begins (Fig. 2). A wire was put through the needle, and then, the working channel was positioned after stepwise dilatation through a small incision (Fig. 3). A firm area of contact confirmed a bony underground and the X-ray control. As soon as the working channel was positioned, the endoscope was put in place (Fig. 4). The area was inspected, and the surrounding soft tissue and FJ capsule were shrank using the radiofrequency cutting heat.

Operating set consisting of needle, wire, scalpel, dilatators, working channel, clamp, radio frequency heat probe (bottom row) and water line, endoscope, and lightening cable (upper row).
Stepwise dilatation.
Facet joint denervation under X-ray control.
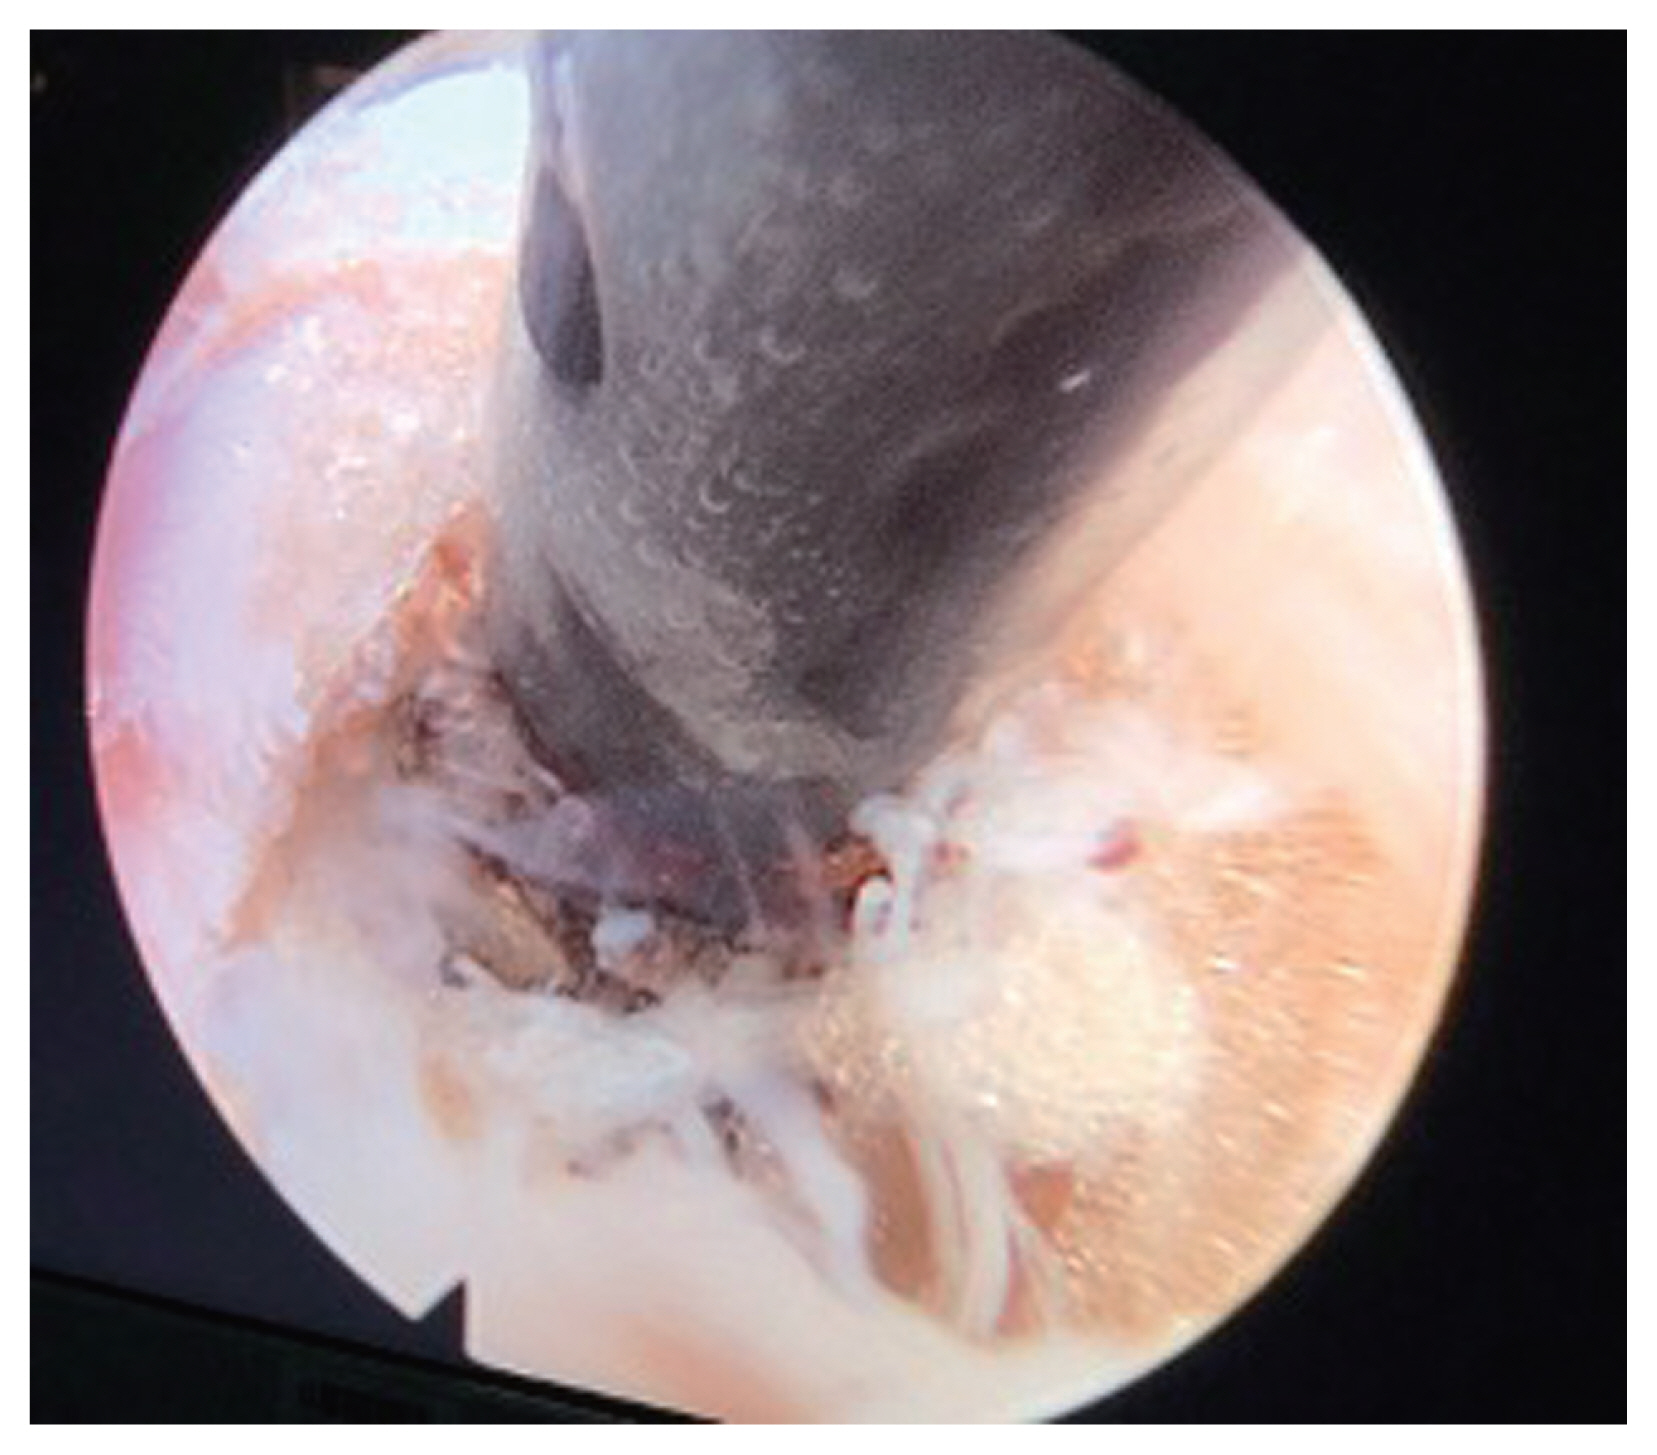
Endoscopic view of the facet joint denervation.
Finally, the MB was localized and ablated at 40 W (Fig. 5). Then, the endoscope and working channel were removed. The same procedure was performed on the FJ at L3/L4 and L5/S1 from the L4/L5 approach. The wound was closed using a non-resorbable suture material.
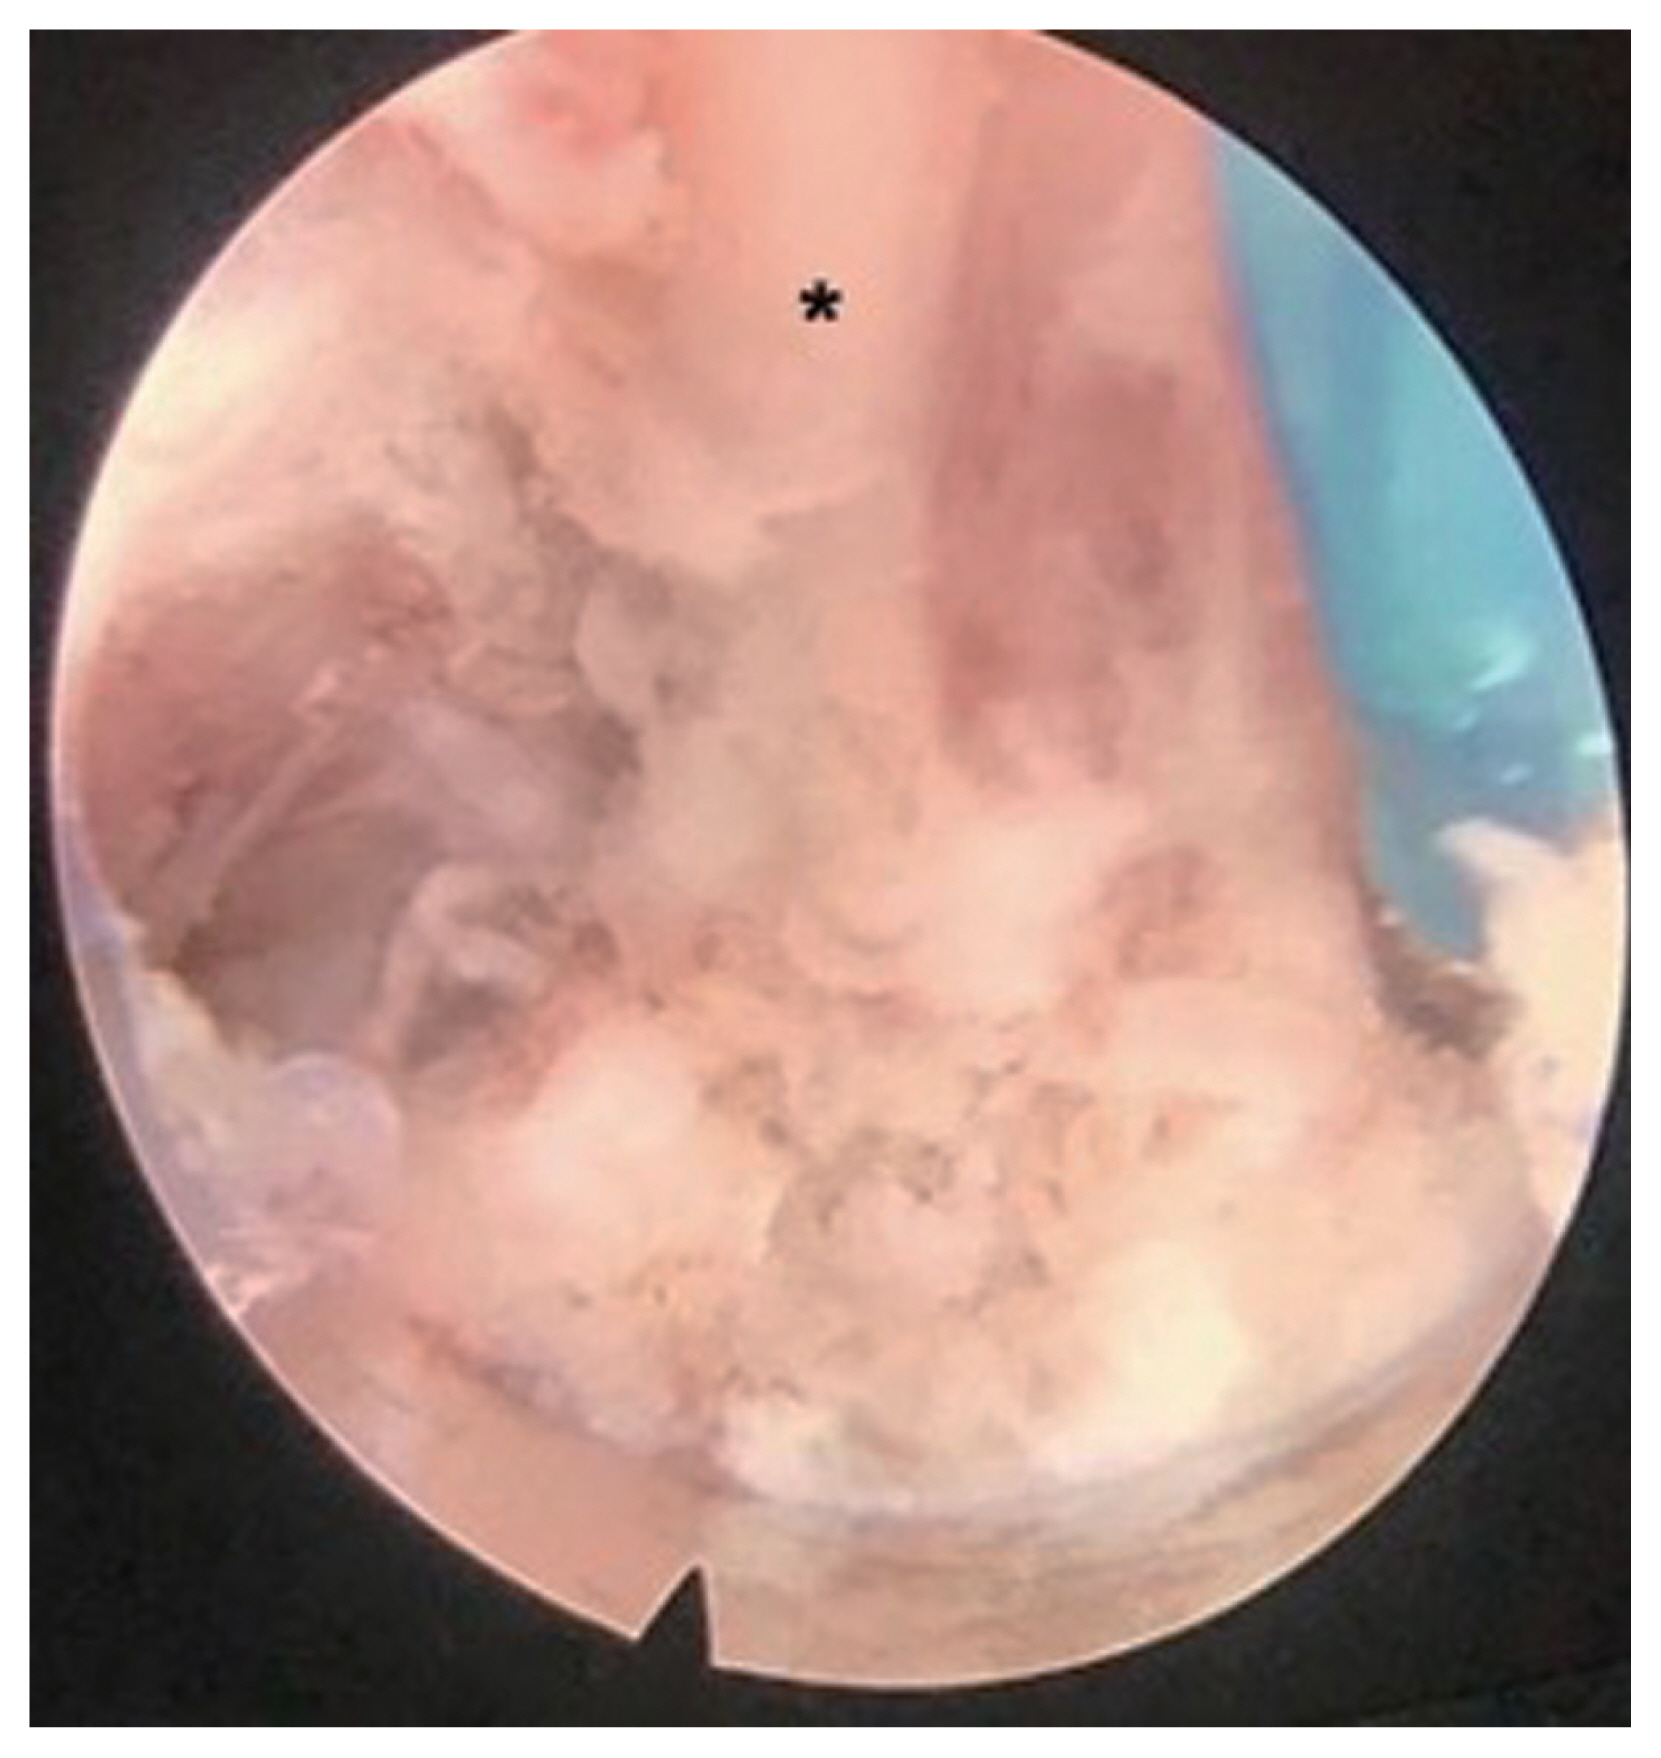
Dorsal medial branch (*).
5. Data analyses
The main outcome of interest is the patients’ VAS scores. These scores were measured at 3-time points: preoperatively, 6 weeks after surgery, and 12 months after surgery. For the first 2-time points, the VAS scores of 64 patients were available. Twelve months after surgery, data from 47 individuals could be obtained as 17 patients underwent further surgery on the lumbar spine.
The aim of the main analysis was to see whether the VAS scores decreased significantly from preoperatively to 6 weeks after surgery and to 12 months after surgery. For this purpose, linear mixed-effects models were used. This method is similar to repeated-measures analysis of variance but can account for different sample sizes between time points. All p-values below 0.05 were considered statistically significant. All statistical analyses were performed using RStudio ver. 4.0.0 (RStudio, Boston, MA, USA).
Results
In this study, 64 patients were included (41 female patients [64%] and 23 male patients [36%]). The average age of the patients was 59 years. The average BMI was 27.3 kg/m2, which was slightly above the normal weight, and the average ASA score was 2. Pain relief after the FJ block of L3–S1 was nearly 80%, and the average duration of LBP was 6.4 years. The intervention took 34 minutes and led to an average pain relief of 19.2 weeks. Moreover, 15.6% of the patients still experienced significant pain relief after the second follow-up. Of the patients included in this study, none had a complication because of the intervention. More than half of the patients (n=35) had additive and combined degenerative changes (five had intervertebral disk degeneration, 23 had osteochondrosis/spondylolisthesis, 11 had lumbar spinal stenosis, and four had deformity of the lumbar spine), which were described in the reports of the MRI scans of the lumbar spine.
The mean VAS score was 8.05 (95% confidence interval [CI], 7.70–8.33) preoperatively and dropped to 3.38 (95% CI, 2.46–4.29) 6 weeks after surgery. Twelve months after surgery, the mean VAS score was 5.00 (95% CI, 4.18–5.82) (Fig. 6).
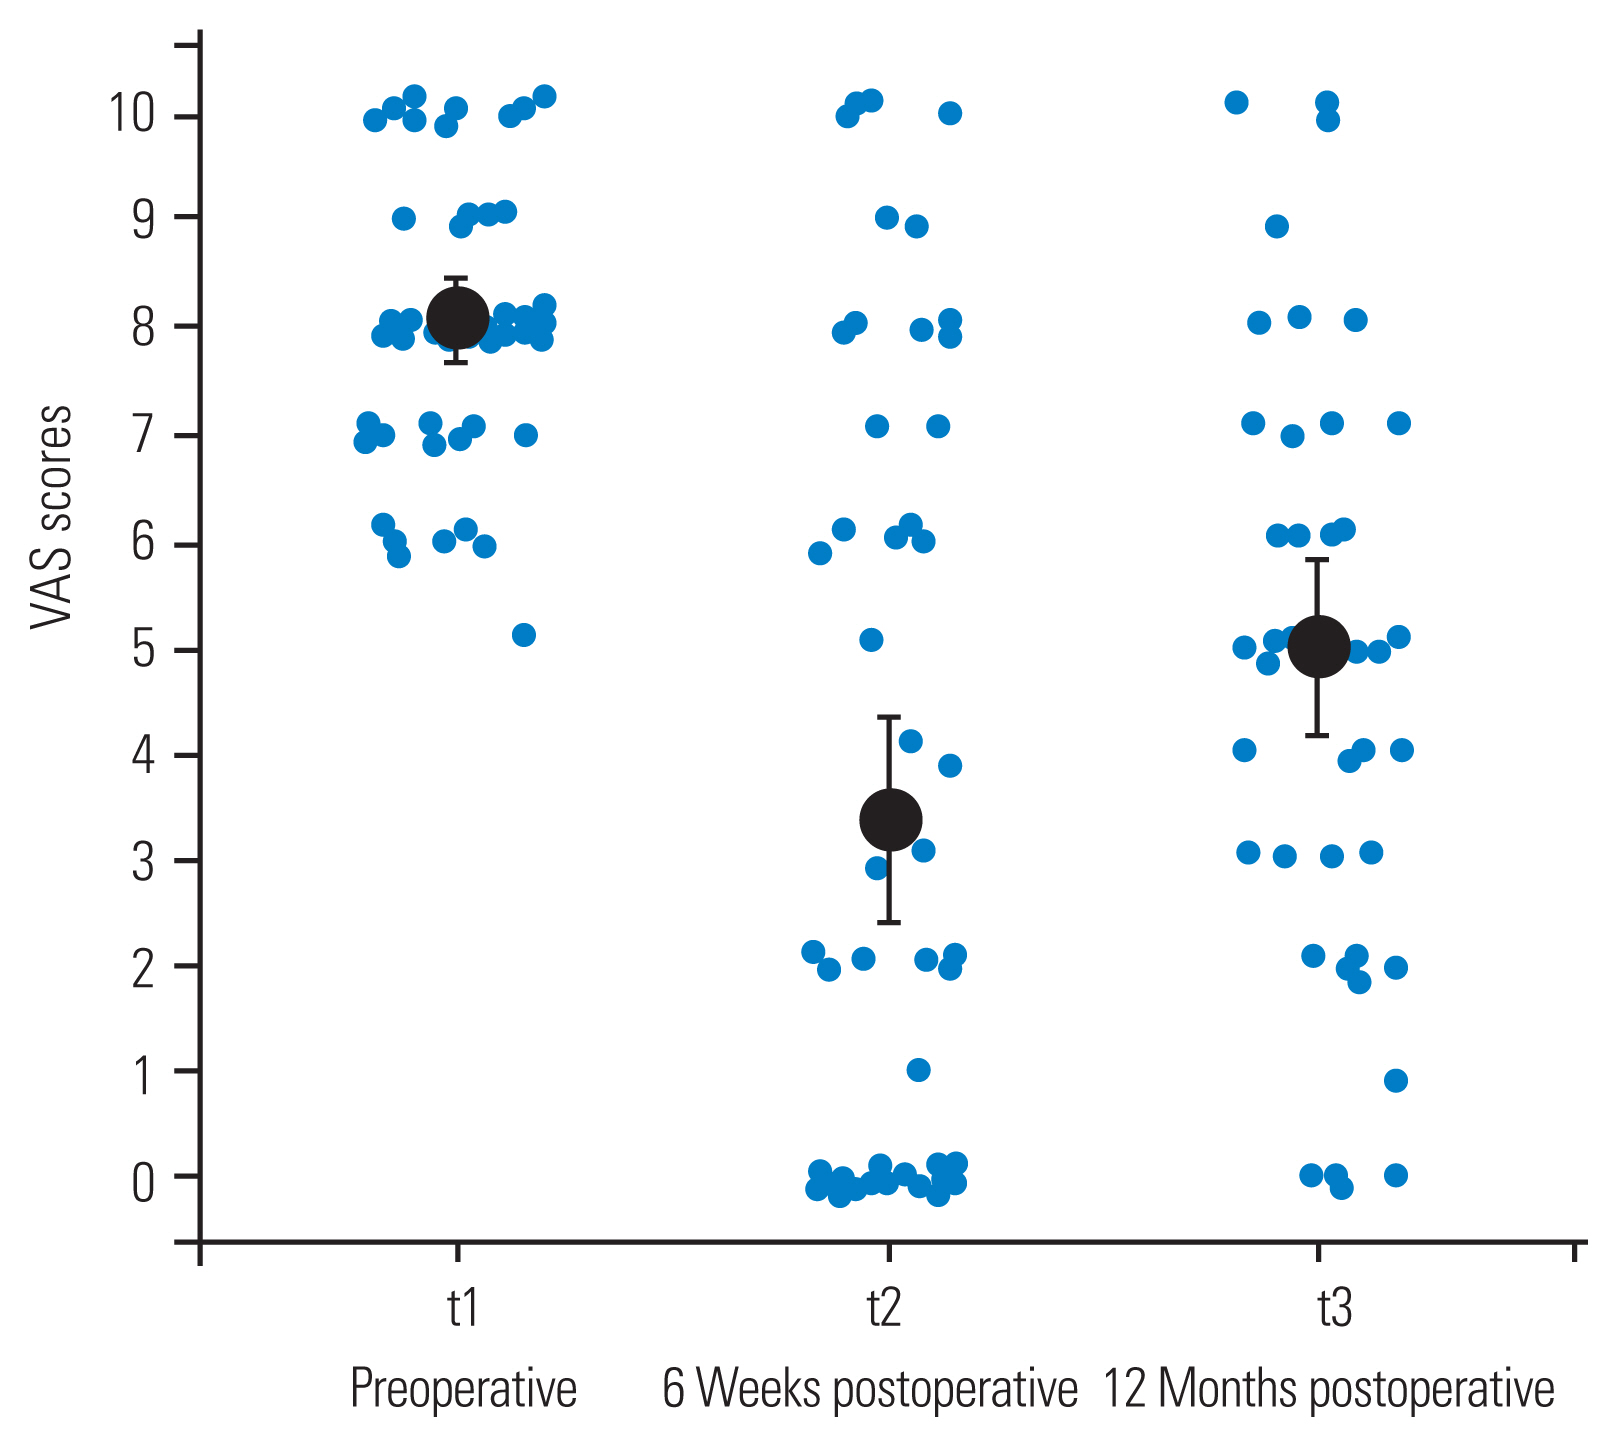
Visual Analog Scale (VAS) scores by time point. Black dots show the means and error bars their 95% confidence intervals. The jittered blue dots show each individual measurement.
A linear mixed-effects model revealed that the decrease in VAS score from the preoperative period to 6 weeks after surgery was significant (B=−4.64, p<0.001) (Table 1). The decrease in VAS from the preoperative period to 12 months after surgery was also statistically significant (B=−2.89, p<0.001). A direct comparison of VAS scores between 6 weeks and 12 months after surgery also yielded a significant change (B=1.95, p<0.001; not tabulated). The treatment effectively reduced VAS scores by 58% in the short term (6 weeks) and 38% in the long term (12 months).
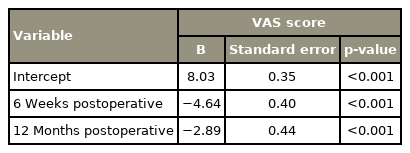
Linear mixed effects model predicting VAS score as a function of time point
1. Severity of degenerative changes
Furthermore, whether the reduction in VAS scores was equal between patients with different severities of degenerative changes in terms of additive degenerative changes or isolated FJ osteoarthritis was investigated.
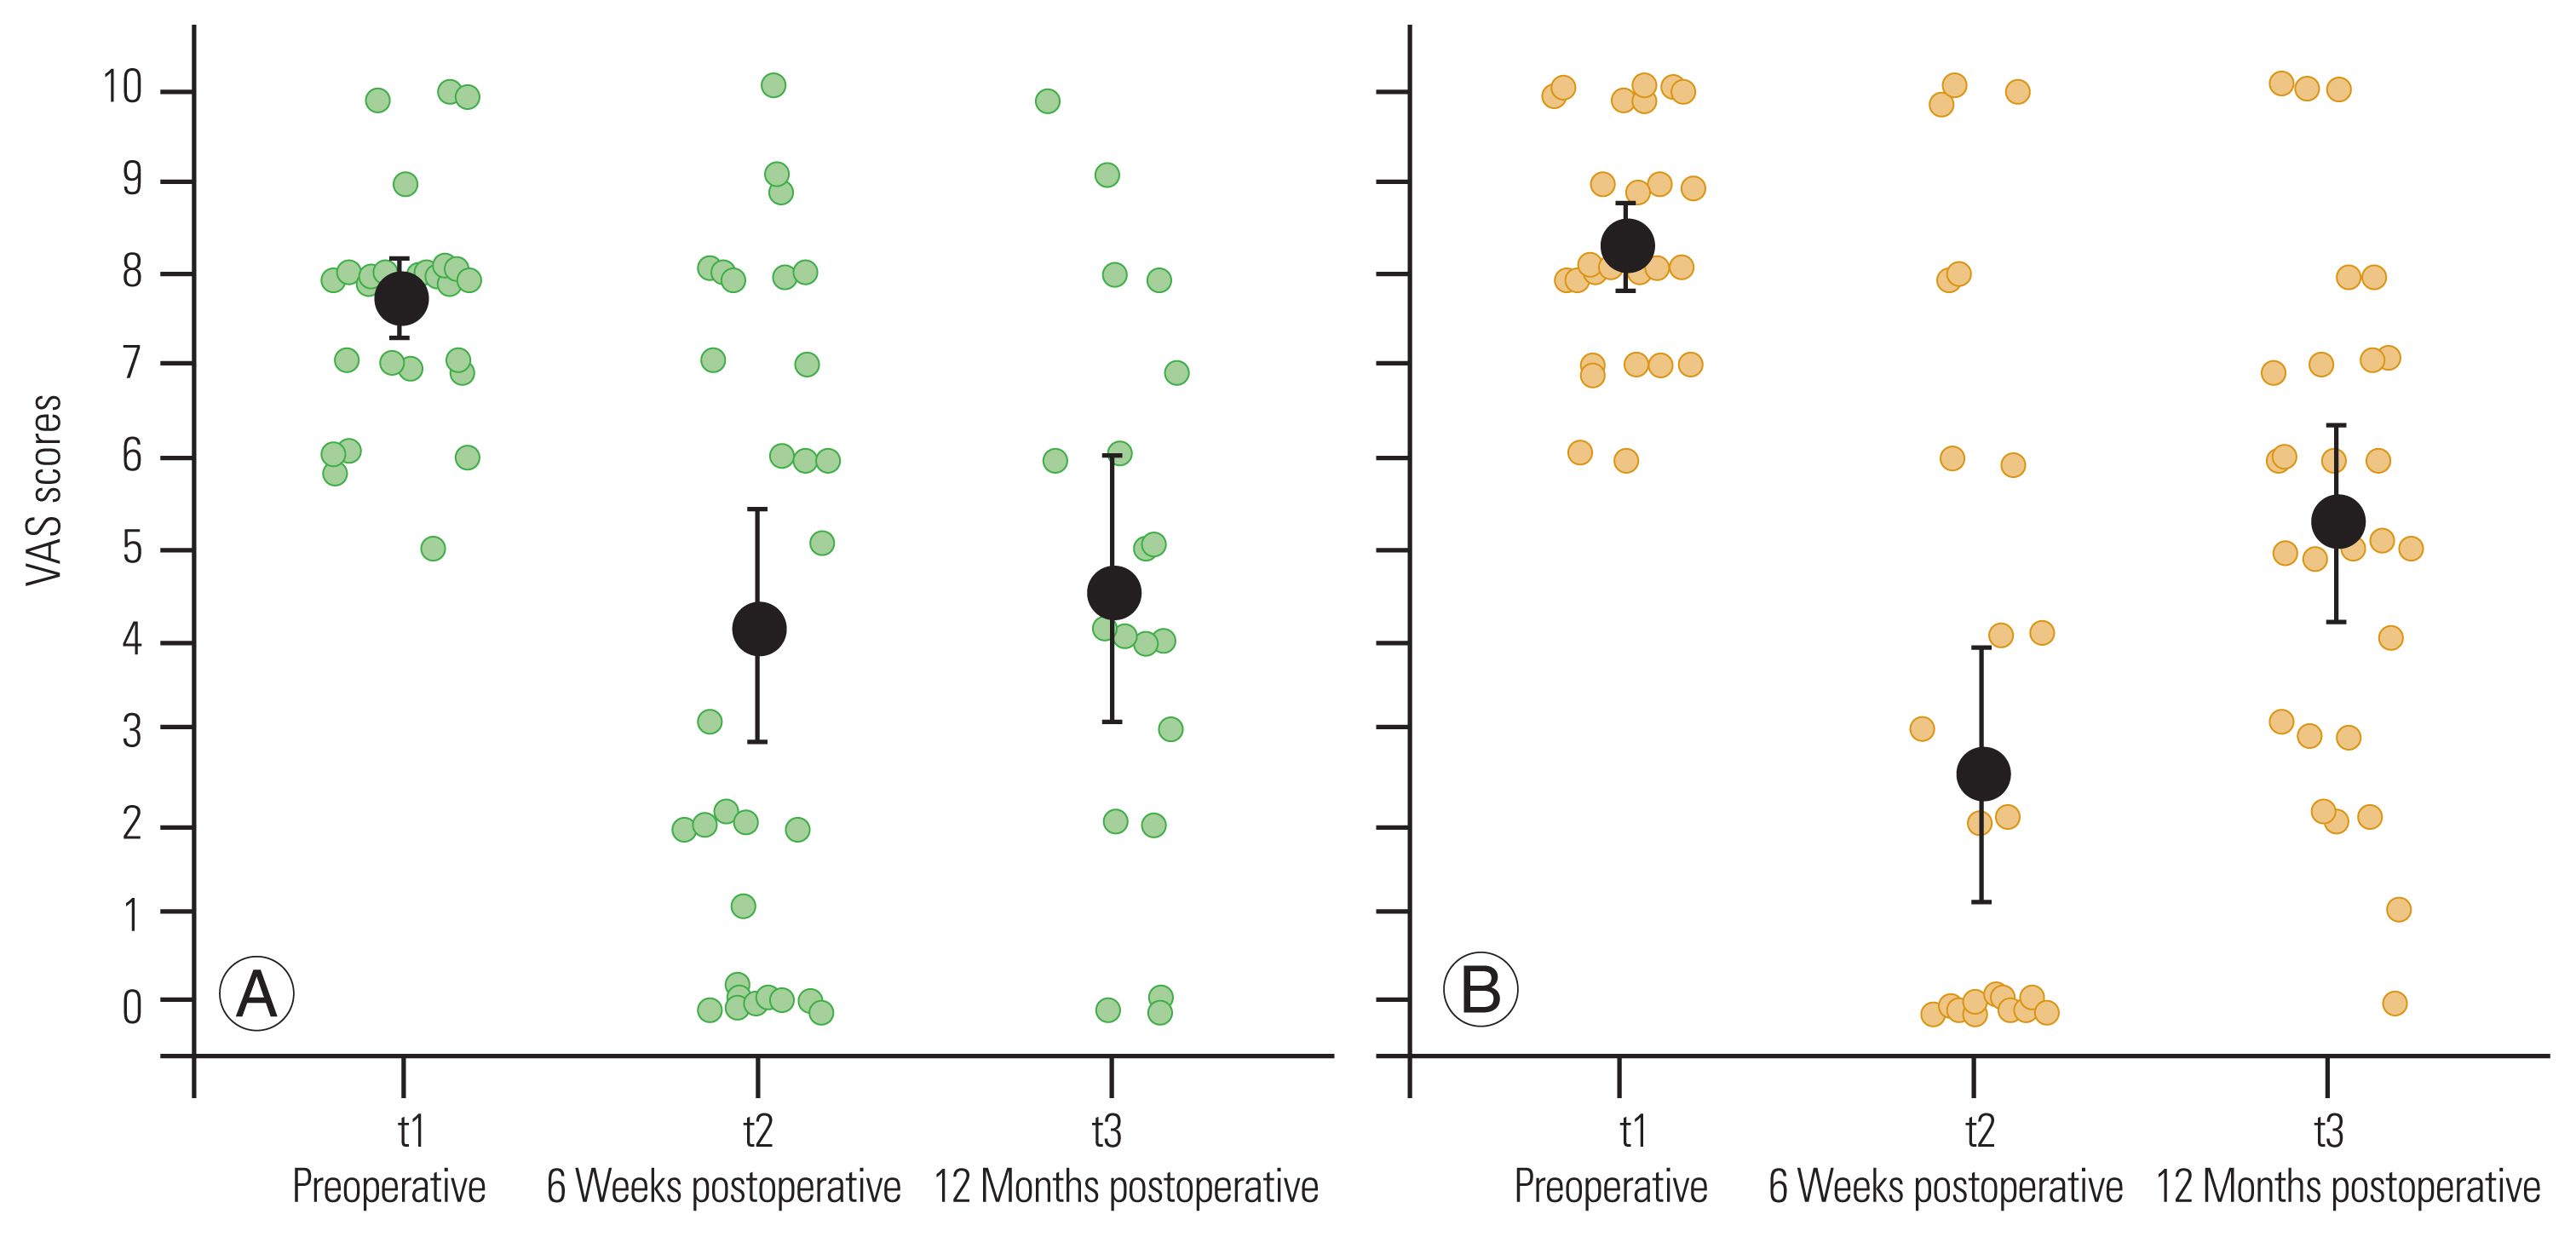
Patients with additive degenerative changes had a mean VAS score of 8.22 (95% CI, 7.84–8.60) preoperatively, which was reduced to 5.00 (95% CI, 3.78–6.22) 6 weeks after surgery. Twelve months after surgery, the mean VAS was 6.11 (95% CI, 4.98–7.22) for this group (Fig. 7). For patients with isolated FJ osteoarthritis, the mean VAS score was 7.79 (95% CI, 7.29–8.29]) preoperatively and dropped to as low as 1.59 (95% CI, 0.54–2.64) 6 weeks after surgery and 4.15 (95% CI, 3.08–5.22) 12 months after surgery. A descriptive comparison based on Fig. 7 suggests that patients with isolated FJ osteoarthritis profited more strongly from the procedure than patients with additive degenerative changes.
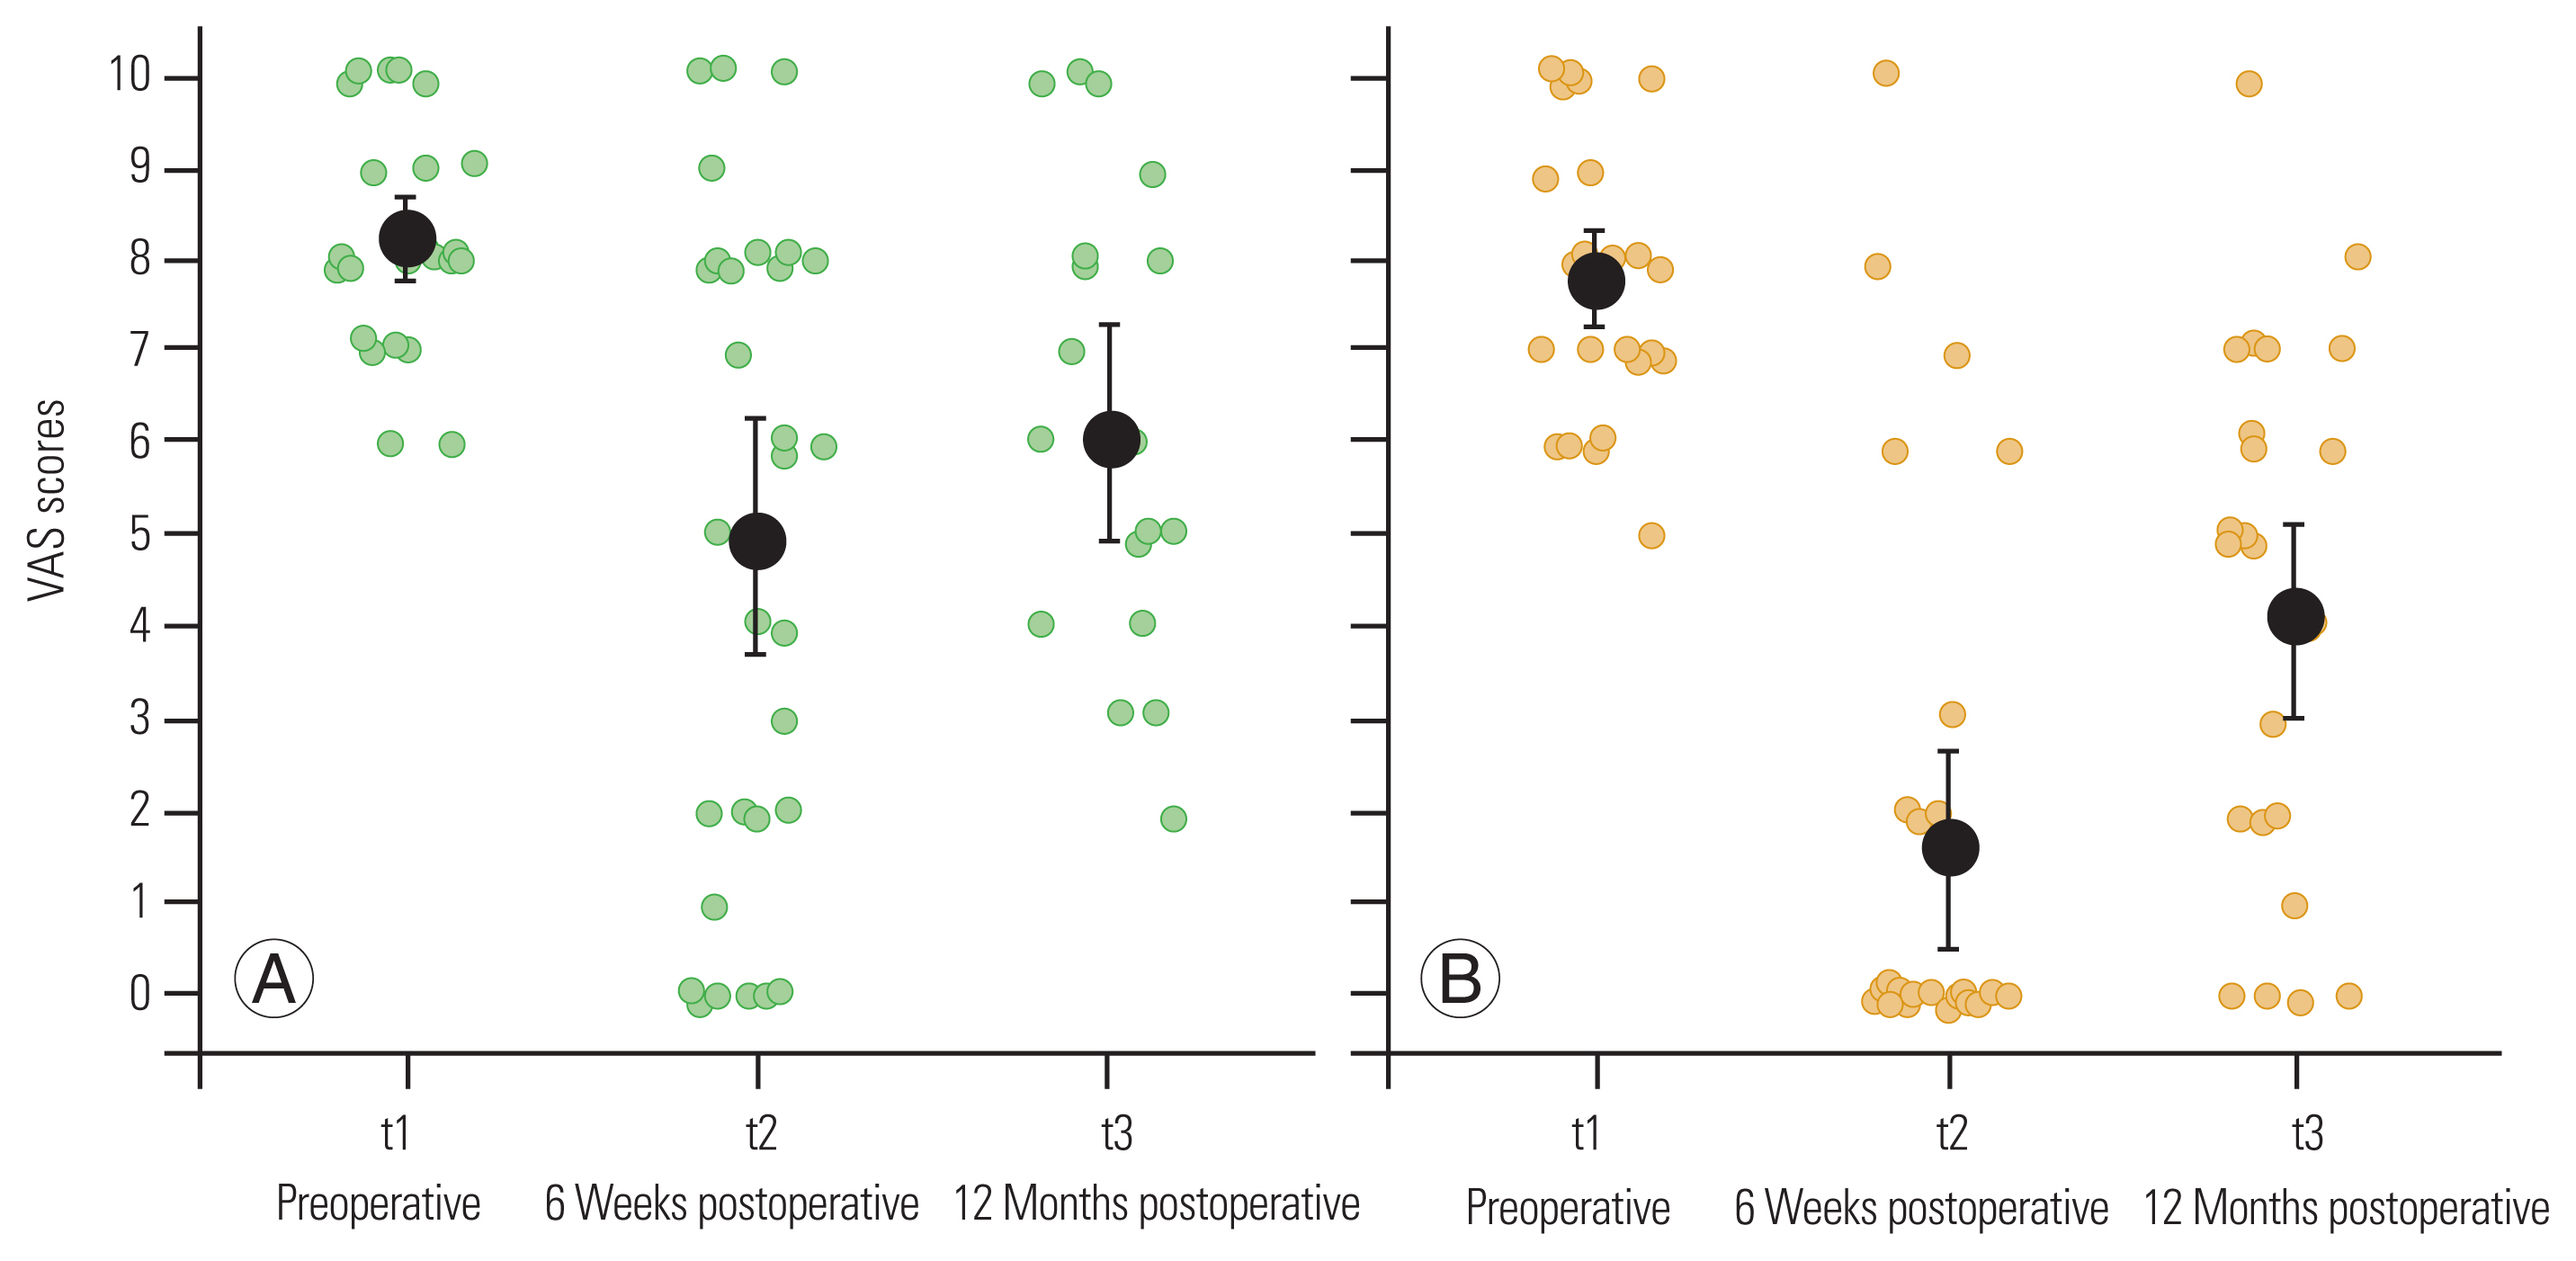
Visual Analog Scale (VAS) score by time point and severity of degenerative changes. Black dots show the means, error bars their 95% confidence intervals. The green and yellow dots show each individual measurement. (A) Additive degenerative changes. (B) Isolated facet joint osteoarthritis.
To test this, a linear mixed-effects model was created, where the time points along with a severity indicator and the interaction terms between these variables were entered. First, the model tested the change in VAS scores for patients with additive degenerative changes and the interaction terms and then tested whether the changes in VAS scores were different for patients with isolated FJ osteoarthritis. The linear mixed-effects model is shown in Table 2.

Linear mixed effects model predicting VAS score as a function of time point and severity of degenerative changes
Importantly, the model shows that on a baseline level, no significant differences were observed between the two patient groups (B=−0.38, p=0.552) (line “Severity” in Table 2). The results over time suggest that for patients with additive degenerative changes, the decrease in VAS scores from the preoperative period to 6 weeks after surgery was statistically significant (B=−3.22, p<0.001). The first interaction term showed that the reduction in VAS scores from the preoperative period to 6 weeks after surgery was even more pronounced for patients with isolated FJ osteoarthritis (B=−2.99, p<0.001). This effect can be read as follows: for patients with additive degenerative changes, the VAS scores were estimated to decline by 3.22 points from the preoperative period to 6 weeks after surgery. For patients with isolated FJ osteoarthritis, the VAS scores declined by another 2.99 points, with a total of 6.21. Considering the comparison of the VAS scores between the preoperative period and 12 months after surgery, the reduction in VAS scores was significant for patients with additive degenerative changes (B=−2.05, p<0.001). This time, the reduction was estimated to be of equal size for patients with isolated FJ osteoarthritis (B=−1.58, p=0.058), although this decrease tended to also be more pronounced. Direct comparisons of the VAS scores between 6 weeks and 12 months after surgery yielded significant increases for both groups (not tabulated).
In summary, for patients with additive degenerative changes, the treatment effectively reduced the VAS scores by 39% in the short term (6 weeks) and 26% in the long term (12 months). Patients with isolated FJ osteoarthritis profited more strongly from the treatment. Their average VAS scores declined by 80% in the short term (6 weeks) and 47% in the long term (12 months).
2. Duration of low back pain
The duration of LBP varied considerably within the sample. The median duration was 4 years, with a few patients reporting pain duration as long as 20 or 30 years. To investigate whether the duration of LBP influenced the effectiveness of the treatment, first, the reduction in the VAS scores was plotted by a median split of LBP duration (Fig. 8). The two groups did not seem to change considerably, with equal VAS score changes over the 3-time points.
Visual Analog Scale (VAS) score by time point and duration of back pain. Black dots show the means, error bars their 95% confidence intervals. The green and yellow dots show each individual measurement. (A) LBP duration (0–4 years). (B) of LBP duration (>4 years).
To test this, a linear mixed-effects model was created where the time points along with the actual duration of LBP in years were entered. As shown in Table 3, no baseline differences in VAS scores were observed between patients with different reported durations of LBP (line “Pain duration” in Table 3) nor was the treatment of different effectiveness for patients with different LBP durations (see interaction terms). The only significant effects were the already established time point differences with significant decreases in VAS scores from the preoperative period to 6 weeks (B=−4.76, p<0.001) and 12 months (B=−2.96, p<0.001) after surgery.
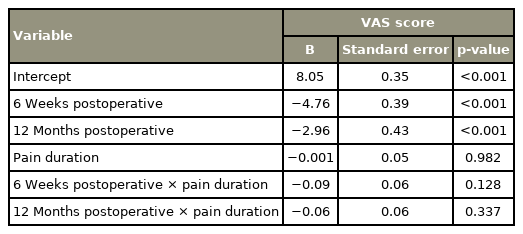
Linear mixed effects model predicting VAS score as a function of time point and duration of back pain
In summary, the variability in treatment effectiveness between patients with different durations of LBP was low. Across different durations, the mean VAS scores were effectively reduced by approximately 60% in the short term (6 weeks) and approximately 40% in the long term (12 months), which resembles the overall sample effect established earlier.
3. Comorbidities
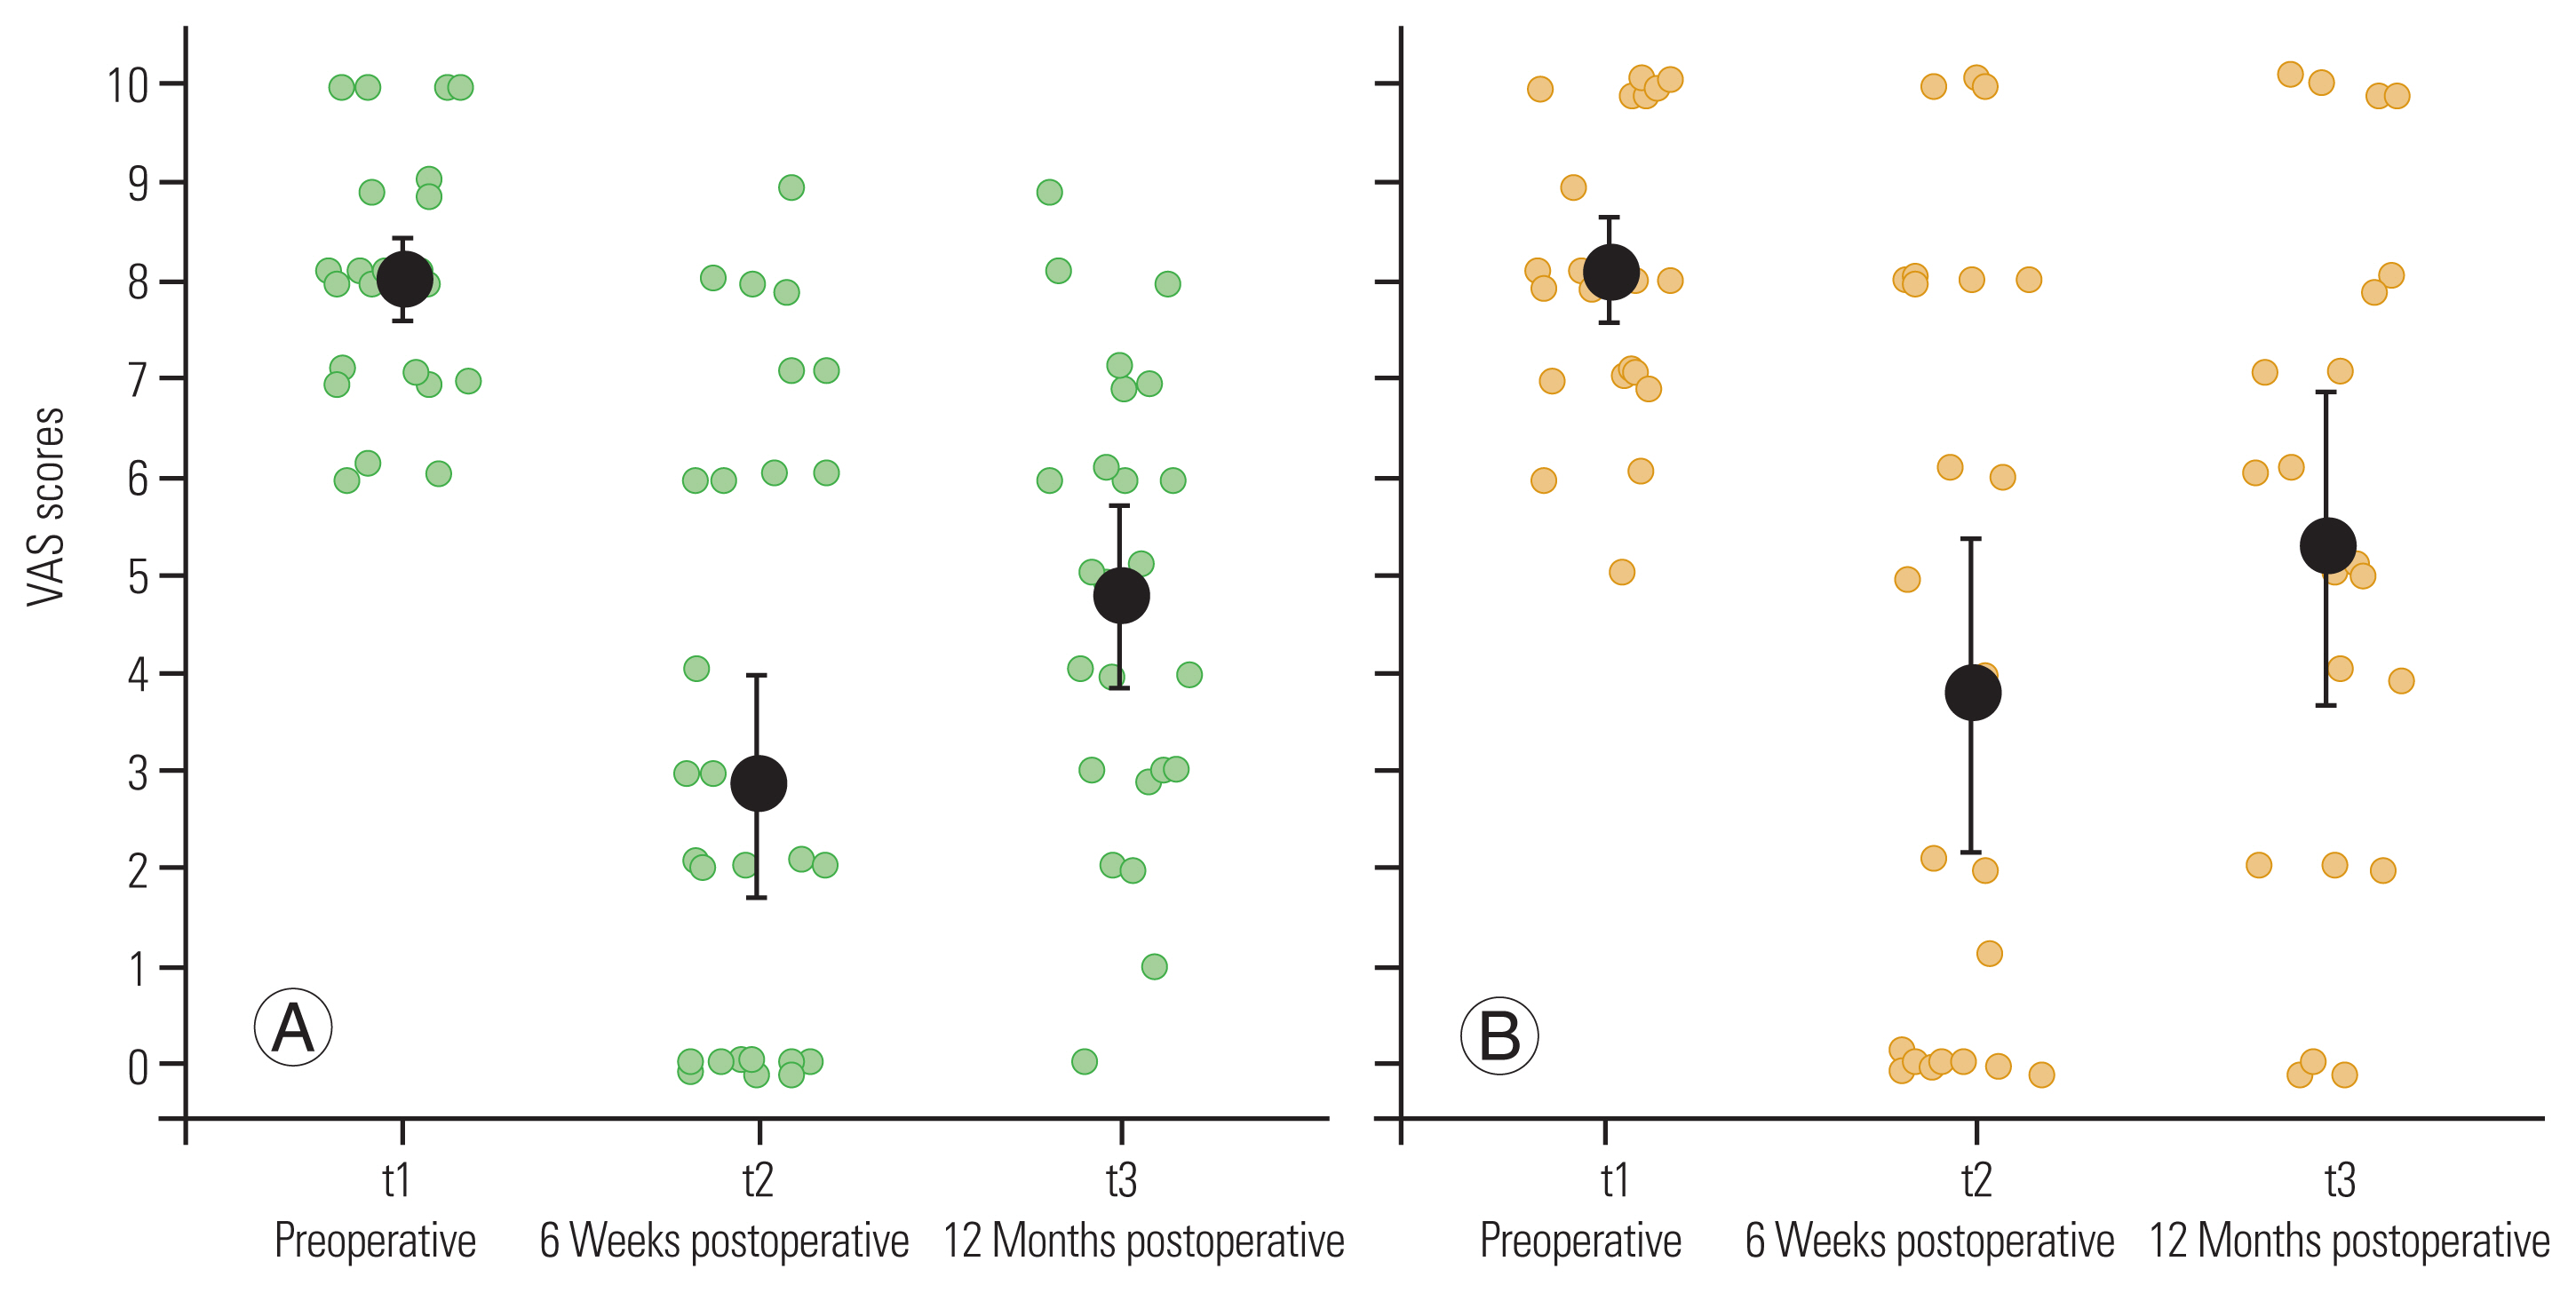
Patients with ASA physical status of 1 and 2 benefited differently from the treatment from those with ASA physical status of 3 and 4. Patients who were ASA 1 or 2 had a mean VAS score of 7.75 (95% CI, 7.33–8.17) preoperatively, which was reduced to 4.16 (95% CI, 3.78–6.22) 6 weeks after surgery and was 4.58 (95% CI, 3.23–5.93) 12 months after surgery (Fig. 9). For patients who were ASA 3 or 4, the mean VAS score was 8.31 (95% CI, 7.86–8.76) preoperatively, which decreased to 2.52 (95% CI, 1.20–3.83) 6 weeks after surgery and was 5.30 (95% CI, 4.27–6.32) 12 months after surgery. These descriptive statistics suggest that patients who were ASA 3 or 4 profited more strongly from the procedure than those with ASA physical status of 1 or 2, at least in the short term.
Visual Analog Scale (VAS) score by time point and comorbidities. Black dots show the means, error bars their 95% confidence intervals. The green and yellow dots show each individual measurement. (A) American Society of Anesthesiologists (ASA) 1 and 2. (B) ASA 3 and 4.
Again, a linear mixed-effects model was run to test this, where the time points along with an ASA group indicator and their interactions were entered. The model is shown in Table 4. First, it suggests no significant differences in the baseline preoperative pain level between the ASA groups (B=0.52, p=0.452) (line “ASA group” in Table 4). The results over time suggest that for patients who were ASA 1 or 2, the VAS scores significantly decreased from the preoperative period to 6 weeks after surgery (B=−3.59, p<0.001). The first interaction term was also significant (B=−2.20, p=0.005), indicating that the reduction in the VAS scores from the preoperative period to 6 weeks after surgery was stronger for patients who were ASA 3 or 4. The comparison of the VAS scores between the preoperative period and 12 months after surgery showed that the reduction in the VAS scores was again significant for patients with ASA 1 or 2 (B=−2.90, p<0.001). This time, the reduction was estimated to be of equal size for patients with ASA 3 or 4, as suggested by a nonsignificant second interaction term (B=−0.16, p=0.857). Direct comparisons of the VAS scores between 6 weeks and 12 months after surgery yielded a significant increase in the follow-up level only for patients who were ASA 3 or 4, reaching the follow-up level of ASA 1 or 2 patients (not tabulated).
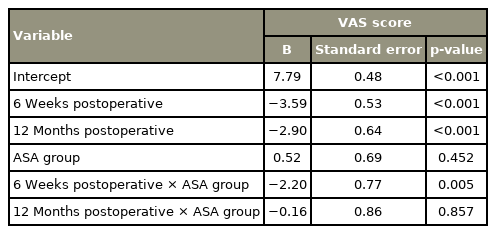
Linear mixed effects model predicting VAS score as a function of time point and ASA group
In summary, for patients who were ASA 1 or 2, the treatment effectively reduced the VAS scores by approximately 50% in the short term (6 weeks) and approximately 40% in the long term (12 months). Patients with ASA 3 or 4 profited more strongly from the treatment in the short term. Their average VAS scores declined by 70% in the short term (6 weeks); however, the long-term (12 months) reduction in the VAS scores was also 40%.
Discussion
This retrospective analysis of 64 patients evaluating the clinical outcomes of EFJD showed significant pain relief with sufficient results in patients with isolated FJ osteoarthritis.
EFJD of the lumbar spine has been investigated in several studies. Very few studies had similar results; however, these studies involved fewer patients [17,18]. Li et al. [17] included 45 patients in the operation group and 13 patients in the conservative group and reported that 44 patients had pain relief of more than 50% 1 year after EFJD. Xue et al. [18] included 30 patients in the EFJD group and 30 patients in the control group with percutaneous denervation of the MB. They reported that 29 of the 30 patients experienced pain relief of more than 50% 1 year after EFJD. Both studies indicated that many patients showed anatomical variations, which are more difficult to address through percutaneous FJ denervation.
The severity of degenerative changes of the lumbar spine is neglected in all published works, whether radiofrequency ablation or endoscopic denervation. Because the endoscopic procedure is a safe procedure with a good overview of the FJ and its surrounding structures [16], it would be important to evaluate whether capsule debridement or drainage of the FJ effusion has a positive effect on the outcome. The impact of FJ effusion remains not understood [8]. There is evidence that it can indicate segmental instability [19].
Most commonly, the denervation of the MB is evaluated by either radiofrequency ablation or endoscopic denervation; however, it could already be shown that FJ capsule denervation and endoscopic FJ debridement led to pain relief in cases of LBP originating from the FJ [15,20]. The denervation of the MB and FJ capsule and FJ debridement can be combined with EFJD, the long-term results can be improved. Therefore, the advantage of EFJD is not only the direct visualization of the MB but also the possibility of performing a denervation of the FJ capsule and debridement, which leads to the interruption of not only the pain transmission but also the pain perception through the nociceptors [15].
Whether FJ effusion contributes to the development of CLBP has not yet been proven. With the use of an endoscope, FJ effusion can easily be drained, and in further studies, whether FJ effusion drainage leads to further pain reduction could be investigated. Endoscopic denervation is a more invasive procedure, which is often performed under general anesthesia, than radiofrequency ablation; however, it offers the possibility of addressing all surrounding tissue (e.g., FJ capsule, FJ effusion, and osteophytes), which are involved in the origin of CLBP.
In everyday clinical practice, FJ denervation is often preferred over more invasive procedures. However, as patients with additive degenerative changes of the lumbar spine tend to benefit less than those with isolated FJ osteoarthritis, in these cases, EFJD should be critically and individually discussed with the patient. In contrast, patients with multimorbidity (ASA 3 or 4), this minimally invasive procedure can be weighed against a more invasive procedure.
This study has some limitations as the data have been evaluated retrospectively. Furthermore, validated quality of life questionnaires have not been used.
Conclusions
EFJD is a good treatment alternative for CLBP originating from the FJs, particularly in patients with isolated FJ osteoarthritis. Moreover, this method offers the possibility of addressing not only the dorsal medial ramus but also the surrounding tissue (e.g., FJ capsule, FJ effusion, and osteophytes) as the origin of CLBP.
Notes
Conflict of Interest
No potential conflict of interest relevant to this article was reported.
Author Contributions
Study idea: J. Bredow, F. Wallscheid, L. Löhrer, P. Eysel; study design: J. Bredow, F. Wallscheid, M. Manthey, S. Oikonomidis; data collection: F. Wallscheid, M. Manthey, C. Meyer; data analysis: J. Olsen, F. Wallscheid, S. Oikonomidis; Figures and Tables: J. Olsen, M. Manthey; paper writing: F. Wallscheid; and paper reviewing: J. Bredow, L. Löhrer, P. Eysel, J. Olsen, C. Meyer, S. Oikonomidis, M. Manthey.