Difference in Spinal Sagittal Alignment and Health-Related Quality of Life between Males and Females with Cervical Deformity
Article information
Abstract
Study Design
Large cohort study.
Purpose
To clarify spinal sagittal alignment and health-related quality of life (HRQOL) according to sex in volunteers aged >50 years with cervical deformity (CD).
Overview of Literature
Adult spinal deformities, especially those associated with lumbosacral lesions, are more frequent in females; however, CD is observed to a greater extent in males.
Methods
We divided 656 volunteers (263 males, 393 females; age, 50–89 years [mean, 73 years]) as follows: males with CD (CDM; 82 patients); males without CD (NCDM, 181); females with CD (CDF, 36); and females without CD (NCDF, 357). CD was defined as C2–7 sagittal vertical axis (SVA) ≥40 mm. We measured pelvic tilt (PT), pelvic incidence minus lumbar lordosis (PI−LL), thoracic kyphosis, T1 slope, cervical lordosis, C7 SVA, and C2–7 SVA. HRQOL was evaluated using EuroQOL five dimensions questionnaire (EQ-5D).
Results
In CDM, NCDM, CDF, and NCDF groups, the respective parameters were as follows: PT: 15°, 14°, 26°, and 21°; PI−LL: 7°, 5°, 16°, and 10°; C2–7 SVA: 49, 24, 46, and 20 mm; C7 SVA: 61, 40, 75, and 47 mm; and EQ-5D: 0.82, 0.88, 0.78, and 0.81. PT and PI−LL were significantly greater in the CDF group than in the NCDF group (p<0.05) but were not significantly different between CDM and NCDM groups. The CDF group already showed deterioration of spinopelvic alignment, although it was maintained in the CDM group. EQ-5D in showed significantly greater deterioration the CDM group than in the NCDM group; deterioration of lumbopelvic parameters had less influence in males (p<0.05).
Conclusions
Sagittal spinal deformity may have different mechanisms in males and females. The deterioration of spinal sagittal alignment in males may originate from the cervical spine, and CD may be associated with HRQOL.
Introduction
It is generally known that spinal sagittal malalignment causes poor health-related quality of life (HRQOL) [12345]. Because lumbar and pelvic parameters are strongly related to HRQOL, they have been well investigated. However, it has recently been reported that HRQOL deteriorates not only because of lumbar spine and pelvic malalignment but also because of cervical deformity (CD) [67891011].
The prevalence of CD is high (53%) in adults with spinal deformity [12]. However, it is unclear how CD impacts pelvic, lumbar, thoracic, and cervical alignments and HRQOL. Many reports have investigated spinal sagittal alignment, but few have investigated sex differences. We have previously reported that the deterioration of spinal deformity originates from the pelvis in females and the cervical spine in males [6]. Therefore, given that the mechanism underlying worsening of spinal sagittal alignment varies according to sex, it is important to evaluate the sex differences. We have also previously reported that CD is significantly associated with HRQOL and that deterioration starts after the age of 60 years [6]. Therefore, it is also important to evaluate CD in the elderly.
Considering these issues, we investigated sex differences in spinal sagittal alignment and HRQOL in volunteers with CD aged ≥50 years.
Materials and Methods
1. Institutional Review Board
The study protocol was approved by the Institutional Review Board of Hamamatsu University School of Medicine, Shizuoka, Japan (Toei Hospital; IRB No. 201201).
2. Volunteer cohort
We investigated 746 volunteers who participated in the Toei town musculoskeletal examination program in 2012. All volunteers were healthy who could walk to Toei Hospital alone without assistance. They joined our health-screening program after receiving information from the general announcement by the Toei Hospital.
3. Inclusion/exclusion criteria
The inclusion criteria were age of 50–89 years, available whole-spine and pelvic X-rays taken with the patient in a standardized standing position, and informed consent provided. The exclusion criteria were Cobb angle of ≥25° in the coronal plane; symptomatic osteoporotic fractures with severe wedge-shaped vertebra with Genant semiquantitative grade 3 [13]; history of other pathologies (tumor, infection, etc.), total joint arthroplasty, and instrumented spinal surgery; and unable to stand without assistance.
4. Radiological assessment
The radiographic technique was standardized as follows: (1) the volunteers were in a standing position, looking straight ahead with the hands placed on the clavicle; (2) acquisition of three views (anteroposterior and lateral craniopelvic views and lateral pelvic view); and (3) a distance of 1.5 m between the X-ray tube and radiograph. The digitized radiographs were transferred as Digital Imaging and Communications in Medicine data to a computer. Radiographic parameters were measured using imaging software (Surgimap Spine, Nemaris, Inc., New York, USA). Radiological measurements were reviewed by two experienced spine surgeons.
5. Measured parameters
The measured radiographic parameters were as follows: (1) pelvic tilt (PT), (2) sacral slope (SS), (3) pelvic incidence (PI), (4) pelvic incidence minus lumbar lordosis (PI−LL), (5) LL (the angle between the L1 and S1 superior endplates), (6) thoracic kyphosis (TK; the angle between the T5 superior and T12 inferior endplates), (7) T1 slope (T1S; the angle between the horizontal plane and T1 superior endplate), (8) cervical lordosis (CL; the angle between the C2 and C7 inferior endplates), (9) C7 sagittal vertical axis (SVA; the distance between a plumb line from the center of the C7 vertebral body and posterior superior corner of the sacrum), (10) C2 SVA (the distance between a plumb line from the center of the C2 vertebral body and posterior superior corner of the sacrum), (11) C2–7 SVA (the distance between a plumb line from the center of the C2 vertebral body and posterior superior corner of C7), and (12) T1S–CL.
6. Clinical evaluation
The EuroQOL five dimensions questionnaire (EQ-5D) short-form health survey was used to assess HRQOL [14]. EQ-5D is a scale consisting of five dimensions (mobility, self-care, usual activities, pain/discomfort, and anxiety/depression). A score of 0–1 indicates that one is perfectly healthy and a lower score indicates an unhealthy state.
7. Statistical analysis
SPSS vers. 21(IBM-SPSS, Inc., Chicago, IL, USA) was used for statistical analyses. Unpaired t-tests were used for analysis of sex differences. Analysis of variance and the Tukey's test (for post hoc analysis) were used for multiple comparisons. Spearman's rank correlation coefficient was analyzed for the correlation of each parameter with EQ-5D. A p<0.05 was considered statistically significant.
Results
1. Demographics
Among the 746 volunteers considered for participation in this study, 90 were excluded because they could not be assessed using the radiographs or questionnaire for HRQOL. Thus, 656 were included for analysis (mean age, 72.7±7.9 years; range, 50–89 years), with 82 (mean age, 75.4±6.1 years), 181 (mean age, 71.9±8.2 years), 36 (mean age, 76.8±7.7 years), and 357 (mean age, 72.0±7.5 years) in the CDM, NCDM, CDF, and NCDF groups, respectively (Table 1). The volunteers in the CDM and CDF groups were significantly older than those in the NCDM and NCDF groups (p<0.01). There were no differences in the body mass index in the groups. The intraclass correlation coefficients for intra/interobserver reliabilities were 0.967/0.969, 0.995/0.996, 0.996/0.990, and 0.918/0.966 for C2–7 SVA, C7 SVA, PT, and PI, respectively [18].
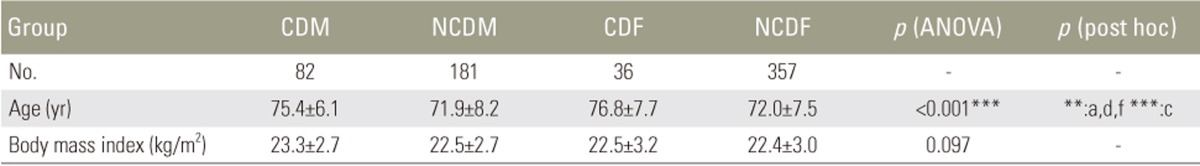
Demographic data for study population
2. Pelvic and lumbar parameters
As shown in Table 2, there were no significant differences in the mean PT between the CDM (15°) and NCDM (14°) groups. On the other hand, PT (26°) in the CDF group was significantly higher than that (21°) in the NCDF group (p<0.05). PT in females tended to be greater than that in males regardless of CD.

Pelvis and lumbar parameters
The mean SS (29°) in the CDM group was significantly lower than that (32°) in the NCDM group (p<0.05). There was no significant difference in SS between the CDF (28°) and NCDF (30°) groups. The results for PI were similar to those for PT because PI in females tended to be higher than that in males regardless of CD. The mean LLs in the CDM, NCDM, CDF, and NCDF groups were 38°, 42°, 38°, and 40°, respectively. There was no significant difference among all groups, although the mean LL in volunteers with CD tended to be lower. Moreover, there was no discrepancy in LL in terms of sex.
PI−LL in females also tended to be higher than that in males regardless of CD. Furthermore, PI−LL (16°) in the CDF group was higher than that (10°) in the NCDF group, although the difference was not statistically significant (p=0.146). On the other hand, the difference in the mean PI−LL between the CDM (7°) and NCDM (5°) groups was small and not significant (p=0.813).
These results suggested that females with CD also had deteriorated pelvic alignment, whereas males with CD had no pelvic malalignment.
3. Cervicothoracic parameters
As shown in Table 3, the mean TK (45°) in the CDF group was significantly higher than that (35°) in the NCDF group (p<0.05) and tended to be higher than that (37°) in the CDM group, although there was no significant difference. The mean TK in the CDF group was the highest among all groups.
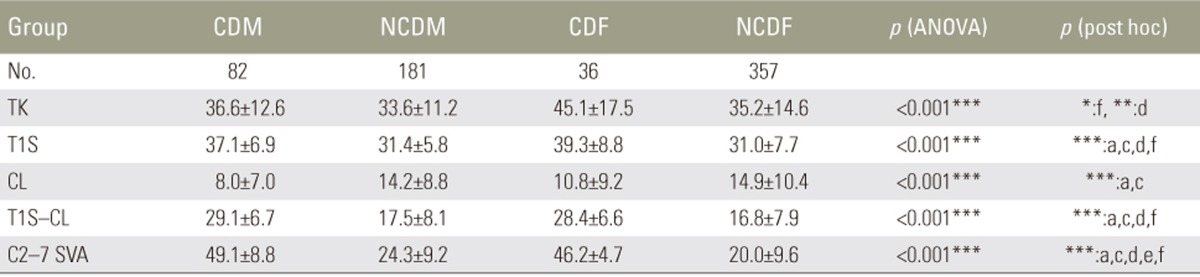
Cervicothoracic parameters
The mean T1S was significantly higher in the groups with CD than in those without CD (p<0.001). Moreover, the mean T1S in the CDF group (39°) tended to be higher than that in the CDM group (37°), although there was no significant difference. The mean T1S in the CDF group was the highest among all groups, similar to the result for TK.
The mean CL in the groups with CD tended to be lower. In particular, the mean CL (8°) in the CDM group was significantly lower than that (14°) in the NCDM group.
The mean T1S-CL was the highest in the CDM group (29°). In the CDF group (28°), the mean T1S-CL was also >20°, which was one of the definitions for CD provided by Ames et al. [16] and Passias et al. [17].
The mean C2–7 SVA in the CDM, NCDM, CDF, and NCDF groups was 49, 24, 46, 20 mm, respectively. C2–7 SVA in the CDM group was the most severely deteriorated parameter among all groups. These results suggested that CD was more severe in males compared with females.
4. Parameters of C7 SVA, C2 SVA, and EQ-5D
C7 SVA in the CDM, NCDM, CDF, and NCDF groups was 61, 40, 75, and 47 mm, respectively (Table 4), and tended to be higher in the groups with CD than in those without CD. The difference was significant between the CDM and NCDM groups (p<0.01) but not between the CDF and NCDF groups (p=0.063).
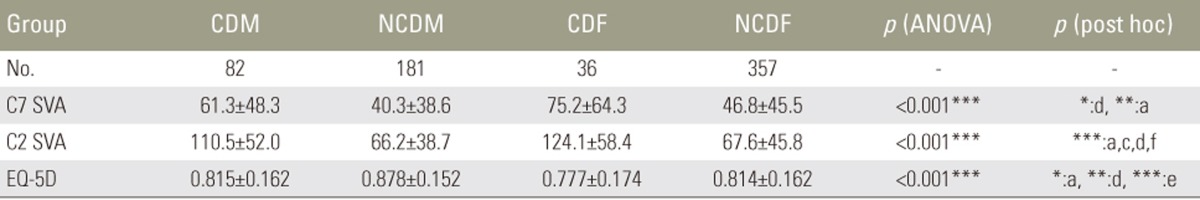
C7 SVA, C2 SVA, and EQ-5D
C2 SVA in the four groups was 111, 66, 124, and 68 mm, respectively, and was significantly higher in the groups with CD than in those without CD (p<0.001). However, there was no significant difference between males and females with CD.
EQ-5D in the four groups was 0.815, 0.878, 0.777, and 0.814, respectively. The mean EQ-5D in the CDF group was the poorest among all groups. On the other hand, EQ-5D was significantly lower in the CDM than in the NCDM groups (p<0.05).
5. Relation between EQ-5D and each parameter
As shown in Table 5, the parameters in females for which EQ-5D had a weak correlation were PT (r=−0.239, p=0.001), PI−LL (r=−0.252, p=0.001), C7 SVA (r=−0.346, p=0.001), and C2 SVA (r=−0.344, p=0.001). These were lumbopelvic and global parameters. On the other hand, the parameters in males for which EQ-5D had correlation were not observed. In other words, the mechanism of deteriorated EQ-5D was different between males and females.
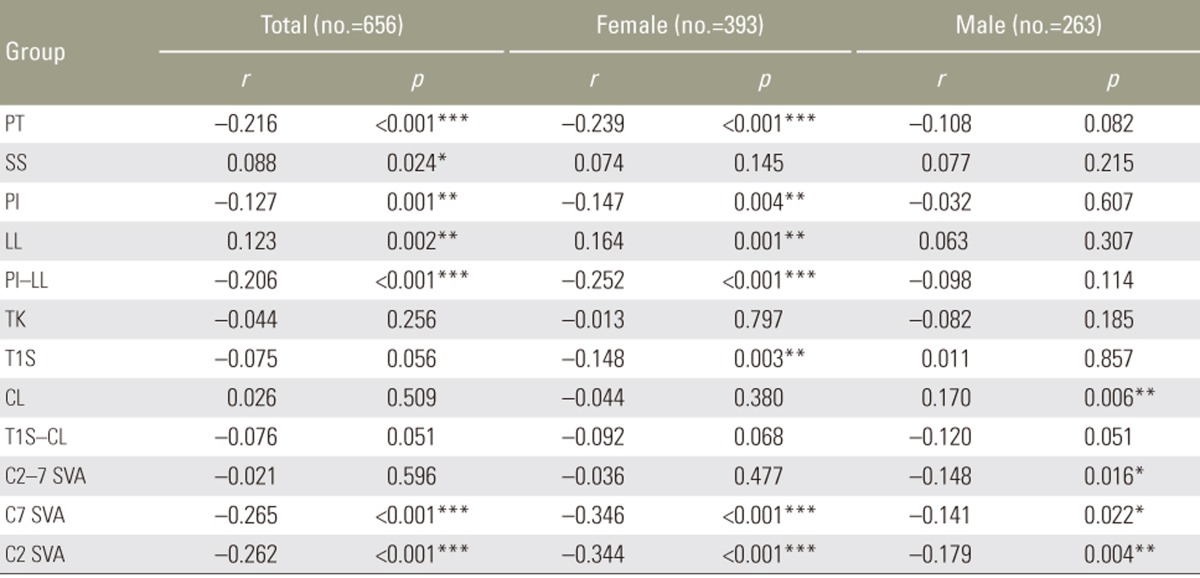
Spearman's rank correlation coefficient between EQ-5D and each parameter
Discussion
Few large-scale studies have evaluated cervical sagittal alignment [619]. Our results indicated that the mechanism underlying spinal deformity in spinal sagittal alignment was different between males and females. As shown in Fig. 1, the CDF group already had malalignment of the pelvis and thoracic spine compared with the NCDF group. On the other hand, there was no significant difference in pelvic and thoracic parameters between the CDM and NCDM groups (Fig. 2). Moreover, Fig. 3 showed that only the pelvic parameters were different between the CDM and CDF groups. Ames et al. [20] reported a correlation with adjacent sagittal parameters. Therefore, CD can initially impact the thoracic spine and subsequently result in deterioration of the lumbar spine and pelvis. Our results indicated that the deterioration of sagittal alignment originated from the cervical spine in males because pelvic alignment in the CDM group was maintained, whereas in females, the deformity originated from the pelvis because the CDF group had not only cervical malalignment but also pelvic malalignment and the pelvic parameters in the NCDF group were significantly deteriorated than those in the NCDM group (Fig. 4). In fact, CD occurred more frequently in males (31.1%) than in females (10.1%). However, why spinal deformity originates from the pelvis in females and cervical spine in males remains unclear. Further research related to this issue is warranted.

Comparison between females with cervical deformity (CDF) and females without cervical deformity (NCDF). The parameters in the CDF group that significantly deteriorated were pelvic tilt, cervical parameters, and C7 SVA (p<0.05). PT, pelvic tilt; LL, lumbar lordosis; PI, pelvic incidence; TK, thoracic kyphosis; T1S, T1 slope; CL, cervical lordosis; SVA, sagittal vertical axis; EQ-5D, using EuroQOL five dimensions questionnaire.

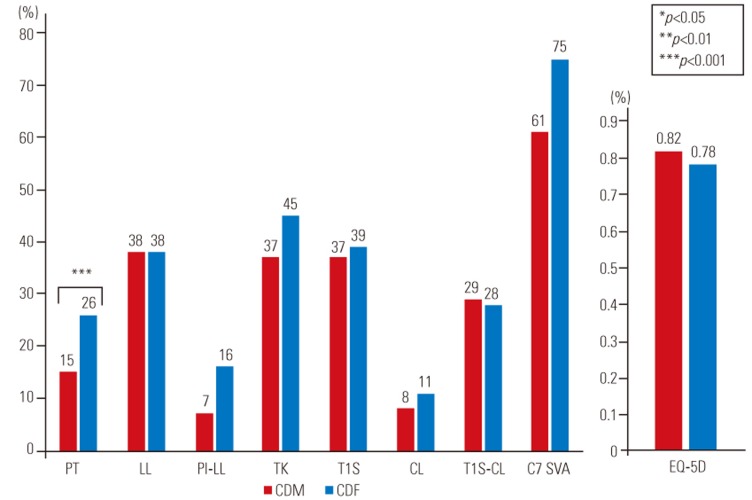
Comparison between males with cervical deformity (CDM) and males without cervical deformity (NCDM). There were no significant differences in spinal parameters except for cervical parameters and C7 SVA. However, EuroQOL five dimension questionnaire (EQ-5D) score was significantly poorer in the CDM compared with the NCDM groups (p<0.05). PT, pelvic tilt; LL, lumbar lordosis; PI, pelvic incidence; TK, thoracic kyphosis; T1S, T1 slope; CL, cervical lordosis; SVA, sagittal vertical axis.
Comparison between males with cervical deformity (CDM) and females with cervical deformity (CDF). PT significantly deteriorated in the CDF group than in the CDM group (p<0.001), although no significant difference was noted for cervical parameters and C7 SVA. PT, pelvic tilt; LL, lumbar lordosis; PI, pelvic incidence; TK, thoracic kyphosis; T1S, T1 slope; CL, cervical lordosis; SVA, sagittal vertical axis; EQ-5D, Euro quality of life 5-dimension.

Case presentations. (A) A 77-year-old female had a severe pelvic deformity (PT, 46°; PI−LL, 20°; and C7 SVA, 124 mm), while her cervical parameters were maintained (T1S, 23°; T1S–CL, 10°; and C2–7 SVA, 2.4 mm). The spinal deformity originated from the lumbopelvic region in this case. (B) The pelvic parameters were almost in the normal range in a 73-year-old male (PT, 10°; PI−LL, 6°; and C7 SVA, 51 mm). However, he had a cervical deformity (T1S, 34°; T1S–CL, 23°; and C2–7 SVA, 51 mm). The spinal deformity originated from the cervical region in this case. PT, pelvic tilt; PI, pelvic incidence; LL, lumbar lordosis; SVA, sagittal vertical axis; T1S, T1 slope; CL, cervical lordosis.
However, the difference in LL between males and females was not observed (Table 2). Siemionow et al. [21] also reported that lumbar disc degeneration similarly develops between males and females. This result also suggests that kyphotic changes in the lumbar spine have no difference in terms of sex because a decrease in LL is related to lumbar disc degeneration.
Yukawa et al. [22] reported that CL increases with age. However, our study showed the opposite result, that is, that CL in the CDM and CDF (older) groups was lower than in the NCDM and NCDF (younger) groups. An increase in CL usually occurred as a result of compensation to maintain the patients' horizontal gaze in case TK or T1S was deteriorated because of lumbopelvic deformity. In other words, this result suggested that it is possible for volunteers with CD to have a decreased CL because this compensation mechanism would already have collapsed.
Several reports have shown that C2–7 SVA >40 mm is significantly correlated with HRQOL [6723]. However, none of these studies excluded the influence of deteriorated lumbopelvic alignment. In our study, no obvious difference in lumbopelvic alignment was observed between the CDM and NCDM groups. Therefore, the influence of lumbopelvic alignment was not associated with the EQ-5D score in males. This study verified that CD was significantly associated with HRQOL because EQ-5D in the CDM group (0.815) was significantly deteriorated compared with that in the NCDM group (0.878). To the best of our knowledge, this was the first study in which CD showed a significant correlation with HRQOL without the influence of lumbopelvic alignment.
Moreover, almost all correlative parameters with EQ-5D were lumbar and pelvic parameters (PT and PI−LL) in females except for C2 SVA and C7 SVA. However, these parameters in males were not observed. Therefore, although it is usually considered that increased C7 SVA due to lumbopelvic deformity is correlated with HRQOL, our findings suggested that the main cause of deterioration of HRQOL in males is unclear. Some reports have also shown that sagittal spinal deformities in males deteriorated from cervical segments [2425]. Moreover, some reports have suggested that a high C2–7 SVA is strongly associated with cervical spondylotic myelopathy because of an increase in intramedullary pressure [910111926]. Therefore, when males with lumbopelvic deformity are treated, attention should also be paid to cervical alignment.
The primary limitation of this study was that all enrolled volunteers were Japanese and were aged >50 years. Therefore, it is unclear whether these data can be applied to other races. Second, almost all volunteers who participated in this study lived in mountainous settlements. Therefore, the environment was different from that of urban dwellers. The third limitation was the HRQOL assessment technique. Evaluation for CD may be suitable for tests, such as the Neck Disability Index questionnaire [27]. However, there have been no questionnaires specific to CD till date [22]. The fourth limitation was that the population between males and females was quite different. Finally, the number of volunteers in the CDF group was lower, which might explain why the EQ-5D score in the CDF group showed no significant difference from that in the CDM or NCDF groups, regardless of the CDF group having the poorest score among all groups.
Conclusions
Our study demonstrated that spinal deformity originates from lumbopelvic lesions in females and from cervical lesions in males. Moreover, CD may be significantly associated with HRQOL.
Acknowledgments
Source of funding as bellows: Medtronic Sofamor Danek Inc., Japan Medical Dynamic Marketing Inc., Meitoku Medical Institution Jyuzen Memorial Hospital.
We have not received funding from the NIH, HHMI, or others.
Notes
Conflict of Interest: Shin Oe and Daisuke Togawa belong to donated fund laboratory called Division of Geriatric Musculoskeletal Health.