Measurement of the Normal Lumbar Intervertebral Disc Space Using Magnetic Resonance Imaging
Article information
Abstract
Study Design
This is a retrospective study.
Purpose
We wanted to measure the distance of the normal intervetebral disc space of Koreans.
Overview of the Literature
For judging the distance of the normal intervertebral disc space of Koreans, we studied young adults who didn't have degenerative spinal change to determine the distance of the normal intervertebral disc space of each lumbar vertebral segment, and we did so by performing magnetic resonance imaging (MRI).
Methods
We studied a total of 178 outpatients who had low back pain and they underwent lumbar MRI. There were 138 males and 40 females, and their average age was 20.7 years (range, 15 to 25 years). On MRI, the segments with observed Modic change or other abnormalities were excluded from this investigation. To improvement the accuracy of measurement, two spine specialists measured the distances 2 times, and we calculated the mean value. We used paired t-tests for statistical analysis.
Results
In the total 178 patients, the average distance of intervertebral space from the 1st to the 2nd lumbar vertebrae was 24.83% (range, 18 to 32%), that from the 2nd to the 3rd was 26.92% (range, 19 to 40%), that from the 3rd to 4th was 28.88% (range, 19 to 41%), that from the 4th to 5th was 29.60% (range, 21 to 43%) and that from the 5th lumbar vertebra to the 1st sacrum was 27.52% (range, 19 to 38%).
Conclusions
In this study, we expect that knowing the normal distance of the lumbar intervertebral space of Koreans can be helpful for surgical reconstruction to treat many lumbar spine diseases, to predict the appropriate size of the devices inserted in the intervertebral space and to produce proper devices for Koreans.
Introduction
Magnetic resonance imaging (MRI) has recently become the most commonly applied diagnostic method for making the the diagnosis of lumbar spinal stenosis or herniated nucleosus purposus because it is non-invasive, it provides diverse information on the lumbar soft tissues and it provides excellent pictures of the sagittal planes and coronal planes [1-3]. Operative methods have been recently introduced, such as artificial disc replacement, that induce bone fusion through interbody fusion in the situation of restoring the intervertebral disc space while maintaining the segmental movement [4-6]. Nevertheless, there are no studies from Korea or other countries on measuring the lumbar intervertebral disc space by applying magnetic resonance imaging, and only the measurements using simple radiographs are available for the reference values of the distance of the intervertebral disc space of normal Korean adults. Determining the size of the intervertebral disc space is needed for the instruments for interbody fusion and artificial disc replacement in Koreans, and this information could help to manufacture Korean type models, and the available data is mostly concerned with Caucasians. The standard diagnosis of a reduced intervertebral disc space in Koreans could be established with using this data.
We obtained the standard values of the distance of the lumbar intervertebral disc space of normal Korean adults by performing magnetic resonance imaging.
Materials and Methods
1. The research subjects
Among the patients who visited the Department of Orthopedic Surgery with the chief complaint of lumbar pain and who underwent magnetic resonance imaging from December 2006 to February 2009, the study was conducted on 178 cases that showed normal findings on the T1 and T2 images without the findings of a change of the signal intensity of the intervertebral disc itself, and without any change of the signal intensity of the adjacent bones, according to the reading of radiologists. Among them, 138 cases were males and 40 cases were females, the average age was 21.7 years (range, 15 to 25 years), the mean age of the males was 20.51 years (range, 15 to 24 years), and the mean age of the female was 21.38 years (range, 15 to 25 years).
2. Protocol of the magnetic resonance imaging
A 1.5 Tesla scanner with the Synergy Spine coil (Phillips®, Eindhoven, Netherlands) was used for the MRI. In the sagittal planes, the T1 intensity images were constructed with a TE/TR of 10/500 ms, and the T2 intensity images were constructed with a TE/TR of 100/2800 ms, the slice thickness was 4 mm, and measurements were performed on the T1 intensity images.
3. The measurement values and methods
The measurements were performed twice by two spine surgeons using the picture archiving communication system (PACS), and the extent of the as well as the numerical values could be adjusted and the reproducibility was high and so the measurements could be accurately determined and the mean value was used. The horizontal and the vertical lengths of the intervetebral disc were measured on the mid-saggital section of the vertebral body, as seen on MRI. The central intervertebral disc space of each segment was shown as the ratio of the intervertebral disc space distance to the length of the upper margin of the lower lumbar vertebra in the area connecting the central portion of the lower margin of the upper lumbar vertebra and the central portion of the upper margin of the lower lumbar vertebra. In addition, the anterior intervertebral space distance was measured in the area connected the tip of the anterior margin of the vertebra body and the posterior intervertebral space distance was measured in the area connected the tip of the posterior margin of the vertebral body (Fig. 1). The measurements showing the change of Modic on the MRI or the segments showing other abnormal findings were excluded from the measurements.
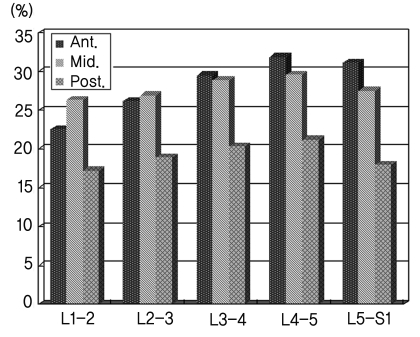
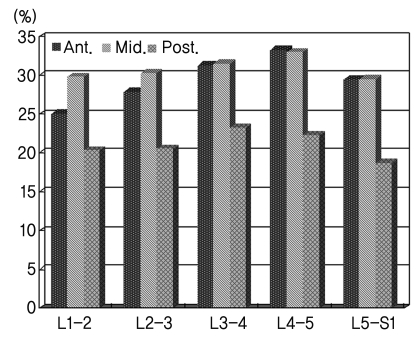
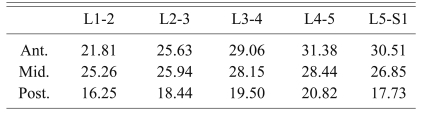
Morphometry of all the patients. Ant.: Anterior disk space, Mid.: Middle disk space, Post.: Posterior disk space.
4. Statistical analysis
The interobserver reliability was examined by applying Pearson's correlation coefficient of the first measurement and the second measurement. In each segment, statistical analysis of the average intervertebral disc space and the comparison of the males and the females were performed by paired t-tests.
Results
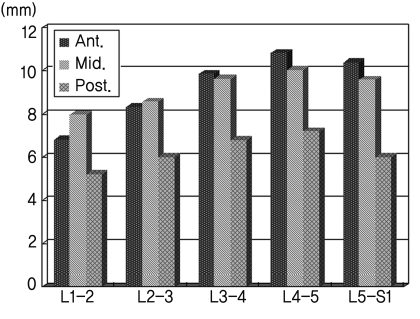
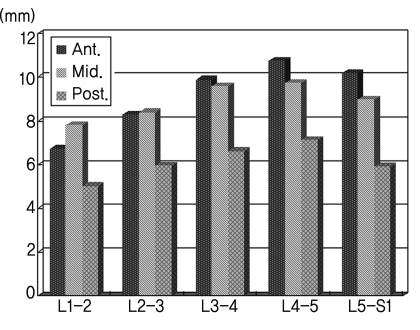
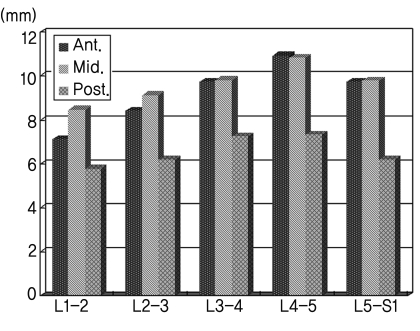
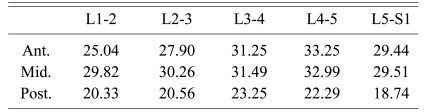
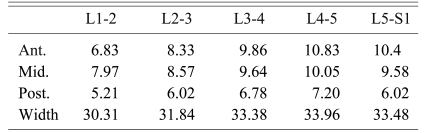
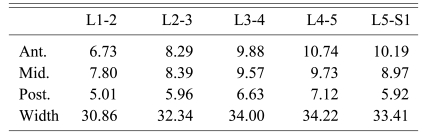
In a total of 179 cases, regarding the mean distance of the intervertebral space of each segment of the lumbar vertebra, it was shown that in the central portion, the distance of the intervertebral space between the 1st and the 2nd lumbar vertebrae was 24.83% (range, 18 to 32%) the distance of the intervertebral space between the 2nd and 3rd lumbar vertebrae was 26.92% (range, 19 to 40%), the distance of the intervertebral space between the 3rd and the 4th lumbar vertebrae was 28.88% (range, 19 to 41%), the distance of the intervertebral space between the 4th and the 5th lumbar vertebrae was 29.60% (range, 21 to 43%), and the distance of the intervertebral space between the 5th lumbar and 1st sacral vertebrae was 27.52% (range, 19 to 38%). In addition, concerning the anterior intervertebral distance, it was shown that the distance of the intervertebral space between the 1st and 2nd lumbar vertebrae was 22.54% (range, 16 to 30%), that between the 2nd and the 3rd lumbar vertebrae was 26.15% (range, 19 to 37%), that between the 3rd and the 4th lumbar vertebrae was 29.54% (range, 19 to 40%), that between the 4th and the 5th lumbar vertebrae was 31.88% (range, 21 to 45%), and that between the 5th lumbar and 1st sacral vertebrae was 31.08% (range, 19 to 38%). Regarding the posterior intervertebral distance, it was shown that the distance of the intervertebral space between the 1st and 2nd lumbar vertebrae was 17.18% (range, 12 to 26%), that between the 2nd and 3rd lumbar vertebrae was 18.93% (range, 13 to 32%), that between the 3rd and 4th vertebrae was 20.32% (range, 15 to 27%), that between the 4th and 5th lumbar vertebrae was 21.19% (range, 15 to 28%) and that between the 5th lumbar and 1st sacral vertebrae was 17.97% (range, 14 to 28%) (Tables 1-6). On the statistical analysis, the mean values were shown to be significant, and thus it was found there was no interobserver error (p < 0.05). The value measured by dividing the males and the females as well as by dividing the anterior portion, the central portion and the posterior portion of each segment showed a pattern of an increase in the distance between the 1st and 2nd lumbar vertebrae up to the distance between the 4th and 5th lumbar vertebrae, and the distance between the 5th lumbar and 1st sacral vertebrae showed a pattern of decrease (Figs. 2-7).
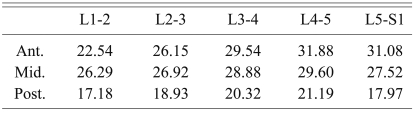
Morphometry of all patients (unit: %)
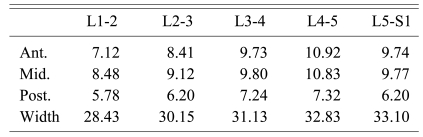
The distance of intervertebral space of female (unit: mm)
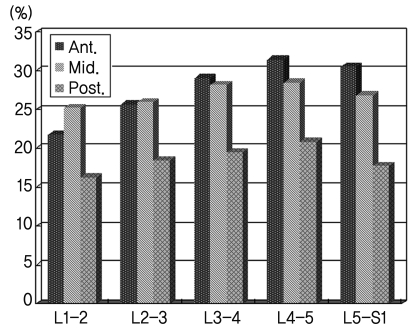
Morphometry of the males. Ant.: Anterior disk space, Mid.: Middle disk space, Post.: Posterior disk space.

Lumbar spine magnetic resonance imaging: the method of measuring the intervertebral disc space.
Discussion
Among the components forming the spine, the intervertebral disc is the component drawing most of the interest, it connects the vertebral bodies to each other and enables them to develop complex movement between them. The intervertebral disc has the structure that can most perfectly move and withstand the axial load.
The degenerative change of the lumbar intervertebra disc has been known to be a cause of back pain. Spine fusion or artificial intervertebral disc replacement has been performed for intervertebral disc degeneration, and the recovery of the height of normal intervertebral disc has been the aim of such treatments. For the case of spine fusion, the intervertebral segment fusion rate and the intervertebral foramen height are important, and these factors are associated with the height of artificial structures such as the cage inserted to the intervertebral disc space. Because of the shortcomings of lumbar fusion such as eliminating lumbar fusion segmental movement that causes alteration of the biomechanical environment of the adjacent segments and it accelerates the degeneration of the adjacent segments, many spine surgeons are considering non-fusion surgical methods to resolve such problems, and among them, the representative procedure is artificial disc replacement [7-9].
For the prevention of excess loading on the facet joint or distraction, artificial intervertebral discs should have movement that is close to the movement of normal discs. If the height of an intervertebral disc is too high, then it may induce facet joint pain, and if it is low, it induces early degeneration change of the facet joint. In such a manner, the restoration of the appropriate intervertebral disc space is an important factor.
Nevertheless, the situation is that the shape and size of the artificial discs that are currently used are limited, and the instruments that have been currently used are prepared to fit to the size of the intervertebral space of Caucasians, and thus it may not fit the smaller Orientals. Therefore, in our study, the height of the intervertebral disc of Koreans was measured by performing MRI.
The results showed that regarding the intervertebral disc height of both males and females, the typical Cranio-caudal pattern was an increased from the height between the 1st and 2nd lumbar vertebrae to the height between 4th and the 5th lumber vertebrae, and a decreased between the 5th lumbar and 1st sacral vertebrae was shown. A similar result was shown in a study conducted in Korea that measured the lumbar intervertebral disc height using simple radiographs [10].
Through this study, the reference value of the normal intervertebral disc height of each segment of normal Korean males and females was shown. However, during the day time, the height of an intervertebral disc varies depending on time and the activity pattern of individuals and this has been proven by numerous studies to be due to the reduction of water in the nucleus in response to the load delivered to the spine [11]. This study did not consider the height and weight of individual, it was a study that applied MRI and the measurement time was not restricted, and thus, the shortcoming of this study may be that there was error of the intervertebral disc height according to the difference of the time of day.
Conclusions
The situation is that until now, any studies on the intervertebral space that did not develop degeneration changes have not been reported. Through this study, when performing surgical treatments for various diseases, understanding the distance of the normal intervertebral disc of Koreans would be of help and the size of instrument, etc. could be predicted. Our data may be referred to for the preparation of instruments fitted to Koreans.