Feasibility of FRAX for Prediction of Osteoporotic Vertebral Fractures in Korea
Article information
Abstract
Study Design
Retrospective study.
Purpose
To assess the feasibility and limitations of fracture risk assessment tool (FRAX) for osteoporotic vertebral fractures in the Korean population.
Overview of Literature
The FRAX algorithm is country specific and uses clinical risk factor data to calculate an individual patient's 10-year probability of hip fracture and 10-year probability of major osteoporotic fracture. However, it has not been adequately investigated for Korean.
Methods
One hundred ninety four patients who had all risk factor data for the calculation of FRAX were divided into two groups depending on the existence of vertebral fractures: the fracture group was comprised of 88 patients and the non-facture group comprised of 105 patients. We analyzed prediction of the fracture by applying respectively the Korean, Japanese, USA and UK model, and compared their FRAX results by calculating lumbar bone mineral density (BMD) instead of femoral neck BMD.
Results
The prediction of vertebral fracture using FRAX was 10.9 ± 6.2% in the fracture group, 9.5 ± 5.5% of the non-fracture group in the Korean model (p = 0.108); 17.9 ± 10.2% in the fracture group, 14.6 ± 9.0% in the non-fracture group in the Japanese model (p = 0.017). Only the Japanese model exhibited significant difference in vertebral fracture risk. The prediction of vertebral fracture using lumbar BMD instead of femoral neck BMD was 19.5 ± 12.1% in the fracture group, 16.0 ± 10.3% in the non-fracture group in the Korean model (p = 0.029). All models had statistically significant differences for the prediction of osteoporotic vertebral fracture.
Conclusions
The 10-year probability of osteoporotic vertebral fracture had underestimation of the risk considering treatment eligibility based on the National Osteoporosis Foundation guidelines. BMD that accurately reflects the contribution of each result to fracture risk should be preferred for the prediction of fracture using FRAX, when lumbar spine and hip BMD measurements are both performed for clinical purposes in Korean.
Introduction
Osteoporotic fractures are common in the aging population and are associated with high morbidity, mortality, and loss of independence [1]. The World Health Organization (WHO) proposed the definition of osteoporosis as bone mineral density (BMD) obtained using dual-energy X-ray absorptiometry (DXA) that lies 2.5 standard deviations (SD) or more below the mean value of young health women (T-score ≤ -2.5 SD). This definition has been accepted by most regulatory agencies globally and is being used as a cut-off to limit treatment access [2]. Although low BMD is a strong predictor of future fracture risks, other factors are also important. BMD alone is inadequate to identify individuals at risk for fracture [3]. Many people with fracture experience osteopenia rather than osteoporosis. Multiple risk factors define the unique risk profile for an individual. Family history of osteoporosis, personal history of fragility fracture as an adult, low body weight, and cigarette smoking are frequently mentioned for consideration in deciding whom to treat [4].
In 2008, the WHO Metabolic Disease Group focused on developing a fracture risk assessment tool (FRAX) using clinical risk factors based on femoral neck BMD to enhance fracture prediction. The FRAX algorithm is country specific and uses clinical risk factor data, with or without consideration of femoral neck BMD measurement, to calculate an individual patient's 10-year probability of hip fracture and 10-year probability of major osteoporotic fracture [5]. In addition, the National Osteoporosis Foundation (NOF) guidelines for treatment eligibility was changed to incorporate fracture history, BMD and 10-year fracture probability [6].
These new concepts are valuable as they include various clinical factors for the prediction of fracture risk. However, the WHO selected the femoral neck as the reference site for BMD, and fracture risk assessment based on large epidemiologic studies that have demonstrated its performance in fracture prediction, particularly for the assessment of hip fracture risk [7,8]. When BMD is included in FRAX calculations, femoral neck measurement must be used. Another BMD measurement sites can also be used for fracture risk assessment and for osteoporosis diagnosis [9], but they are not currently a component of FRAX. In Korea, BMD of the lumbar spine is being widely used clinically because the physical size of elderly Koreans is less than that of Westerners, giving rise to a view based on little evidence that the reproducibility of BMD measurements at the femoral neck would be poorer than that in the lumbar spine.
The objective of this study was to assess the feasibility and limitations of FRAX for the risk assessment of osteoporotic vertebral fracture in Koreans, by comparing with prediction of osteoporotic vertebral fracture using FRAX tool by applying the Korean, Japanese, USA and UK models.
Materials and Methods
This was a retrospective study consisted of 194 patients who underwent BMD measurement of both the lumbar spine and femoral neck, and possessed risk factors data for FRAX calculation from January 2008 to December 2009. We divided patients into two groups, depending on existence of vertebral fracture: the fracture group was comprised of 88 patients and the non-facture group comprised of 106 patients. Fractures and other medical diagnoses were assessed through a combination of hospital discharge records (diagnoses and procedures coded using the KCD-5) and radiographs.
The risk factors included age, height, body weight, previous fragility fracture as an adult, family history of osteoporosis (parent with hip fracture), current smoking, corticosteroid use, rheumatoid arthritis, secondary osteoporosis (e.g., type 1 diabetes, osteogenesis imperfecta in adults, untreated long-standing hypothyroidism and hypogonadism or premature menopause), and alcohol intake of more than 3 units daily. Prior fragility fracture was defined as a major osteoporotic fracture prior to BMD testing. A diagnosis of rheumatoid arthritis was taken from clinic visits and/or hospitalizations with a relevant KCD-5 code in a 3-year period prior to BMD evaluation. Prolonged corticosteroid use was defined as over 90 days of medication dispended in the year prior to BMD evaluation, at a mean prednisolone-equivalent dose of 7.5 mg per day or greater. Weight and height were recorded at the time of DXA evaluation. This study was approved by the Institutional Review Board.
The mean age of patients was 70.2 years (range, 21 to 91 years); the mean age of the fracture group was 71.8 years (range, 21 to 88 years) and the mean age of the non-fracture group was 69 years (range, 41 to 91 years). Total male-female ratio was 25 vs. 169, male-female ratio of the fracture group was 17 vs. 71, male-female ratio of the non-fracture group was 8 vs. 98, respectively. The fracture group had 13 cases of previous vertebral fracture and 10 cases of other previous fractures. The non-fracture group had 1 case of previous vertebral fracture, 2 cases of previous hip fracture and 17 cases of other previous facture (Table 1).
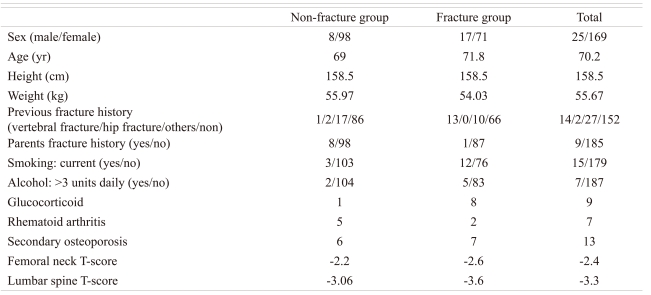
Characteristics of the 194 participants
The 10-year probability of hip and major osteoporotic fractures were compared to the results of FRAX applied to the Korean, Japanese, USA and UK models by the WHO Collaborating Centre with femoral neck BMD. We analyzed the results of FRAX by calculating lumbar BMD instead of femoral neck BMD. It was hypothesized that the difference between the lumbar spine and the femoral neck T-scores would provide an indication of whether fracture risk was higher or lower than the risk predicted from the femoral neck alone. DXA scans were performed and analyzed in accordance with the manufacturer's recommendations (Explorer, Hologic Co., Bedford, MA, USA). Hip T-scores (number of SDs above or below young adult mean BMD) were calculated from Japanese reference values. No comparable international reference standard exists for the lumbar spine, and T-scores were calculated using the manufacturer's Japanese female reference values. Vertebral levels affected by artifacts were excluded by experienced physicians using conventional criteria [10].
All results are expressed as mean ± SD unless otherwise stated. We performed risk factor analysis for vertebral fracture using logistic regression model. Group comparisons for BMD were conducted with the Student t-test. FRAX prediction of vertebral fracture and hip fracture using femoral neck BMD in the Korean, Japanese, USA and UK models were assessed using the ANOVA methods. FRAX prediction of vertebral fracture using lumbar spine BMD in the Korean, Japanese, USA and UK models were assessed using the ANOVA methods. Each result was analyzed using the SPSS ver. 12.0 (SPSS Inc., Chicago, IL, USA) and a p < 0.05 was considered statistically significant.
Results
The lumbar BMD (odds ratio [OR], 0.578; p = 0.001), smoking (OR, 14.820; p = 0.001), body weight (OR, 0.943; p = 0.008), corticosteroids use (OR, 19.972; p = 0.029) were significantly associated with osteoporotic vertebral fracture. The mean femoral neck BMD was -2.5 ± 0.9 in the fracture group, and -2.2 ± 0.7 in the non-fracture group (p = 0.005). The mean lumbar BMD was -3.6 ± 1.1 in the fracture group, and -3.0 ± 0.9 in the non-fracture group (p = 0.001).
The prediction of hip fracture using FRAX was 5.4 ± 4.2% in the fracture group, 4.0 ± 4.2% in the non-fracture group in the Korean model (p = 0.022); 7.2 ± 6.2% in the fracture group, 5.0 ± 6.0% in the non-fracture group in the Japanese model (p = 0.013); 7.7 ± 6.1% in the fracture group, 5.7 ± 7.2% in the non-fracture group in the USA model (p = 0.041); 7.3 ± 5.5% in the fracture group, 5.3 ± 5.6% in the non-fracture group in the UK model (p = 0.014) (Fig. 1). However, the prediction of vertebral fracture using FRAX was 10.9 ± 6.2% in the fracture group, 9.5 ± 5.5% in the non-fracture group in the Korean model (p = 0.108); 17.9 ± 10.2% in the fracture group, 14.6 ± 9.0% in the non-fracture group in Japanese model (p = 0.017); 18.7 ± 9.5% in the fracture group, 17.0 ± 10.4% in the non-fracture group in USA model (p = 0.232); 16.4 ± 8.5% in the fracture group, 14.5 ± 8.0% in the non-fracture group in UK model (p = 0.110) (Fig. 2). In contrast to the prediction of hip fracture, the risk of vertebral fracture was underestimated considering the eligibility of osteoporosis treatment, particularly with the Korean model.

The 10-years probability of hip fracture by Korean, Japanese, USA and UK models of fracture risk assessment tool (FRAX) using femoral neck bone mineral density in both groups.
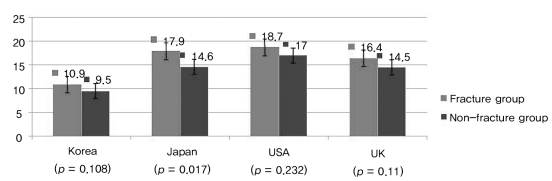
The 10-years probability of vertebral fracture by the Korean, Japanese, USA and UK models of fracture risk assessment tool (FRAX) using femoral neck bone mineral density in both groups. In contrast to the prediction of hip fracture, the risk of vertebral fracture was underestimated considering the eligibility of osteoporosis treatment, particularly the Korean model.
The prediction of vertebral fracture using lumbar BMD instead of femoral neck BMD was 19.5 ± 12.1% in the fracture group, 16.0 ± 10.3% in the non-fracture group in the Korean model (p = 0.029). All models exhibited statistically significant differences for the prediction of osteoporotic vertebral fracture (Fig. 3). Lumbar BMD offers better prediction of vertebral fracture risk than femoral neck BMD when considering treatment eligibility based on the NOF guidelines.
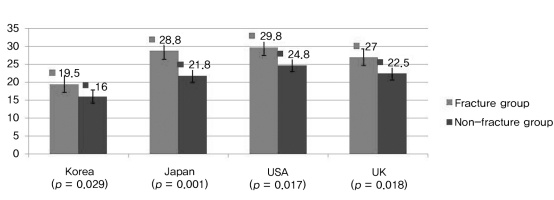
The 10-years probability of vertebral fracture by the Korean, Japanese, USA and UK model of fracture risk assessment tool (FRAX) using lumbar spine bone mineral density in both groups.
Discussion
The FRAX established by WHO was developed by incorporating the major risk factors of osteoporotic fracture based on the results of 9 cohort studies, and calculating the interaction between femoral neck BMD and each major risk factor [11]. These cohort studies included about 60,000 people. There were 5,563 fractures during research, including 978 hip fractures. The effect of each fracture risk factor was analyzed by using the Poisson regression model. The FRAX was based on the relative risk of major osteoporotic fractures calculated between each clinical risk factor. The positive aspects of FRAX include conversion of relative risk into absolute or real risk, including various risk factors, unlike DXA using BMD as threshold for osteoporosis medical intervention. The risk factors in FRAX include age, body mass index, previous fracture or fragility as an adult, family history of osteoporosis (parent with hip fracture), current smoking, corticosteroid use, rheumatoid arthritis, secondary osteoporosis and alcohol intake more than 3 units daily. However, it is important to define the intervention and assessment thresholds of fracture frequency, mortality, cost of treatment and efficacy of treatment on a country-by-country basis [12]. Also, the lumbar spine BMD is not currently part of the FRAX formulation but is being widely used in clinical practice and this creates confusion when there is spine-hip discordance [13]. Therefore, we analyzed the difference between the Korean model and the others, and the results between lumbar BMD and femoral neck BMD.
The new NOF guidelines recommended that medical therapy be considered in postmenopausal women and men aged 50 years and above, who met any of the following criteria: 1) sustained a self-reported hip or spine fracture after age 20 years; 2) had a femoral neck or spine BMD T-score ≤ -2.5; 3) had a femoral neck T-score between -1 and -2.5 SD, with a 10-year hip fracture probability ≥ 3% or major fracture (humerus, forearm, hip or clinical vertebral fracture) probability ≥ 20% [6]. The new NOF guidelines are difficult to apply in all countries. The guidelines are based on cost-effectiveness that produce 35% prevention rate for 5 years according to frequency, mortality and morbidity in the USA [14]. However, the incidence of vertebral fractures in the prospective cohorts was higher than that predicted by FRAX, showing a limitation of FRAX in clinical application. Fujiwara et al. [15] reported the absolute risk for major osteoporotic fractures was underestimated in the Japanese population, compared to Caucasians. As such, they recommended modification of the treatment threshold from 20% to 10% [15]. Recently, the Japanese committee recommended a cut-off value of 15% on FRAX as treatment threshold for major osteoporotic fractures in osteopenic patients [16]. Therefore, direct application of the NOF guidelines in Korea is inappropriate, and the guideline should be adjusted according to the socio-economic model of each country. In our study, vertebral fracture risks using FRAX was underestimated in the vertebral fracture group as 10.9% (Fig. 2), as to the results the guideline of treatment should changed to 10-15%.
Lumbar spine BMD is routinely performed in clinical practice both for baseline risk assessment and for monitering purposes. However, the WHO selected the femoral neck as the reference site for BMD [17,18]. When BMD is included in the FRAX calculation, femoral neck measurement must be used. Kanis et al. [19] presented that there were significant correlation between bone mineral measurements made at one site compared with another, but this correlation was decreased as increasing bone loss by aging. Woodson [20] found 38% of the time minor discordance and 3% of the time major discordance in analyzing 2,547 cases of lumbar and femoral neck BMD. Feyerabend and Lear [21] reported that only 50% of patient has matched results between lumbar and femoral neck BMD. When confronted with highly discordant results such as lumbar spine worse than femoral neck, clinicians are in a quandary about how this should be integrated into the decision-making process. Under some guidelines such as those from the NOF, treatment would be recommended for lumbar spine T-score in the osteoporotic range regardless of the estimated risk [22]. Where lumbar spine and hip BMD measurements are both performed for clinical purposes, BMD that accurately reflects the contribution of each result to fracture risk should be clearly preferred. Other limitation of FRAX was that the patients who had previous vertebral fracture can not be predicted the increased fracture risk. In case of asymptomatic vertebral fracture, the body mass index was increased as height was decreased, the risk of vertebral fracture may be lower estimated. The bone loss was begun in lumbar vertebra initially in almost menopausal women because lumbar vertebra had relatively more trabecular bone [23]. So the T-score of lumbar BMD was lower than the T-score of femoral neck BMD. Therefore low energy osteoporotic fracture was more frequent in thoracolumbar vertebra. In this study lumbar BMD was lower than femoral BMD. On comparison with FRAX model between lumbar BMD and femoral neck BMD, vertebral fracture probability using lumbar BMD was increased especially in Korean model. The results revealed that lumbar BMD was more suitable than femoral neck BMD for assessment of osteoporotic vertebral fracture using FRAX. This study was limited by selection bias. Patients were recruited at one center and the nature of this study was retrospective and not prospective, performed after assessment of fracture risk using FRAX, calculation of major osteoporotic fracture as risk of vertebral fracture, and the potential for interactions between lumbar spine BMD and other risk factors, including relatively small number of men. Further investigations are needed to clarify the cut-off thresholds of vertebral fractures, and the application of lumbar spine BMD for FRAX calculation by appropriate assessment of vertebral fracture probability using FRAX in a large cohort study.
Conclusions
The 10-year probability of osteoporotic vertebral fracture had underestimation of the risk considering treatment eligibility based on the NOF guidelines. Treatment guidelines with reference to FRAX prediction of major osteoporotic fractures should be adjusted to 10-15%, and BMD that accurately reflects the contribution of each result on fracture risk should be preferred for the prediction of fracture using FRAX when lumbar spine and hip BMD measurements are both performed for clinical purposes in Korean.