Evaluating Pedicle-Screw Instrumentation Using Decision-Tree Analysis Based on Pullout Strength
Article information
Abstract
Study Design
A biomechanical study of pedicle-screw pullout strength.
Purpose
To develop a decision tree based on pullout strength for evaluating pedicle-screw instrumentation.
Overview of Literature
Clinically, a surgeon’s understanding of the holding power of a pedicle screw is based on perioperative intuition (which is like insertion torque) while inserting the screw. This is a subjective feeling that depends on the skill and experience of the surgeon. With the advent of robotic surgery, there is an urgent need for the creation of a patient-specific surgical planning system. A learning-based predictive model is needed to understand the sensitivity of pedicle-screw holding power to various factors.
Methods
Pullout studies were carried out on rigid polyurethane foam, representing extremely osteoporotic to normal bone for different insertion depths and angles of a pedicle screw. The results of these experimental studies were used to build a pullout-strength predictor and a decision tree using a machine-learning approach.
Results
Based on analysis of variance, it was found that all the factors under study had a significant effect (p <0.05) on the holding power of a pedicle screw. Of the various machine-learning techniques, the random forest regression model performed well in predicting the pullout strength and in creating a decision tree. Performance was evaluated, and a correlation coefficient of 0.99 was obtained between the observed and predicted values. The mean and standard deviation of the normalized predicted pullout strength for the confirmation experiment using the current model was 1.01±0.04.
Conclusions
The random forest regression model was used to build a pullout-strength predictor and decision tree. The model was able to predict the holding power of a pedicle screw for any combination of density, insertion depth, and insertion angle for the chosen range. The decision-tree model can be applied in patient-specific surgical planning and a decision-support system for spine-fusion surgery.
Introduction
Pullout strength is an important index used by surgeons and design engineers to understand the holding power of pedicle screws. It is dependent on several factors such as bone density, insertion angle, screw geometry, and insertion technique [1-5]. A surgeon’s understanding of the stability of fusion construct is based on the perioperative intuition while inserting the screw, which is similar to insertion torque [6]. This is a subjective feeling and is dependent on the level of skill and experience of the surgeon. Studies have reported conflicting results regarding the correlation between insertion torque and pullout strength of pedicle screws [5-9]. Several experimental studies have reported a positive correlation between insertion torque and pull out strength in biomechanical tests [5-7]; however, some studies found no correlation [5,8,9]. Since insertion torque is measured during screw placement, this seldom alters screw selection in clinical practice [6]. The referenced studies were carried out on cadaver models or rigid polyurethane foam. Therefore, extrapolating the results is case dependent.
To improve the holding power of a pedicle screw, a design engineer modifies its thread parameters and material type. Pullout strength is used to compare the effect of design parameters and to develop better screw models [10-13]. Once the screw type is selected, the major factors affecting holding power of pedicle screws are bone density, insertion angle, and insertion depth. Although traditional statistical methods, including regressions, provide insight into the variables affecting pullout strength, these methods are of limited use in developing patient-specific predictive models. The authors of the current study have developed a pullout-strength calculator using an ensemble approach that is capable of predicting the pullout strength of a pedicle screw [10]. However, this model cannot be used to perform a decision analysis, which is crucial for developing a decision-support system.
In the clinical setting , a surgeon must make a judgment regarding the angle of the pedicle and insertion length for screw instrumentation. Currently, information regarding pedicle-screw insertion path in manual hand-guided insertion is based on the experience of the surgeon. With the advent of robot-assisted surgery, there is a need to develop a technique that will help decide the optimal pedicle-screw insertion path, which will lead to maximum bone-screw engagement and prevent misplacement of instrumentation [14]. Therefore, developing a decision-support system has received considerable attention from information systems researchers and practitioners [15]. Machine learning is a branch of computer science that helps computers learn without being explicitly programmed. It uses a data analysis method to come up with a pattern and automatically build analytical models that are used to for predictions of future events. Currently, these techniques are widely used in modern clinical decision-making, such as predicting the length of hospital stay [16], surgical planning for choledocholithiasis [17], strabismus [18], and other aspects of medical care. In the machine-learning approach, the data are fed to a meta-model, which finds the function of input variable to an output value, where the meta-model is capable of generating output for new inputs. This learning can be enhanced to make predictions about the future. A specific type of machine learning, namely a decision tree, learns the data patterns and helps in classification and decision analysis by explicitly providing visual representation of the decision-making process. The advantage of the decision-tree method is that it is easy to understand, it can be used for mixed data types (numerical or categorical values), and it is not influenced by outliers or missing values. Decision trees outperform linear regression-based classifier models in cases where the relationship between input and output variables is a nonlinear and/or a complex relationship [19].
A patient-specific surgical planning technique is proposed based on the pullout strength predictor and decision tree, which can act as a decision-support system for spine surgery. The assumption in the current model is that the success of fusion is defined as a biomechanically stable fusion construct, which is achieved immediately postoperation until fusion is achieved. Pullout strength predicts the initial stability of the fusion construct postoperation. Failure of fusion is defined as biomechanical failure due to loosening of the screw, which is seen in cases of osteoporotic bones.
Materials and Methods
The overall framework required to build the meta-model of decision analysis for patient-specific planning is shown in Fig. 1. Full factorial experimental studies were implemented to find the factors affecting the holding power of pedicle screws. The results of experimental studies were used to build a pullout-strength predictor and a decision tree using machine-learning tools available in Waikato Environment for Knowledge Analysis (WEKA) data mining software for Windows (ver. 3.8.1; University of Waikato, Hamilton, New Zealand) [20]. The pullout-strength predictor was used to create a decision tree that could act as a decision-support system for patient-specific surgical planning.
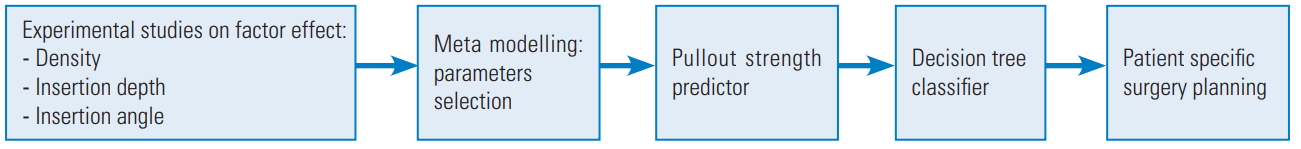
Overall framework for the study.
1. Experimental pullout studies: synthetic bone models for screw pullout
Studies using rigid polyurethane foam have helped to develop a biomechanical model of the vertebra and to study the pullout-strength phenomenon. The results of these studies have been widely reported in literature [21-23]. Studies have shown that certain densities of rigid polyurethane foam can mimic the microstructure of human trabecular bone. The compressive strength of the vertebral trabecular structure, 0.7–0.33 MPa, is comparable to polyurethane foam with a density of 80–240 kg/m3 [24,25]. The various types of foam (Polynate foam; Polynate Foams Pvt. Ltd., Bangalore, India) and their corresponding densities according to the standards of the American Society of Testing Materials (ASTM) (F-1839) are shown in Table 1 [26].
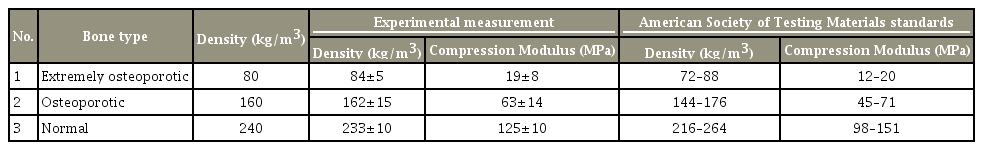
Material properties of foam used in the study
2. Pedicle-screw instrumentation
A commercial self-tapping, cylindrical, polyaxial pedicle screw has been represented in Fig. 2. This screw (Globus pedicle screw; Globus Medical, Audubon, PA, USA), had the following dimensions: outer diameter, 6.5 mm; inner diameter, 4.2 mm; thread length, 45 mm; and pitch, 2.7 mm.
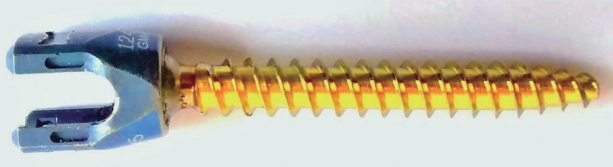
6.5×45 mm Globus pedicle screw (Globus Medical, Audubon, PA, USA).
Pilot holes were created on foam blocks with a 3.2-mm drill bit, using a swivel-and-tilt vise at different angles along the screw axis. Pre-tapping was not done on the pilot hole, and the pedicle screw was manually inserted into the foam block at varying depths and angles as shown in Fig. 3A.
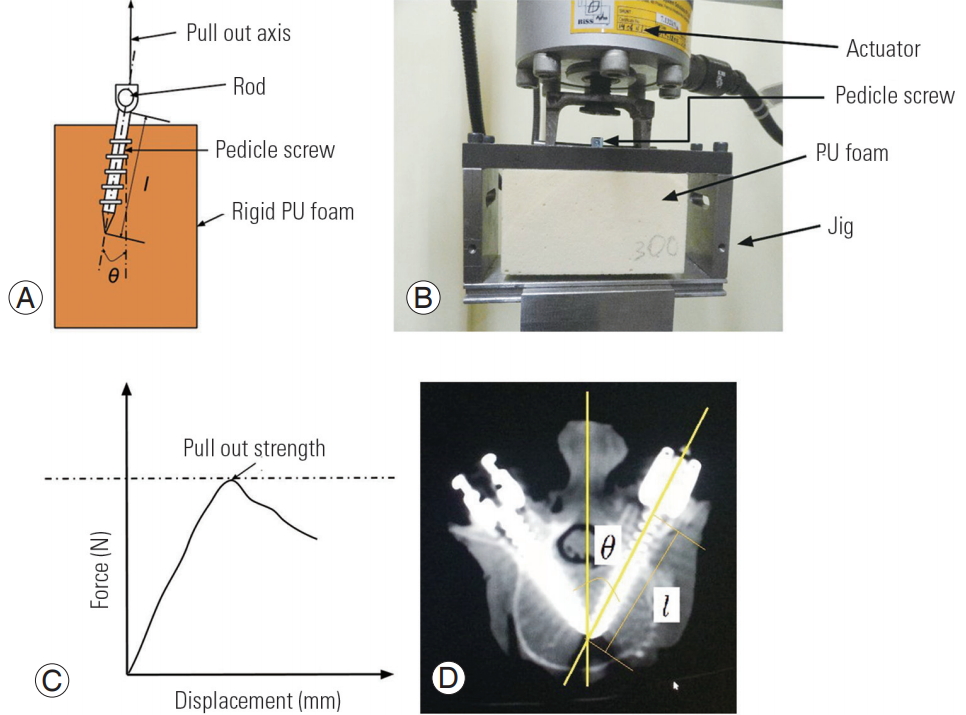
(A) Schematic representation of instrumented foam block, (B) test setup for pullout-strength studies, (C) force vs. displacement graph from pullout-strength studies, and (D) anatomy of pedicle screw instrumentation. PU, polyurethane.
A 5.5-mm high tensile steel rod was connected to the pedicle screw using a set screw. The instrumented foam block was loaded on a test jig as shown in Fig. 3B. The test jig was fixed on a BiSS Nano-25 universal testing machine with 15 kN force actuator, acquiring data at 50 Hz. A 5 mm/min tensile load was applied to the test specimen until the maximum load was reached. The load versus displacement graph is shown in Fig. 3C according to the ASTM protocol (F543–07) [27].
3. Design of experiment
A full factorial experimental design was implemented based on the factors and levels described in Table 2. The design consisted of 27 experimental combinations. Density represented the quality of human bone from extremely osteoporotic to the normal range of bone density. Insertion angle represented the medial–lateral angle of the pedicle in the sagittal plane, as shown in Fig. 3D. Based on the anatomical studies [28,29], it was found that the angle of the pedicle changed at an increment of 5° at each level from L1–L5; therefore, the angle ranged from 0° to 30° in the mediolateral region of the lumbar spine. Insertion depth represented the length to which the screw had been inserted. A 45-mm long screw was chosen because the anatomical range of pedicle chord length along the pedicle axis in the lumbar region ranged from 35–45 mm, as described in the literature [28,29]. A 100% inserted depth signified that the screw was inserted to its complete length of 45 mm without bicortical purchase. A 70% insertion depth represented of 70% of the 45 mm screw length, which is a 31.5-mm long screw. The screws were marked at different lengths to reduce the inter-sample variations while using screws of different lengths. However, this could have introduced a small moment component due to small extension (exposed length) at the point of application of the load, but this was found to be negligible compared to the pullout strength load.
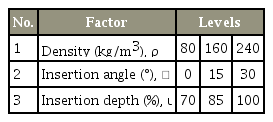
Experimental design
4. Meta-modeling
Different meta-modeling techniques were tested to build the pullout-strength predictor. The performance of the meta model was tested based on error matrix of mean absolute error, root mean square error, relative absolute error, and root relative squared error. The random forest regression model performed the best in building the model. It was a type of ensemble learning that is used for regression and classification. A ten-fold cross-validation was used for the evaluation of predictive models. The parameter that produced the least amount of error was chosen to develop the pullout predictor. A flow chart of the parameter selection method is shown in Fig. 4.

Procedure work flow to select parameters for meta-models.
The different meta-models which were tested for model building were: random forest regression, radial basis function (RBF) regressors, additive regression, and linear regression. Detailed descriptions of the algorithms are available in WEKA documentation [20].
5. Classifier modeling
Various classifier models were tested for building the decision tree. The pullout-strength value for successful fusion was assumed to be 650 N, based on the 40th percentile value of pullout-strength value, which was obtained in the osteoporotic bone model in the current set of experiments. Pullout-strength values above 650 N indicated successful fusion and below 650 N indicated pullout-strength failure. Different decision-tree-based classifiers were evaluated by area under the receiver operating characteristic (ROC) curve. An area of one represented a perfect classification. The different WEKA classifiers were as follows: random forest, logistic model trees, J48 class, and decision stump. Detailed descriptions of the decision trees and algorithms are available in WEKA documentation [20].
Results
1. Factor analysis
The results of full-factor analysis have been presented in Fig. 5A–C. Based on analysis of variance analysis, it was found that all the factors under study had a significant effect (p<0.05) on the holding power of pedicle screws. Hence, all the factors were chosen to build a model for the pullout-strength predictor. In the case of density, the pullout strength increased with an increase in density. Furthermore, pullout strength increased with an increase in insertion depth. The greatest pullout strength (1,638 N) was achieved in the normal bone model (240 kg/m3), with 100% screw engagement inserted at a 15° angle.
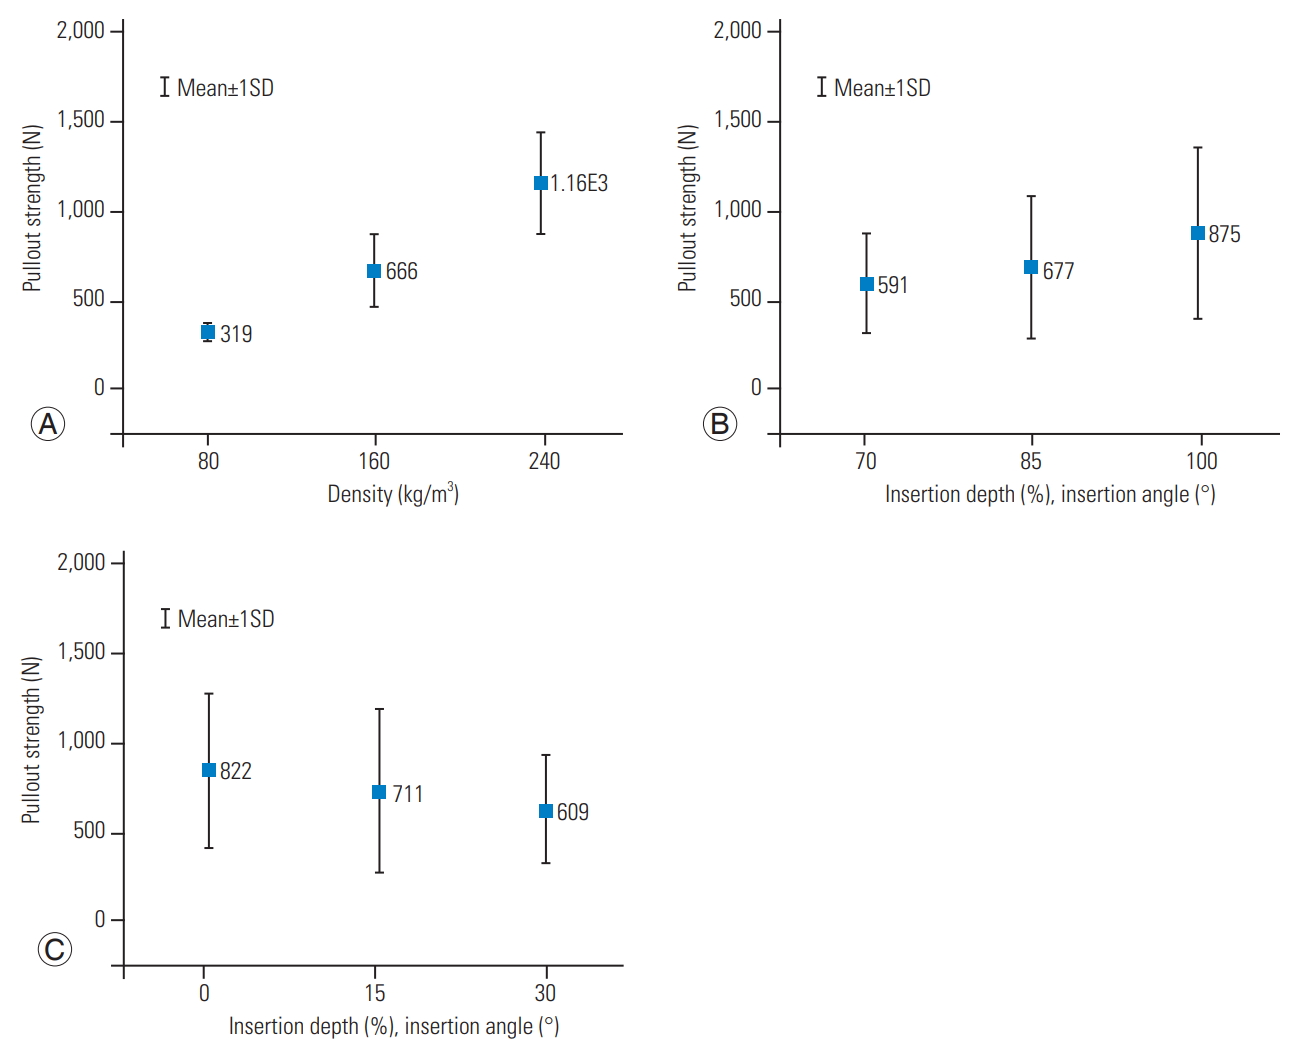
Effect of factors on pullout strength of pedicle screw. (A) Density, (B) insertion depth, and (C) insertion angle. To plot the factor effect, the factor under observation was kept at a constant level while varying the other two factors, according to the experimental design. The spread of data is represented as the mean and standard deviation in the plot. SD, standard deviation.
2. Meta-modeling
The random forest regression model performed best in model fitting, as the value of the correlation coefficient between the predicted and experimental value was high, and values of the error matrix were low. The correlation coefficient was 0.99; whereas, for linear regression modeling it was 0.94. Based on the values of the error matrix presented in Table 3, the random forest model performed better than the linear regression model, and better than the other meta-models like additive regression and RBF regressors. Hence, the random forest model was used for the creation of the decision tree and analysis.

Performance matrix of models used to develop pullout-strength predictor
3. Confirmation experiment
Confirmation experiments were carried out to verify the performance of the pullout predictor. Additional pullout-strength tests were carried out for eight different combinations of factors (density, insertion depth, and insertion angle), and the results of experimental values were compared with the predicted values. Table 4 shows the additional confirmation experiments which were used for testing the pullout-strength predictor. The normalized value was obtained by dividing the experimental value by the predicted value. A value of 1 indicated that the predicted values matched the experimental results. Most of the values were close to 1, indicating that the model was well matched to the experimental values. Based on the confirmation experiment, the mean and standard deviation of the normalized prediction using the random forest meta-model was 1.01±0.04.
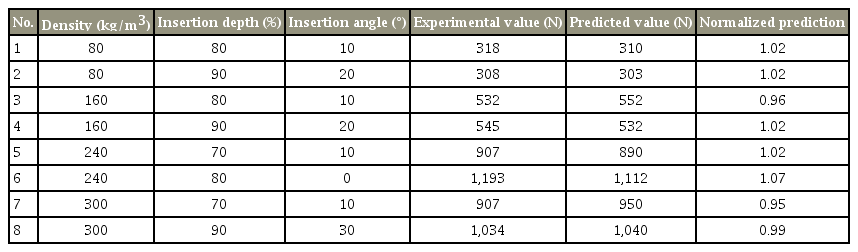
Prediction results based on confirmation experiment
4. Classifier modeling
Table 5 shows the performance matrix of the various classifiers used for building the decision tree. The random forest model performed the best, as seen from area under the ROC and kappa value of 1. Decision stump performed the worst among the classifiers, with a kappa value of 0.70 and area under the ROC value of 0.85.

Performance matrix of models used to develop decision tree for pedicle-screw instrumentation
Hence, the decision tree was built based on the random forest regression model. Fig. 6 represents the decision tree that was built using this classifier for a pullout-failure value of 650 N. This was based on the 40th percentile value of pullout strength, which was obtained in the osteoporotic bone model in the current set of experiments. A case study has been presented in the discussion section for a better understanding of how to use the decision tree in a clinical scenario.

Decision tree for success and failure of fusion construct based on the pullout strength.
Discussion
Despite published reports about the potential benefits of machine-learning approaches for developing decision-support systems, there is a shortage of research that empirically examines the use of these meta-modeling techniques in pre-surgical planning. Clinical decision-making is an important, yet complicated, process which needs to be accurate and efficient, and automation of this system would be extremely advantageous. It is difficult to identify prior to surgery whether a patient undergoing lumbar spine-fusion surgery, especially osteoporotic patients, will have a successful outcome. Undoubtedly, there is a need to develop a patient-specific model that can be used by a surgeon for pre-surgical planning.
The methodology for creating and using a decision-support system for pedicle-screw instrumentation is depicted in Fig. 7A and B. This model sets the framework to create a website or other mobile (i.e., tablet) application for calculating the pullout strength in real time. In the current study, the prediction of pullout strength is based on the important factors of density, insertion depth, and insertion angle. The values for bone density are obtained from quantitative computed tomography (qCT) and dual-energy X-ray absorptiometry (DEXA scan). Insertion angle and depth can be obtained using computed tomography (CT) or magnetic resonance imaging (MRI) scans of the patient. Once a surgeon gets the predicted value, it can be verified that it is within the acceptable range. If it is not, a surgeon can vary the factors and see which combination will provide the optimum pullout strength. The resulting decision-support can be integrated with computer-aided surgery, by incorporating the data from medical imaging technologies such as X-ray, CT, or MRI.

(A) Flowchart for decision-support system and (B) alternate techniques to increase pullout strength. DEXA, dual-energy X-ray absorptiometry; qCT, quantitative computed tomography; MRI, magnetic resonance imaging.
Here, we describe a case study to explain the process of patient-specific surgical planning. To arrive at a benchmark value for pullout strength, the patient database of fusion surgery is reviewed and classified as a successful or failed surgery based on the post-operative follow-up data. By analyzing the data in terms of bone density, insertion angle, and insertion depth, an area of failure and success can be determined. A pullout-strength value corresponding to the success and failure area can then be defined to provide the corresponding benchmark value.
In the clinical scenario, the pedicle angle and chord length are measured using CT and MRI scans as shown in Fig. 3D, and DEXA scan can be used for measuring bone mineral density (BMD). Consider patient P1 with a T-score >−1 and BMD of 180 kg/m3. The patient is scheduled for fusion surgery at level L4–L5 with a pedicle chord length of 42 mm and mediolateral angle of 30°. The predicted pullout strength is 898 N, which is above the threshold for successful fusion (650 N). The surgeon can follow the algorithm, which predicts that the fusion will be successful. Consider patient P2 with a T-score <−2.5 and BMD of 130 kg/m3. P2 is scheduled for fusion surgery at level L1–L2 with a pedicle chord length of 35 mm and mediolateral angle of 10°. The predicted pullout strength is 530 N, which is below the threshold for successful fusion surgery (650 N). To plan the surgery, a surgeon chooses an alternate insertion path in such a way that the insertion angle will be below 7.5°, and a screw length more than 35 mm can be used. Conventionally, a cement augmentation or higher level of fusion would have been recommended based on the experience of the surgeon. The current decision-support system helps to provide quantitative insight toward a qualitative phenomenon of success or failure of fusion surgery.
In the current study, the pullout-strength value for successful fusion is assumed to be 650 N based on the 40th percentile value of the pullout-strength value which is obtained in the osteoporotic bone model in the experiments. Better values can be determined by using cadaver samples, which will closely resemble the in vivo condition. For clinical scenarios, additional data such as pedicle width, height, cortical thickness, and screw thread parameters can be incorporated during the model building stage. Based on published studies and experience, it is recognized that there is no single meta-model that will work best for all datasets, although given a particular problem, some methods can significantly outperform others [19]. Similar studies can be carried out using other meta-models to develop better predictors. Meta-models such as random forest regression can perform well in cases of mixed variable types and co-linearity of data. In clinical practice, black box predictions are the least desirable. A random forest model helps to better understand the phenomenon of model building. In the current study, a simpler model is developed based on three variables to employ it readily in a clinical situation. Based on the validity and acceptance of the methodology, complex models can be built based on the given framework. DEXA and qCT are not routinely used for younger patients due to radiation risk; hence, better non-ionizing imaging modalities need to be developed that will extract the geometric details of the bone and material properties.
One main limitation of the current study is that the experiments use foam models to mimic extremely osteoporotic to normal bone. Implementing a similar experiment with a cadaver model will require a large sample size to obtain a statistically significant conclusion. A correction factor can be introduced into the model to compensate for the non-homogeneous property of bone. Simple axial loading is applied to represent the initial period after spine-fusion surgery. It is difficult to mimic the complex loading of the in vitro condition. For future studies, cyclic loading can be applied during the pre-processing stage before applying the axial load [30]. Physiologically, this type of loading causes bone remodeling around the screw; however, this phenomenon is difficult to mimic in foam and cadaver models. The current model is applicable for the same screw type with thread geometry as described in the methodology section. Extrapolation to other screw types should be done with caution. Verification, validation, and sensitivity analysis provide considerable confidence that these limitations in the model of the pullout-strength predictor have been adequately addressed. In the current study, it is difficult to explore the interaction effect between the different factors computationally, as it requires larger sample size and variables. Although this is a limitation, we feel this model provides the initial ground work into the area of advanced predictive modeling in instrumented spine-fusion surgery outcomes. The model can still be used clinically, and as more data is collected, the model can be continuously updated.
Conclusions
A predictive model was built using machine-learning techniques of meta-modeling and experimental pullout-strength values. This model can be used for patient-specific surgical planning, and it can act as a decision-support system to assist spine surgeons performing fusion surgery.
Notes
No potential conflict of interest relevant to this article was reported.