Sacropelvic Parameters and L5 Spondylolysis: Computed Tomography Analysis
Article information

Abstract
Study Design
Retrospective analysis of computed tomography scans.
Purpose
This study aims to determine the association of sagittal sacropelvic parameters with L5 spondylolysis.
Overview of Literature
The association of increased pelvic incidence (PI) and decreased sacral table angle (STA) with spondylolysis has been reported, but no study has simultaneously analyzed multiple sacropelvic variables to compare their association.
Methods
In this study, computed tomography scans obtained to assess major trauma in patients aged >16 years were analyzed. Scans meeting one of the following criteria were excluded: abnormal anatomy, previous spine or hip/pelvis surgery, or spinal pathology, including deformity, infection, tumor, or trauma. sacral anatomic orientation (SAO), PI, pelvic thickness (PTH), femoro-sacral posterior angle (FSPA), STA, and sacral kyphosis (SK) were measured.
Results
Overall, 202 scans were analyzed: 25 with L5 spondylolysis and 177 normal. Among the groups, a significant difference was observed in SAO (43.3° vs. 51.6°), PI (61.7° vs. 49.8°), STA (95.4° vs. 101.8°), and SK (31.0° vs. 23.7°). Based on the logistic regression analysis, only PI (odds ratio [OR], 1.074; 95% CI, 1.026–1.124) and STA (OR, 0.822; 95% CI, 0.734–0.920) remained significant predictors for the presence of spondylolysis. In the spondylolysis group, PI correlated significantly with PTH (r=−0.589), FSPA (r=0.880), and SK (r=0.576), whereas in the normal group, PI correlated significantly with FSPA (r=0.781) and SK (r=0.728).
Conclusions
By simultaneously assessing multiple sacropelvic parameters, we associated increasing PI with L5 spondylolysis. Decreasing STA, which likely represents a chronic remodeling secondary to spondylolysis, was also associated with increased risk. Back pain in an adolescent or young adult with high PI or low STA should raise suspicion of a possible occult spondylolysis.
Introduction
Spondylolysis generally refers to a fatigue or stress fracture in the pars interarticularis [1]. Symptomatic spondylolysis may present acutely. However, many spondylolysis cases present as an incidental finding as part of a diagnostic work-up for other conditions and are unrelated to back symptoms [2]. Prevalence studies, most using advanced imaging modalities assessing non-spinal pathology, have shown that spondylolysis is present in up to 8% of the population [3–5].
Spondylolysis etiology remains an area of interest for aiding in diagnosis and treatment. Sacropelvic morphology variations seem to play a role in predisposing individuals to an increased risk of developing spondylolysis through increased biomechanical stress [6,7]. Analyses of sacropelvic parameters between individuals with and without spondylolysis have shown the sacrum’s morphometry and its relationship with the pelvis can vary considerably [7–13].
Although various sacropelvic parameters have been studied for their association with the development or presence of spondylolysis, few studies have considered multiple parameters simultaneously [6–11,14]. Moreover, the main determinants of or risk factors for spondylolysis concerning sacropelvic morphometry need to be identified. A better understanding of the interplay between the sacropelvic parameters and the development of spondylolysis may help identify “at-risk” individuals.
This study analyzes the differences in the sagittal sacropelvic measures between patients with and without L5 spondylolysis. We will determine which of the sacropelvic variables, if any, are significant predictors of spondylolysis.
Materials and Methods
Ethical approval was provided by the Health and Disability Ethics Committee (HDEC: 18/CEN/8). Due to the retrospective nature of this study patient consent was not required.
Computed tomography (CT) scans obtained over 3 years (2017–2019) to assess major trauma in patients aged >16 years were screened for possible inclusion in this analysis. The scans were studied to ensure the entire spinal column was visualized from the occiput to the hips. Scans meeting one of the following criteria were excluded: an abnormal vertebral body count; the presence of transitional anatomy; spondylolysis at levels other than L5; previous surgery of the spinal column or hips/pelvis (e.g., spinal fusion, hip arthroplasty); evidence of spinal column pathologies such as a tumor, trauma, or infection; hip pathology such as dysplasia that could preclude the measurement of the selected sacropelvic parameters; or any assessment in the spine outpatient clinic.
The scans were grouped into either “spondylolysis” or “normal” cohorts depending on the presence or absence of L5 spondylolysis. Spondylolysis was noted to be uni- or bilateral. Any spondylolisthesis was graded (0–5) in accordance with the Meyerding classification.
Age and sex were recorded for each patient. Sagittal sacropelvic parameters, including sacral anatomic orientation (SAO), pelvic incidence (PI), pelvic thickness (PTH), femoro-sacral posterior angle (FSPA), sacral table angle (STA), and sacral kyphosis (SK), were measured on each using IntelliSpace PACS ver. 4.4 Enterprise (Koninklijke Philips N.V., Amsterdam, Netherlands) [7,15–20]. These sagittal sacropelvic measures have previously been subject to reliability analysis with excellent results [21].
SAO was measured by identifying the anterior superior iliac spine on the respective sagittal images and identifying the midpoint between them on the relevant midsagittal image to create the pelvis’s anterior plane [7]. The SAO was then determined by the angle subtended by a line along the anterior plane and a line along the sacral endplate (Fig. 1) [7].
Sacral anatomic orientation (SAO) is measured by identifying the anterior superior iliac spines (ellipses) on the relevant sagittal images. The midpoint between these is then used on the midsagittal image and the anterior plane defined by a line through the midpoint and touching the anterior aspect of the pubic symphysis; the angel subtended by this line and line drawn along the sacral end plate provides the SAO.
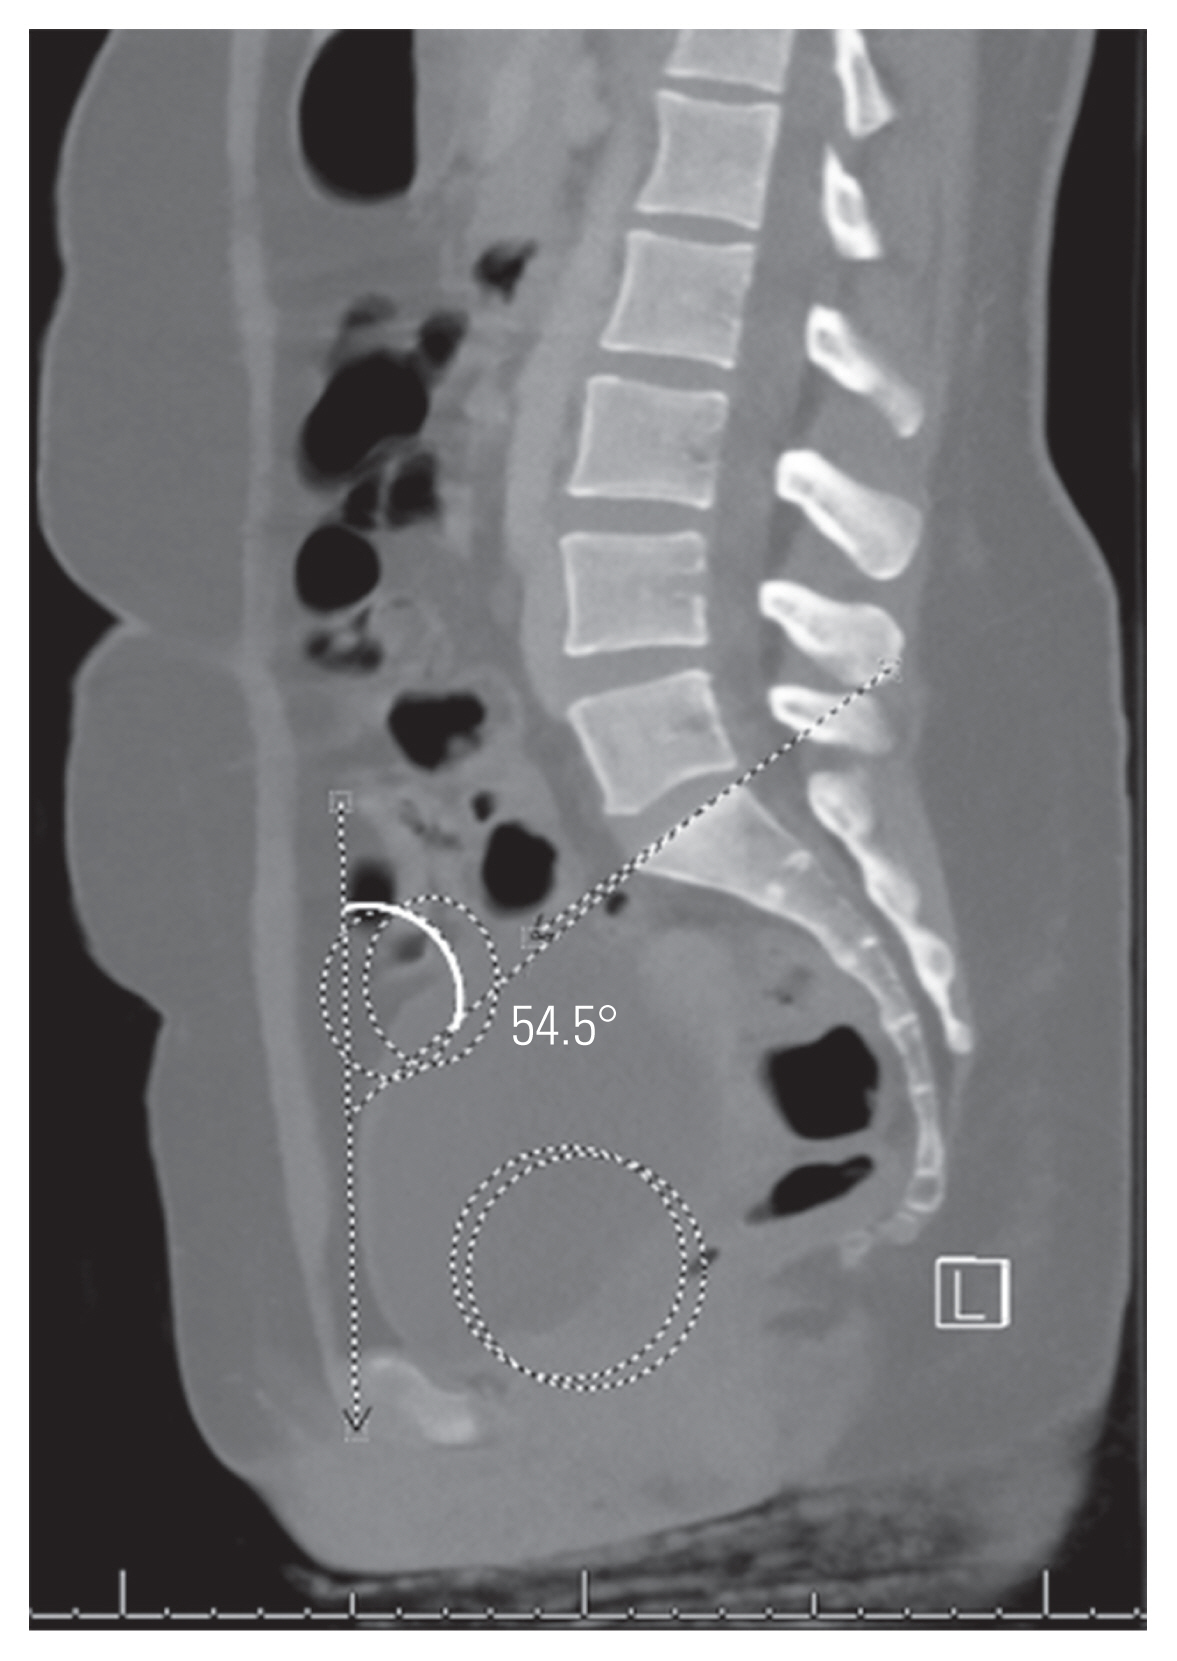
To measure PI, the bicoxofemoral axis was first determined by identifying the center of the femoral head on the respective sagittal images and then identifying the midpoint between these on the relevant midsagittal view. PI was then measured as the angle subtended by a line from the bicoxofemoral axis to the center of the sacral endplate and a line drawn perpendicular to the sacral endplate (Fig. 2) [22]. The PTH, an indicator of the distance within the sacropelvic architecture, was measured in millimeters as the distance from the bicoxofemoral axis to the midpoint of the sacral endplate (Fig. 2) [16].
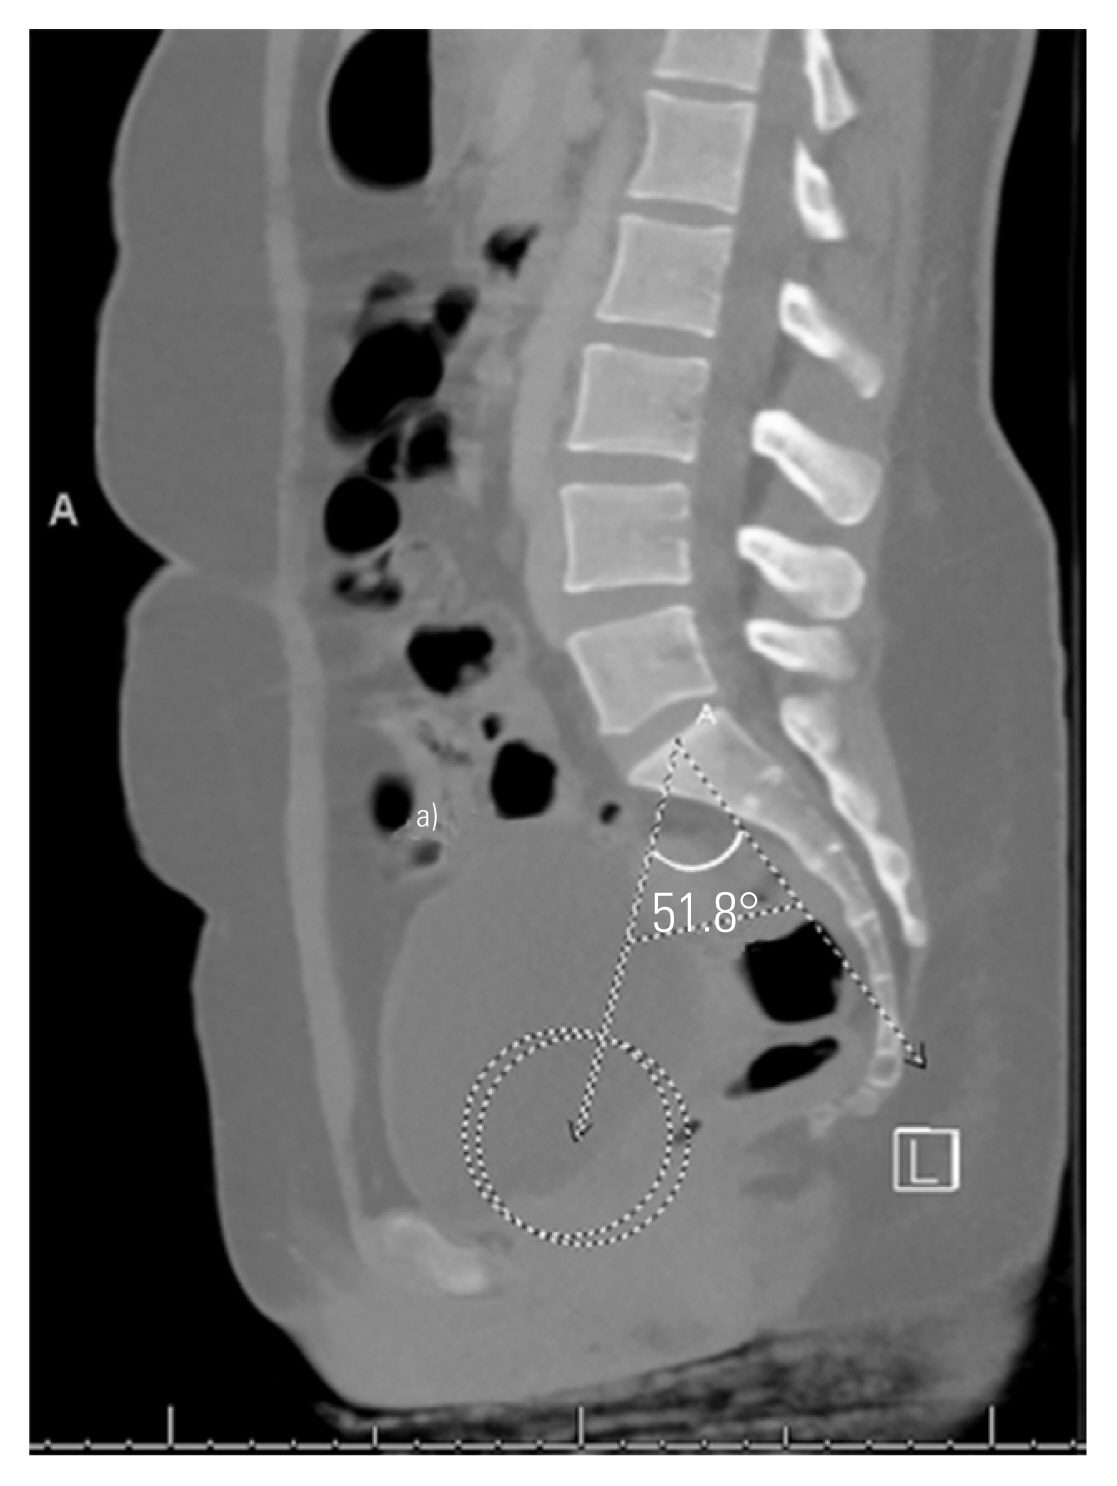
Pelvic incidence (PI) is measured by identifying the center of the femoral heads on the relevant sagittal images (circles) then the midpoint between these identified on the midsagittal image to define the bicoxofemoral axis. PI is the angle then subtended by a line from the bicoxofemoral axis to the middle of the sacral endplate and a line drawn perpendicular through the center of the sacral endplate. The line from the bicoxofemoral axis to the midpoint of the sacral endplate provides the distance of the pelvic thickness (PTH) in millimeters. a)PTH=100.5 mm.
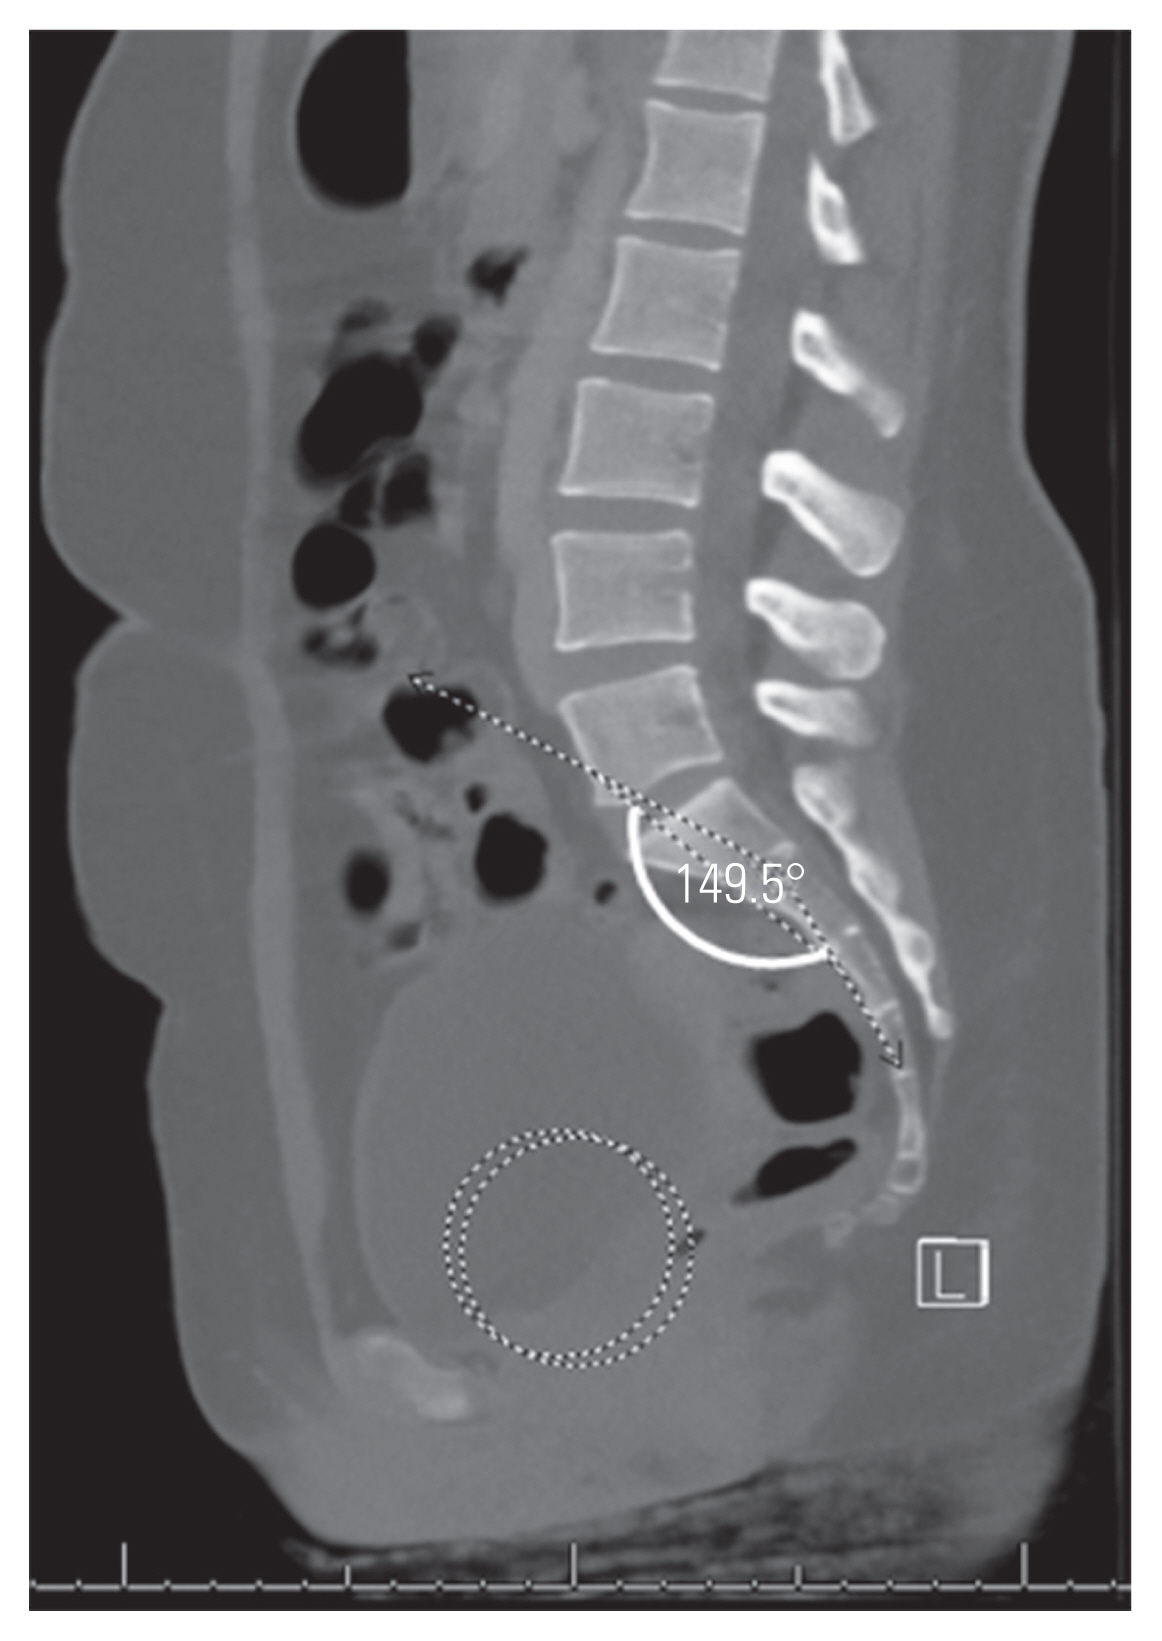
FSPA was measured using a line from the bicoxofemoral axis to the posterosuperior corner of the sacrum and a line drawn along the posterior border of S1 (Fig. 3) [19]. STA was measured as the angle subtended by a line drawn along the sacral endplate and a line along S1 the posterior border (Fig. 4) [21].
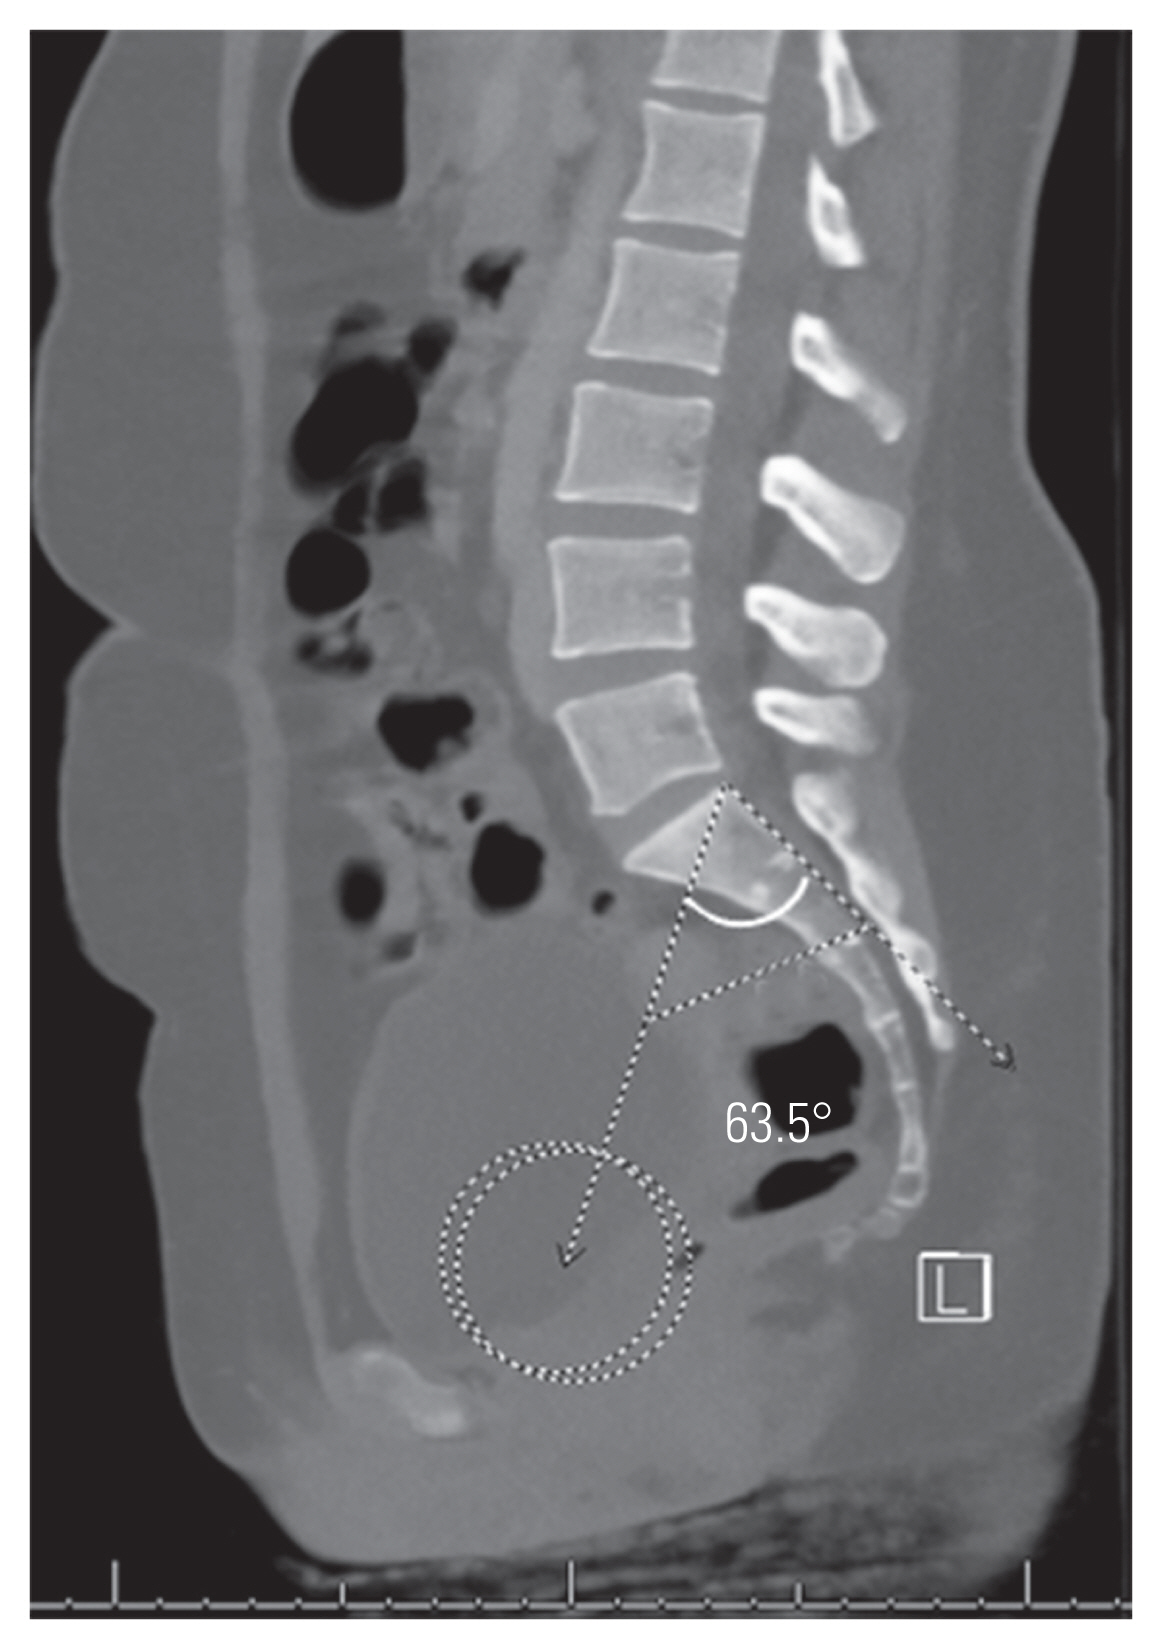
Femoro-sacral posterior angle utilizes the bicoxofemoral axis as described and is defined as the angle subtended by a line from the bicoxofemoral axis to the posterosuperior corner of the sacrum and a line along the posterior border of S1.
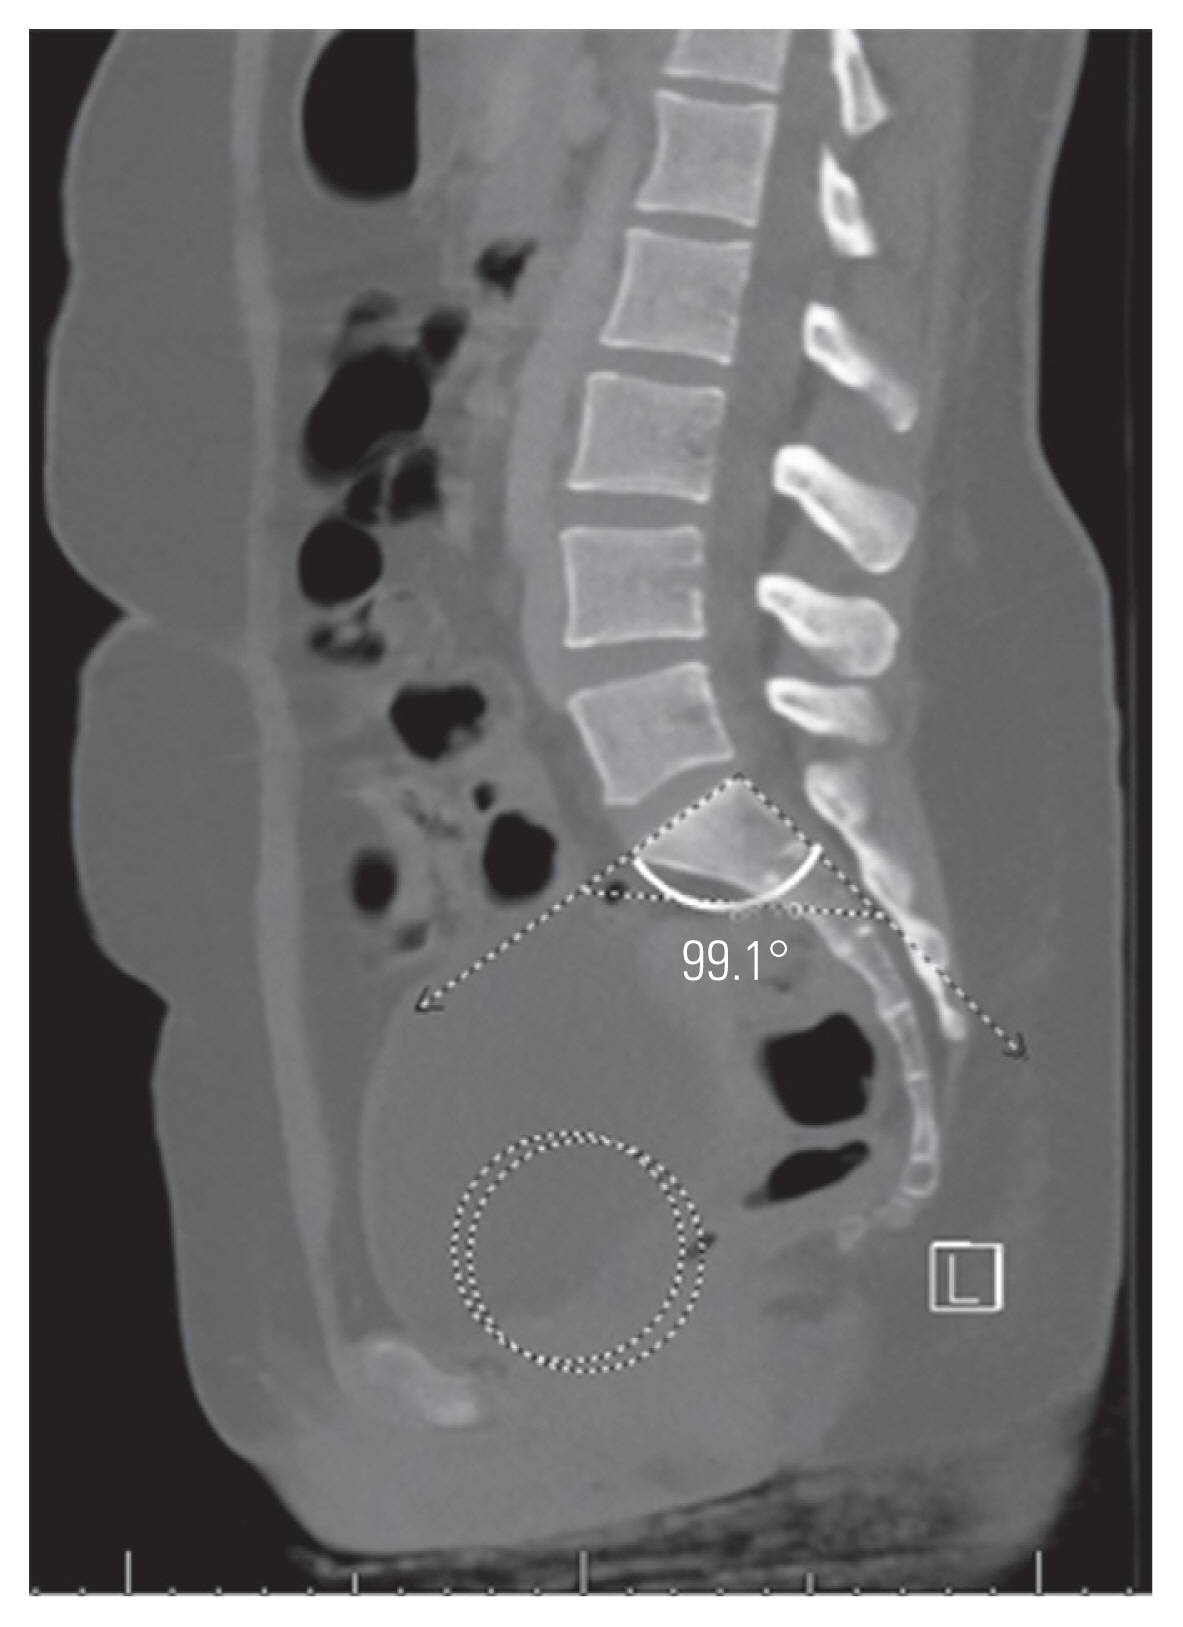
Sacral table angle is measured as the angle subtended by a line along the sacral endplate and a line along the posterior border of S1.
SK was determined by the angle subtended by a line drawn through the center of the sacral endplate and the center of the inferior endplate of S1 and a line drawn through the superior endplate of S2 and the inferior endplate of S4 (Fig. 5) [21]. The measurement obtained was subtracted from 180º to obtain the degree of kyphosis from a neutral position. A positive value indicated kyphosis, whereas a negative value indicated lordosis.
Sacral kyphosis (SK) is measured as the angle subtended by a line drawn through the center of the sacral endplate and the middle of the inferior endplate of S1 and a line drawn through the middle of the superior endplate of S2 and middle of the inferior endplate of S4. The measured value is subtracted from 180º to provide the SK value: positive values indicate SK while a negative sacral lordosis.
All data was collected and stored in Excel 2020 (Microsoft Corp., Redmond, WA, USA). Statistical analysis was performed using ExcelSTAT 2020 (Microsoft Corp.). The groups’ univariate analysis was performed using unpaired Student t-tests, and the proportions were analyzed using two-sample Z-tests. The logistic regression analysis identified significant spondylolysis predictors. Pearson’s correlation analysis was performed to identify significant associations between the variables for each group.
Results
Overall, 202 scans were included: 109 males (62%), with a mean±standard deviation age of 44.4±19.0 years (range, 16–88 years). Twenty-five had spondylolysis; 17 were males (68%), with a mean age of 45.9±21.5 years (range, 17–78 years). Spondylolysis was unilateral in 9 (36%) and bilateral in 16 (64%). Thirteen had no slip, 11 had <25%, and one had 25%–50%. Moreover, no slips were detected in unilateral cases. No age (p=0.707) or sex (p=0.680) difference was observed between the spondylolysis and normal groups.
Table 1 shows the results of the univariate analysis. All sacropelvic parameters, except FSPA and PTH, were significantly different between the two groups. After logistic regression analysis, only PI (odds ratio [OR], 1.074; 95% confidence interval [CI], 1.026–1.124) and STA (OR, 0.822; 95% CI, 0.734–0.920) remained significant predictors for the presence of spondylolysis. The area under the curve for the predicted model was 0.835. Figs. 6 and 7 show the mean values for PI and STA in the spondylolysis and normal cohorts, respectively.

Mean, SD, and range for age and sacropelvic parameters for the normal and spondylolysis cohorts

Mean values shown for pelvic incidence (PI) and sacral table angle (STA) in patients with L5 spondylolysis with measures demonstrated on computed tomography from a patient with spondylolysis (PI solid line; STA dashed line).
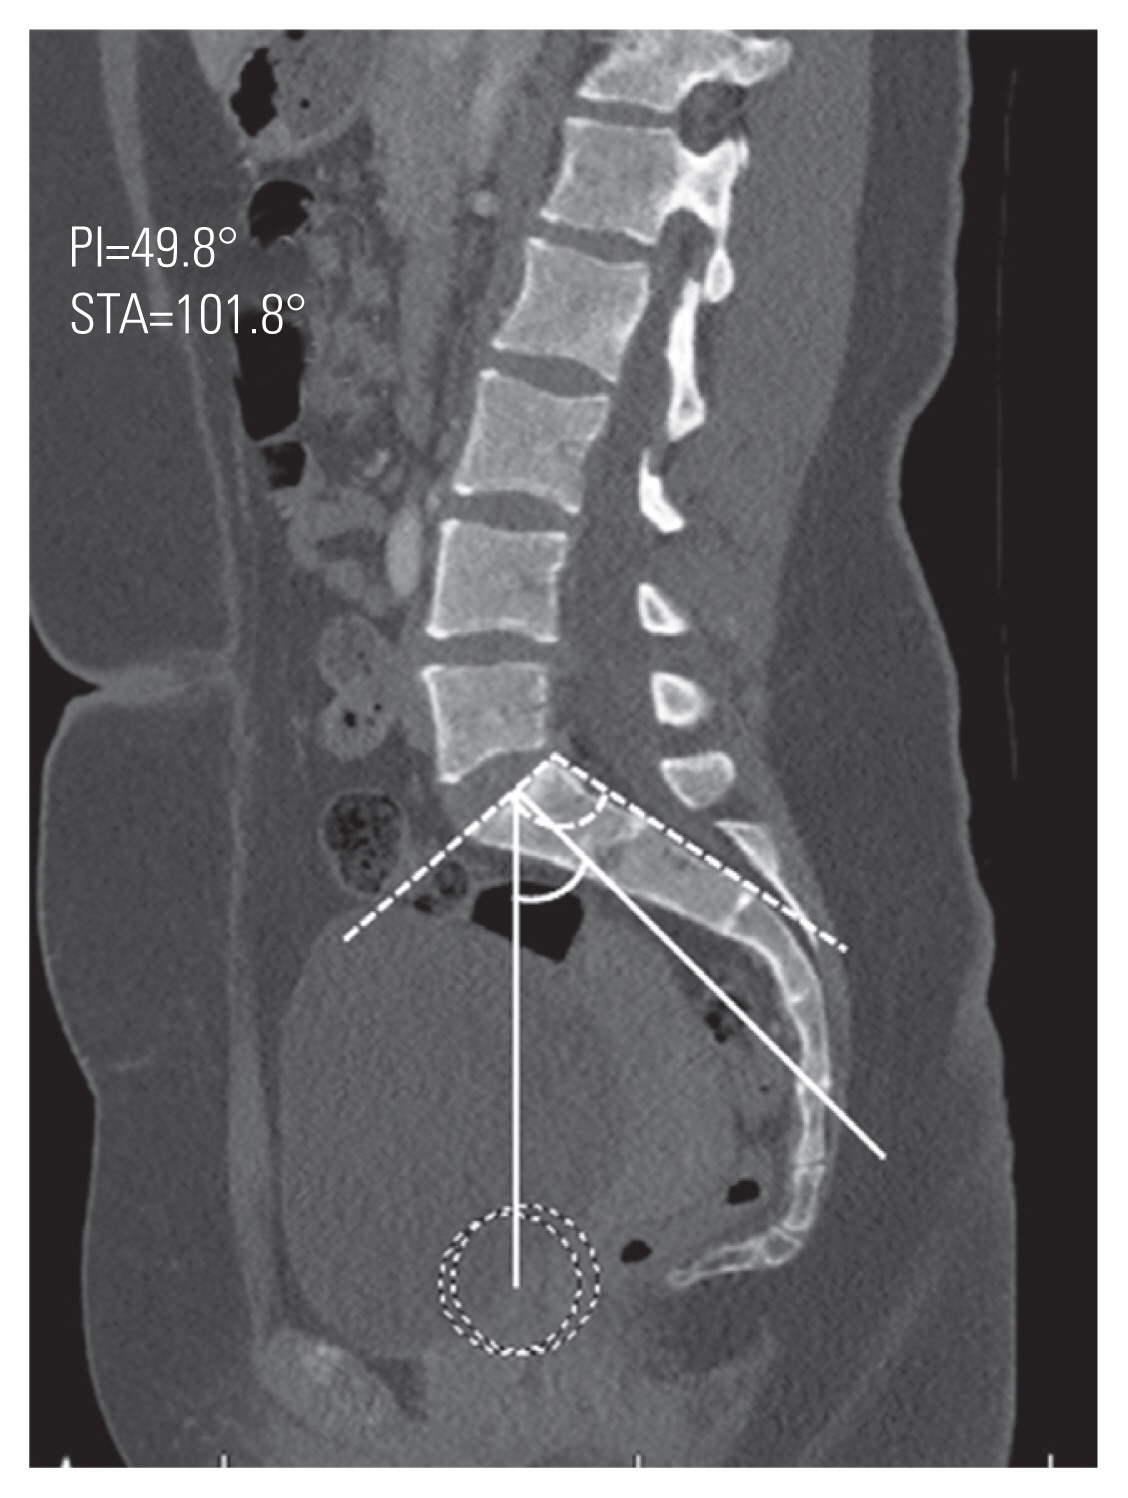
Mean values shown for pelvic incidence (PI) and sacral table angle (STA) in patients without spondylolysis with measures demonstrated on computed tomography from a patient without spondylolysis (PI solid line; STA dashed line).
Tables 2 and 3 show the correlation analysis results between the sacropelvic variables for the spondylolysis and normal groups, respectively. In the spondylolysis group, both PI and SK correlated with three other variables at least to moderate strength. PI correlated with PTH (r=−0.589), FSPA (r=0.880), and SK (r=0.576), whereas SK correlated with SAO (r=−0.640) and FSPA (r=0.670). In the normal group, the results were slightly different: PI correlated with FSPA (r=0.781) and SK (r=0.728) but not PTH (r=−0.364), whereas SK correlated with SAO (r=−0.641) and FSPA (r=0.797).

Results from correlation analysis for the spondylolysis group

Results from correlation analysis for the normal group
Discussion
Spondylolysis is a common presentation, whether a direct contributor to spinal symptoms or detected as an incidental finding while investigating unrelated pathology. In patients with spondylolysis, the sacropelvic parameters differ from the normal population. This study has confirmed the predictive value of increasing PI and decreasing STA for the presence of spondylolysis in a cohort of patients imaged with CT for non-spinal complaints while also considering the potential association of other sacropelvic parameters. When assessing adolescents or young adults with low back pain, either high PI or low STA should prompt advanced imaging to identify occult spondylolysis.
Increasing PI has previously been associated with the presence of isthmic spondylolisthesis. In a radiographic study of 65 patients with isthmic spondylolisthesis and 30 without isthmic spondylolisthesis, Oh et al. [14] showed those with spondylolisthesis had a higher PI (62° versus 49°). Furthermore, a positive correlation was observed between the PI and the percentage slip. Similarly, in the radiographic studies by Labelle et al. [12], Belfi et al. [3], and Wang et al. [23], PI was significantly greater in those with spondylolisthesis and the increase in PI correlated with percentage slip. The strength of the present study is the simultaneous analysis of multiple sacropelvic parameters, after which logistic regression demonstrated the significance of increasing PI over other parameters.
STA also remained significant after logistic regression analysis. A number of previous studies have analyzed the association of STA with spondylolysis [9,11,23]. Tallarico et al. [10] studied early-onset spondylolysis in six patients and compared it to a normal control group of 50 patients, which indicated that the variation in STA is a result of remodeling rather than a causative factor. Sugawara et al. [9] studied advanced imaging in the form of CT and magnetic resonance imaging and similarly concluded that STA is only low in the “terminal stages” of spondylolysis and a result of remodeling. Therefore, the change in STA in the presence of spondylolysis supports the findings of Whitesides et al. [11], in which STA is more closely associated with the presence of spondylolysis than PI. In the present study, decreasing STA remained a significant predictor of spondylolysis based on the logistic regression analysis results. However, this is not necessarily a confirmation of causality—a weak negative correlation with age supports the conclusions of Tallarico et al. [10] and Sugawara et al. [9]. Sugawara et al. [9] have also considered the relationship between segmental “hyperlordosis” and spondylolysis. They have shown in cohorts of patients with L4 spondylolysis (n=15) and L5 spondylolysis (n=41) that the affected vertebrae’s segmental lordosis and adjacent discs were significantly greater than the unaffected adjacent vertebrae and discs. However, the study had no longer-term follow-up, so anything beyond an association is unclear [24]. The analysis of a skeletally immature cohort over time would define the evolution of the STA or indeed a change in segmental lordosis about the presence of spondylolysis. However, it raises an ethical issue since many advanced imaging modalities pose some risk to the individual.
While the present study associated increased PI and decreased STA with the presence of L5 spondylolysis, its relation to symptomatology was not confirmed. Sai Krishna et al. [25] studied a cohort of 79 patients with spondylolisthesis and 75 without spondylolisthesis. PI was significantly greater (65° versus 48°) in those with spondylolisthesis. Fifty-four patients with spondylolisthesis were followed for 6 months—no recorded parameter, PI included, was associated with the risk of developing symptoms. So, although high PI is a risk for the presence of spondylolysis, the authors concluded that increased PI does not necessarily indicate an increased risk of developing symptoms [25]. Kim et al. [26] noted, in a review of 70 young adults with L5 spondylolysis, associated symptom development with body mass index and the presence of disc and facet joint degeneration. Although not statistically significant, PI was greater in the group that developed symptoms (51° versus 45°, p=0.096)—failure to achieve statistical significance may be related to the study power. Therefore, the various sacropelvic parameters’ predictive utility remains a potential area of exploration—a longitudinal clinical or functional assessment of young patients with known sacropelvic parameters may be an acceptable strategy.
Peleg et al. [7] demonstrated a lower SAO in patients with spondylolysis. Their initial study comprised 99 adult males with spondylolysis and 125 without spondylolysis; the mean SAO was 44.1° and 51.1°, respectively [7]. The mean values in the present study are not different, validating the use of CT. While the difference in SAO was statistically significant based on the univariate analysis, this did not remain after multivariate analysis, so it appears to be a lesser determinant. Since both SAO and PI were at least moderately correlated with SK, in both spondylolysis and normal groups, the difference in the association with spondylolysis may lie in the variation in the sacroiliac articulation, which is not assessed in this study and requires more complex modeling [27,28].
Among the two groups, SK correlated similarly with the other parameters, most notably FSPA and SAO. However, PI varied in correlation with the other parameters—a stronger correlation was observed with PTH and SK in the spondylolysis group than in the normal group. This indicates that the sacral endplate’s distance from the bicoxofemoral axis, the sacroiliac articulation, and the morphometry of the sacrum are important PI determinants and are indirectly related to the presence of spondylolysis [21]. This an area of interest that should be further explored.
FSPA was developed for use in patients with a deformed sacral endplate where the identification of the anterior, center, or posterior margin is prone to significant interobserver error [19]. FSPA is perhaps easier to measure on a normal individual with the sacral measure utilizing the sacrum’s posterior border rather than utilizing a line perpendicular to the sacral endplate. There was no association between FSPA and the presence or absence of spondylolysis, although STA was the sum of the FSPA and the sacropelvic angle (PRS1) [18]. PRS1 reflects the contribution of the sacrum’s anterosuperior portion where potentially remodeling effects are greater resulting in this finding. However, this lack of association between FSPA and spondylolysis does not detract from its utility as a proxy measure when measuring the PI is impossible in patients with a deformed sacral endplate.
This study has several limitations. Only supine imaging was assessed, so dynamic or positional parameters such as sacral slope, pelvic tilt, or lumbar lordosis have not been simultaneously assessed, which would have added value. However, obtaining erect spinal radiographs in a large number of individuals is really only feasible in those with spinal complaints. To obtain such imaging in an asymptomatic population requires additional radiation exposure, which is difficult to justify. CT obtained for the assessment of blunt or major trauma has been used previously to analyze sacropelvic measures. It is reassuring that this report’s findings are similar to those reported elsewhere, providing this technique’s validity [7,21,29]. Moreover, it was not determined whether a patient had spinal symptoms or symptoms attributable to spondylolysis. We acknowledge that a longitudinal study would better understand whether any of the sacropelvic parameters carry prognostic utility through monitoring and assessing for the development of symptoms.
Conclusions
In conclusion, this retrospective analysis of sacropelvic parameters and their association with spondylolysis on CT demonstrated a persistent relationship between increasing PI and decreasing STA and the presence of spondylolysis. No association was observed between the other measured sacropelvic parameters and the presence of L5 spondylolysis. Back pain in an adolescent or young adult with high PI or low STA should for now, raise suspicion of a possible occult spondylolysis and advanced imaging. Future work should also focus on determining whether these findings represent compensatory changes or carry a prognostic value and predispose an individual to develop spondylolysis.
Notes
No potential conflict of interest relevant to this article was reported.