Radiological Study of Atlas Arch Defects with Meta-Analysis and a Proposed New Classification
Article information

Abstract
This study consists of a retrospective cohort study, a systematic review, and a meta-analysis which were separately conducted. This study aimed to investigate the prevalence of atlas arch defects, generate an evidence-based synthesis, and propose a common classification system for the anterior and combined atlas arch defects. Atlas arch defects are well-corticated gaps in the anterior or posterior arch of the atlas. When both arches are involved, it is known as a combined arch defect. Awareness of these defects is essential for avoiding complications during surgical procedures on the upper spine. The prevalence of arch defects was investigated in an open-access OPC-Radiomics (Radiomic Biomarkers in Oropharyngeal Carcinoma) dataset comprising 606 head and neck computed tomography scans from oropharyngeal cancer patients. A systematic review and meta-analysis were performed to generate prevalence estimates of atlas arch defects and propose a classification system for the anterior and combined atlas arch defects. The posterior arch defect was found in 20 patients (3.3%) out of the 606 patients investigated. The anterior arch defect was not observed in any patient, while a combined arch defect was observed in one patient (0.2%). A meta-analysis of 13,539 participants from 14 studies, including the present study, yielded a pooled-posterior arch defect prevalence of 2.07% (95% confidence interval [CI], 1.22%–2.92%). The prevalences of anterior and combined arch defects were 0.00% (95% CI, 0.00%–0.10%) and 0.14% (95% CI, 0.04%–0.25%), respectively. The anterior and combined arch defects were classified into five subtypes based on their morphology and frequency. The present study showed that atlas arch defects were present in approximately 2% of the general population. For future studies, larger sample sizes should be used for studying arch defects to avoid the small-study effect and to predict the prevalence accurately.
Introduction
Congenital arch defects of the atlas (C1) are found incidentally. They have been seen as well-corticated gaps in the arch of the atlas and are classified into two types, posterior (PAD) and anterior (AAD) arch defects. In fewer cases, the defect can be regarded as a combined arch defect (CAD), also known as a bipartite atlas [1–3] or split atlas [4,5], when PAD and AAD present together. Most arch defects are asymptomatic and are found incidentally. However, they can lead to atlantoaxial joint instability, associated with an increased risk of craniovertebral and/or cervical injuries [6]. They can also be confused with atlas fractures, resulting in misdiagnosis [7,8]. Therefore, awareness of these defects is clinically relevant for avoiding complications while performing surgical procedures on the upper spine.
The PAD is a well-recognized type of atlas arch defect with a prevalence ranging from 0.2% to 5.2% across studies. Currarino et al. [9] classified the PAD into five types according to its morphology. The anatomy and subtype-based prevalence of PAD has been investigated by many authors [9–12]. However, no meta-analysis has been conducted to study its pooled prevalence and its subtypes. Although PAD is well-studied, AAD and CAD have received lesser attention [13]. Descriptions are mostly restricted to case reports and very few anatomical studies have investigated their prevalence [11,14–16]. Therefore, further research is needed to predict the prevalence of these defects more accurately, and a classification of the AAD and CAD systems is yet to be proposed.
The present study had two objectives. First, to investigate the prevalence of arch defects in the atlas from an open-access computed tomography (CT) dataset. Second, to generate pooled prevalence estimates of atlas arch defects and propose a classification system for AAD and CAD using systematic review and meta-analysis.
Materials and Methods
1. Imaging datasets, image analysis, and three-dimensional reconstruction
The CT images used in the present study were taken from the “Radiomic Biomarkers in Oropharyngeal Carcinoma (OPC-Radiomics)” [17]. The dataset was open-access and was downloaded from the Cancer Imaging Archive website (https://www.cancerimagingarchive.net/). This dataset contains unenhanced head and neck CTs from 606 (79.4% male and 20.6% female patients) human papillomavirus-related oropharyngeal cancer patients at Princess Margaret Cancer Center, Toronto, Canada. The average age of patients was 60.5±9.9 years (range, 33–89 years). All images were in “Digital Imaging and Communications in Medicine” format with 512×512 pixels resolution and a slice thickness between 2.0 mm and 2.5 mm. The patient’s sex and age were known. However, other patient-specific information was blinded.
The prevalence of AAD and PAD were investigated (Fig. 1, Supplement 1). The CT scan of each patient was carefully inspected on sagittal, coronal, and axial views. The PAD was classified according to the classification system proposed by Currarino et al. [9] including the failure of posterior midline fusion (type A), unilateral clefts (type B), bilateral clefts (type C), absence of the posterior arch with the presence of the posterior tubercle (type D), and absence of the posterior arch and the posterior tubercle (type E). Two authors with Doctor of Philosophy in anatomy made the observations. Any disagreement between the two observers was resolved by an expert radiologist. For some variations, additional three-dimensional (3D) reconstruction was performed as described previously and the results were exported as STL files and uploaded to Figshare (https://doi.org/10.6084/m9.figshare.c.6758133). Links to the models are available in Supplement 1.

Computed tomography images showing the midline posterior arch defect (A), sided posterior arch defect (C), bilateral posterior arch defects associated with anterior arch defect (E), and their three-dimensional (3D) reconstructions (B, D, and F). Red and blue arrowheads indicate the anterior arch defect and posterior arch defect, respectively. Interactive 3D files are available on Figshare (https://doi.org/10.6084/m9.figshare.c.6758133) (Supplement 1).
2. Systematic review and risk of bias assessment
The present study accorded with the Methods of Evidence-based Anatomy, Checklist for Anatomical Reviews and Meta-analysis guidelines [18], and Critical Appraisal Tool for Anatomical Meta-analysis [19]. This study was registered on PROSPERO (CRD42022347520).
The protocol for the systematic review is summarized in Fig. 2. The literature was searched systematically in four databases: Google Scholar, PubMed, Scopus, and Journal Storage (JSTOR). Google Scholar was chosen as the primary database because it yielded the most entries; furthermore, it could also locate studies in the gray literature [20]. For Google Scholar, the following keywords were used: “atlas” AND “arch defect” OR (“split atlas” OR “bipartite atlas”). For PubMed, the search keywords were: “atlas” AND “defect.” For Scopus and JSTOR, the keywords were: “atlas” AND “defect” AND “prevalence” AND “arch.” The search results were limited to research articles on Scopus. Two observers performed the systematic review independently. The reference lists of the relevant articles were checked for more potentially relevant studies. Studies reporting the prevalence of AAD or PAD in humans were included. Case reports on the AAD and CAD were also included to help establish a new classification system. The extracted data included the number of patients diagnosed with AAD, PAD, and CAD along with their subtypes, diagnostic tools (radiography, CT, dried skulls, and excavation), and geographical regions (Asia, Europe, North America, and South America).

Preferred Reporting Items for Systematic Reviews and Meta-Analysis diagram showing identification of studies, inclusion, and exclusion.
The methodological quality of the included articles was evaluated using the anatomical quality assessment (AQUA) tool [21]. Each study was qualitatively assessed on the following five domains: objectives and patient characteristics (domain 1), study design (domain 2), methodology characterization (domain 3), descriptive anatomy (domain 4), and reporting of results (domain 5). If more than two questions from each domain were answered with a “yes,” then that domain was considered “high risk.” Two authors (L.Y. and A.S.) judged each study independently. Any disagreement was discussed until a consensus was reached.
3. Meta-analysis and statistics
The primary outcome was the overall prevalence of the AAD, PAD, and CAD and their subtypes. The secondary outcomes were subtype-specific prevalence, diagnostic tool-based prevalence, and region-based prevalence. The prevalence of AAD and PAD and their subtypes from the present study were also included in the meta-analysis.
The Simonian-Laird random-effects model of the meta-analysis was applied. I2 statistics were used to measure the between-study heterogeneity. A funnel plot of prevalence and the sample size was used to portray publication bias and the small-study effect visually [22]. Additionally, Begg’s test was used to mathematically assess the asymmetry. A Z-test for two proportions was used to assess the differences between the two groups. Stata ver. 17.0 (Stata Corp., College Station, TX, USA) was used for all calculations, and statistical significance was established at p=0.05 (two-tailed).
4. Ethics, registration, data sharing plan, funding, and potential conflicts of interest
The present study did not meet the criteria for ethical approval according to the self-assessment form issued by the Mahidol University Central Institutional Review Board (MU-CIRB). Data sharing will be available upon reasonable request to the corresponding author. This research did not receive any specific grant from funding agencies in the public, commercial, or not-for-profit sectors. Furthermore, the authors declare no conflicts of interest in this manuscript.
Results
1. Prevalence of the arch defects
The prevalences of the AAD and PAD from 606 patients in the head-neck-positron emission tomography-CT dataset are presented in Table 1. The AAD was not found in any participant. The PAD was present in 20 participants (3.3%), 15 male (2.6%), and four female (0.7%) patients (Fig. 1). Type A was the predominant type of PAD, present in 19 out of 20 patients. In 17 of the 19 cases of type A PAD, the defect occurred at the midline. In the remaining two cases, the defect was present on the right side of the posterior arch. Type B was present in one male patient (0.2%) (Fig. 1). Types C, D, and E were not present in any patient. Combined AAD and PAD were present in one male patient (0.2%). In this patient, the AAD was present on the right side of the anterior arch while the PAD was bilateral. The differences between male and female patients were not statistically significant for any arch defect or subtype (Table 1). The 3D reconstruction of the findings is available in Supplement 1.

The prevalence of anterior arch defects, and posterior arch defects and their subtypes from the OPC-Radiomics dataset, and sex differences
2. Systematic review
The systematic literature review yielded 2,590 entries: 532 on Google Scholar, 175 on PubMed, 1,307 on Scopus, and 546 on JSTOR (Fig. 2). A total of 809 studies including 297 reviews, 499 books and book chapters, six conference papers, and seven other documents were excluded. Subsequently, the title and abstract of each entry were reviewed, after which 1,161 entries including duplicates were excluded. First-round screening, therefore, yielded 170 potential studies. Full texts or abstracts of these studies were explored in detail. Subsequently, 36 case reports and 117 unrelated studies were excluded. However, the excluded case reports were later re-examined to support a proposed classification of the AAD and CAD. The remaining 17 studies were carefully evaluated, and eight were excluded because they did not meet the inclusion criteria. After tracing the references of the included articles, two additional studies were included. Furthermore, the results of the present study were also included.
In total, 14 studies from 12 publications were eligible for meta-analysis [2,10–16,23–25] (Table 2). The risk assessment results using AQUA are shown in Supplement 2. Methodology characterization was the most problematic domain because 50% of the studies did not specify the expertise of the observers or mention the measures taken to eliminate inter- or intra-observer variability. Since the full text of one study could not be obtained, risk assessment was regarded as “unclear” for all domains [2]. All excluded studies and the reasons for exclusion are listed in the Supplement 3.

Demographic details of studies meeting the inclusion criteria for meta-analysis
3. Meta-analysis
Meta-analysis results for the prevalence of the AAD, PAD, CAD, and their subtypes are shown in Table 3. A total of 12 studies with 13,173 subjects yielded an AAD prevalence of 0.00% (95% confidence interval [CI], 0.00%–0.10%; I2=0.0%). Analysis of 13,539 participants from 14 studies yielded a pooled PAD prevalence of 2.07% (95% CI, 1.22%–2.92%; I2=94.02%) (Fig. 3). Type A was the commonest type of PAD, present in 1.66% (95% CI, 0.99%–2.33%; I2=94.23%). Type B was found in 0.17% (95% CI, 0.06%–0.27%; I2=23.33%), type C in 0.02% (95% CI, 0.00%–0.12%; I2=0.00%), type D in 0.00% (95% CI, 0.00%–0.04%; I2=0.00%), and type E in 0.02% (95% CI, 0.00%–0.12%; I2=0.00%). Type D was present in 0.02% (95% CI, 0.03%–0.06%; I2=0.00%). The pooled CAD prevalence was 0.14% (95% CI, 0.04%–0.25%; I2=28.34%). The PAD was divided into geographical regions and diagnostic tool subgroups (Fig. 3). There were no significant differences among geographical regions (p=0.09) or diagnostic methods (p=0.48). A funnel plot of sample size versus prevalence (Supplement 4) and Begg’s test revealed a significant correlation between sample size and prevalence for PAD types C, D, E, and CAD, indicating the possibility of a small-study effect (Table 3). A common classification system of the AAD and CAD based on 48 previous studies (Table 4, Supplement 5) is proposed and presented in Fig. 4.

Meta-analysis results showing the prevalence of arch defects, between-study heterogeneity and Begg’s test for small-study effect

Forest plot of the prevalence of the posterior arch defect showing region-based and diagnostic tool-based prevalence.
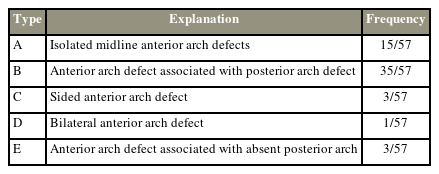
Systematic review results showing the incidences of different types of anterior arch defects from 48 studies and case reports according to our proposed classification

(A–E) A proposed classification system for anterior arch defects and combined arch defects of the atlas based on all forms of anterior arch defect reported in the literature.
4. Proposed classification of the anterior and combined atlas arch defect
A common classification system of the AAD and CAD is also proposed (Fig. 4). This classification is based on 57 cases of AAD and CAD systematically identified in the literature. Unlike the classification of the PAD by Currarino et al. [9], our proposed system was based on the frequency of different forms of AAD. A midline AAD, the commonest form, was classified as type A. Type B, the second most common form, refers to any AAD associated with a PAD. An AAD associated with the absence of the posterior arch was regarded as a subtype of type B. Types C and D were rare and identified as unilateral or bilateral AAD, respectively. Type E refers to any AAD associated with the absence of the posterior arch.
Discussion
The present study investigated the prevalence of arch defects using an open-access dataset, provided an evidence-based synthesis of the AAD, PAD, and CAD, and proposed a common classification system for the AAD and CAD. We encourage future prevalence studies of arch defects to abide by this classification system to ensure accurate descriptions and uniform reporting of arch defect variants.
Radiological studies are generally performed using institutionally provided images. The recent coronavirus disease 2019 pandemic opened a window of opportunities for data-driven research and encouraged the sharing of large imaging datasets in online repositories [26]. Recently, Yurasakpong et al. [27] proposed that these datasets could be repurposed for anatomical research. In this study, we took advantage of the “OPC-Radiomics dataset,” which consists of head and neck CT images from 606 Canadian oropharyngeal carcinoma patients. We found PAD and CAD in 3.3% and 0.2% of these participants, respectively. The prevalence of these defects is like those in previous reports [13,24], PAD being the most frequent atlas anomaly affecting nearly 4% of the whole population. Interactive 3D figures were constructed to illustrate these arch defects in 3D. 3D technology is a promising tool for presenting interactive anatomical findings and offers a potential new standard for future anatomical studies [28].
A meta-analysis was also conducted on 14 original studies, including the present study, to obtain a more accurate prevalence of the atlas arch defects. We found that the PAD was the commonest type of atlas arch defect, present in 2.07% across the populations. It was more prevalent than the AAD and CAD combined. We observed that between-study heterogeneity was remarkably high (I2=94.02%) for PAD. Subgroup analysis by geographical region and diagnostic method was therefore used to investigate the potential causes of this heterogeneity. It is noteworthy that subgroup analyses were only feasible for PAD since anatomical studies of AAD and CAD are rare. It has been speculated that arch defects, PAD in particular, are commoner among Caucasians [9]. However, we found no significant differences among the four continents, namely Africa, Asia, Europe, and North America, suggesting that race is an unlikely determining factor for PAD. The type A PAD variant was the most prevalent (1.66%), followed by type B (0.77%), while the remaining types were extremely rare. Funnel plots were constructed to assess whether the prevalence was mediated by sample size, a phenomenon known as the small-study effect [29]. The funnel plots were statistically asymmetrical for PAD types C, D, and E, suggesting that their prevalences were indeed influenced by the small-study effect. These findings indicate that larger samples should be used to estimate these types of arch defects accurately to avoid the small-study effect, as demonstrated in some recent anatomical meta-analyses [30,31].
Arch defects can be explained developmentally. The developing atlas consists of three primary ossification centers in most individuals; the anterior center forms the anterior tubercle while the two lateral centers give rise to lateral masses and the posterior arch [32,33]. At around 7 weeks, the two lateral centers extend dorsomedially to form the posterior arch. The posterior arches start fusing at birth and complete fusion is achieved at around 5 years of age [32]. Failure of fusion of these two masses could form the PAD. A recent histological study showed that this gap was filled with collagen fibers and fibrocartilaginous tissues [34]. Rarely, a fourth center is present at the posterior midline [33]. According to the classification proposed by Currarino et al. [9], the failure of fusion between this fourth ossification center and the two lateral centers could give rise to types B and C PAD. Various forms of AAD could be attributed to the failure of fusion in some of these ossification centers.
Understanding atlas arch defects is clinically important. The atlas arch defect diagnosis requires a CT or plain radiograph of the flexed and extended neck. Particularly in young children, two posterior hemiarches of the atlas do not fuse and are often present in the radiological examination as a radial lucent line. Differential diagnosis of the atlas arch defect is manageable with clinical awareness of its appearances, such as a Jefferson fracture, which shows similar features to the non-union PAD [35]. Most patients with atlas arch defects are asymptomatic unless a related neuromuscular compartment is affected. The anterior arch of the atlas serves as the attachment of the longus colli muscle and anterior longitudinal ligament, while the posterior arch provides the origin for the rectus capitis posterior minor and ligamentum nuchae. Patients with PAD can encounter various ranges of neurological symptoms, such as neck pain and atlantoaxial instability [36]. Chronic neck pain associated with PAD-neurological conditions includes Klippel-Feil syndrome, myelopathy, spinal stenosis, and Arnold-Chiari malformation [37–39].
There are a few important limitations to the present study. Due to relatively small and unequal sample sizes between male and female patients, statistical analyses should be interpreted with caution. Although Google Scholar is a useful search engine in terms of coverage and identification of studies in the gray literature, repeatability of its search results is impossible [40]. The results of the meta-analysis were based on only 14 studies, or even fewer for some rare types of arch defect. Further studies are needed to accurately predict the prevalence of the defects. Large-scale cohorts are recommended to increase the accuracy of estimates and to avoid the influence of the small-study effect. Genetics as a cause of the arch defects remains to be investigated because the region-based analysis does not necessarily reflect genetic differences among populations. Also, the sex-based prevalence of arch defects was not analyzed because of the limited availability of data.
Conclusions
In conclusion, this study revealed that atlas arch defects were present in approximately 2% of the general population. Based on 48 previous studies, a common classification system for the anterior and CADs was proposed. Large sample sizes should be used for studying these arch defects to predict their prevalence accurately. An awareness of atlas arch defects is essential for diagnosis and avoiding complications during procedures on the upper spine.
Acknowledgments
This study was supported by the Faculty of Science, Mahidol University.
Notes
Conflict of Interest
No potential conflict of interest relevant to this article was reported.
Author Contributions
Worawit Suphamungmee: conception and design, data acquisition, analysis of data, and drafting of the manuscript. Laphatrada Yurasakpong: data acquisition, analysis of data, and critical revision. Kanchanaphan Poonudom: data acquisition and analysis of data. R. Shane Tubbs: analysis of data, critical revision, and supervision. Joe Iwanaga: analysis of data and critical revision. Nutmethee Kruepunga: analysis of data and critical revision. Arada Chaiyamoon: analysis of data and critical revision. Athikhun Suwannakhan: conception and design, data acquisition, analysis of data, and drafting of the manuscript. All authors: approval of final version of manuscript.
Supplementary Materials
Supplementary materials can be available from https://doi.org/10.31616/asj.2023.0030.
Supplement 1. Additional three-dimensional reconstruction models uploaded to Figshare (https://doi.org/10.6084/m9.figshare.c.6758133).
Supplement 2. Risk assessment results using anatomical quality assessment (AQUA) tool.
Supplement 3. All excluded studies and the reasons for exclusion.
Supplement 4. Funnel plot of sample size versus prevalence.
Supplement 5. Results from 48 previous studies according to our proposed classification.
asj-2023-0030-Supplementary.pdf