Is Teriparatide Superior in Treating Osteoporotic Vertebral Compression Fractures in Comparison to Bisphosphonates Treatment Alone: A 2-Year Retrospective Analysis
Article information

Abstract
Study Design
Retrospective cohort study.
Purpose
This study aimed to compare the efficacy of bisphosphonates and teriparatide in the management of osteoporotic vertebral compression fractures with regard to pain management, prevention of nonunion, and radiological as well as clinical outcomes.
Overview of Literature
Osteoporosis refers to a skeletal disorder characterized by decreased bone strength caused by poor bone density and quality causing fragility, resulting in long periods of pain-related immobilization.
Methods
In a 24-month follow-up retrospective study, 191 patients with osteoporotic vertebral compression fractures were randomly assigned to the bisphosphonate group (n=104) or the teriparatide group (n=87), with patients opting for their treatment between January 2016 and October 2020. Demographic data and patient-reported outcomes scores, including the Visual Analog Scale (VAS), Oswestry Disability Index (ODI), union rates, and kyphosis progression, were assessed at baseline, 6 months, 1 year, and 2 years after treatment.
Results
Both groups had a significant decrease in VAS, from 8.38±0.74 to 3.15±1.40 in the bisphosphonate group and from 8.49±0.73 to 1.11±0.31 in the teriparatide group. The ODI scores reduced significantly at 2-year follow-ups, recording 25.02±13.94 and 15.11±2.17 in the bisphosphonate and teriparatide groups, respectively. Risks of nonunion development were slightly higher at 11.53% in the bisphosphonate group and 8.63% in the teriparatide group required operative intervention. The kyphosis progression angles were also significantly lower in the teriparatide group (4.97°±0.78°) than in the bisphosphonate group (8.09°±1.25°).
Conclusions
Over time, numerous studies have demonstrated the efficacy of bisphosphonates and teriparatide in ameliorating pain. In this study, the efficacy of teriparatide surpassed that of bisphosphonates in certain aspects, such as the initial 6-month union rates and reduction in the progression of segmental kyphosis. However, bisphosphonates and teriparatide yield similar and favorable union rates at 1 year and final follow-up.
Introduction
Osteoporosis refers to a skeletal disorder characterized by decreased bone strength caused by a lack of bone density and poor bone quality [1]. Osteoporosis increases the risk of osteoporotic vertebral compression fractures (OVCFs). Severe back pain, abnormal posture, digestive or respiratory disorders, and poor prognosis leading to a reduced quality of life, are the most common manifestations of OVCFs [2]. In those with OVCFs, a decreased level of physical activity and dependence on others may also result in psychosocial disorders and depression [3].
A 3-year antiresorptive treatment with bisphosphonates (BPs) was reported to decrease pain and risk of vertebral collapse by 40%–50% [4]. For many years, BPs are the standard treatment for osteoporosis. Risedronate, zoledronate and alendronate are commonly used BPs. As BPs are very convenient and inexpensive, they are the preferred line of treatment for most.
BPs block osteoclast activity by targeting the enzyme farnesyl pyrophosphate synthase (FPPS). This is done by permitting the uptake of BPs from the bone surface that is then responsible for FPPS inhibition and consequent osteoclast apoptosis [5]. Oral BP therapy takes approximately 3 months to produce maximum suppression of bone resorption, and the level remains roughly constant with continued therapy [6,7].
Compared with BPs, teriparatide (TTPD) is a recombinant form of human parathyroid hormone (PTH) that increases osteoblastic activity instead of inhibiting it. TTPD has an anabolic mechanism of action, increasing bone formation. However, its greatest disadvantage is its cost. TTPD, an anabolic drug, acts on PTH type 1R receptors present in various cells such as osteoblasts, osteocytes, and renal tubular cells. PTH type 1R receptors are G-protein-coupled receptors that are important in the actions of PTH on calcium and phosphate homeostasis and bone metabolism. Gs-mediated activation of adenylate cyclase and Gq-mediated activation of protein kinase C (PKC) occur following ligand binding to the receptor. Adenylate cyclase generates cyclic adenosine monophosphate. This activates protein kinase A (PKA). Despite activation of PKA- and PKC-dependent signaling pathways by PTH, the PKA-dependent pathway is primarily used for its anabolic and catabolic effects on bones [8,9].
The diagnostic criteria for osteoporosis include a T-score and a Z-score. The relative fracture risk of women increases if the T-score is −2.5 standard deviation (SD) and the Z-score is −1.0 SD. After 2 years of TTPD therapy, lumbar bone mineral density (BMD) improved by 6.4%, and after BP therapy, the BMD improved by 4.54% [10]. On the contrary, several studies have reported adverse effects of BPs such as osteonecrosis of the jaw or atypical femoral fractures that are not reported with TTPD [11,12]. Many studies have compared the occurrence of fractures after BP and TTPD therapy [13]. In other studies, TTPD is also beneficial in promoting bony fusion following spinal fusion or correction surgery [14–16]. TTPD has an anabolic effect and acts on osteoblasts to increase the bone formation rate, preventing screw loosening in patients with postoperative instrumentation and OVCFs [14–16].
This study aimed to compare the outcomes and effectiveness of patients with OVCFs treated with BP and TTPD. This study intended to determine the effectiveness of both osteoporotic medications in preventing pain, dependency, progression of local kyphosis (Kp), risks of nonunion, increase in risks of fracture union, and devise a line of treatment effective in achieving good clinical and radiological outcomes.
Materials and Methods
After obtaining institutional review board approval from the Bombay Hospital and Research Institute (BH-EC-0133), a cohort of 191 patients who visited our spine outpatient department (OPD) with OVCFs between 2016 and 2020 and were treated conservatively with longitudinal prospective follow-up, were retrospectively analyzed in this study. Informed consent was obtained from all patients during treatment, and the use of their data in research analysis was explained.
The treatment protocol offered to all patients included conservative care with pain management using nonsteroidal anti-inflammatory drugs (NSAIDs) and opioids. NSAID and opioids were administered only during the initial acute pain phase that spanned the first 2 weeks of treatment. Subsequently, the dosage of these medications was gradually reduced and ultimately discontinued for all patients. Patients were also advised to use a lumbosacral belt and early mobilization was conducted based on pain tolerance. This study adhered to a specific protocol, wherein all participants were authorized to participate in their routine daily activities while maintaining the lumbosacral belt. Each patient received ergonomic education to encourage the prevention of abrupt and uncontrolled movements. Additionally, patients were instructed not to take complete best rest unless they encountered acute and severe discomfort. Based on acceptability and compliance with anabolic and antiresorptive agents, osteoporosis treatment using BPs and TTPD was offered to every patient. All patients also received generalized treatment in terms of nutrition and hydration, a high-protein diet, vitamin D, and calcium supplementation.
This cohort was further divided into two groups: group A included patients who opted to be treated with BPs and group B included patients who opted to be treated with TTPD. All treatment protocols followed were the same in both groups. The BP group received 70 mg of alendronate sodium weekly 70 mg. The TTPD group received a subcutaneous injection of TTPD daily (20 μg/day).
Pain progression, new-onset pain, or any fresh-onset neuro-deficit was the criteria considered indications for surgical treatment during a follow-up period of up to 2 years. At follow-up intervals, X-ray images of the affected area in supine lateral and sitting lateral positions were taken to evaluate the local Kp angle. To compare the progression of Kp in both groups, segmental Kp progression angles in groups A (BPs) and B (TTPD) were also recorded at all follow-ups. The segmental Kp angle was evaluated using a lateral radiograph, wherein the measurement was obtained by determining the angle between a line parallel to the superior endplate of the superior vertebra and that of the inferior endplate of the vertebra below with reference to the fractured vertebra. Magnetic resonance imaging was performed only in patients with any evidence of nonunion at the 6-month follow-up period.
In all patients at baseline, demographic variables such as age, sex, body mass index (BMI), BMD, percentage of vertebral body collapse, facet fracture involvement, and both endplate fractures were taken prospectively and analyzed retrospectively. To assess the overall relief of pain and activities of daily living in both groups, the Visual Analog Scale (VAS) score and Oswestry Disability Index (ODI) were recorded at baseline and serially analyzed at 6-month, 1-year, and 2-year follow-up. The number of patients who had failed medical management with new-onset neuro-deficit, pseudoarthrosis, or nonunion in both groups requiring operative intervention for pain relief was also analyzed. The diagnosis of nonunion was established when a vertebral cleft or anomalous movement was identified at the site of the fractured vertebra on lateral sitting and lateral supine radiographs.
Outcome scores were calculated for VAS using the formula: VAS=100×(preoperative VAS score–postoperative VAS score–preoperative VAS score/preoperative VAS). Similarly, outcome scores for ODI=100×(preoperative ODI score–postoperative ODI score/preoperative ODI score), were calculated. These outcomes were then graded into excellent (≥75%), good (≥50%), and average (<50%).
1. Inclusion criteria
The inclusion criteria were as follows: patients who presented to our spine OPD between 2016 and 2020 with OVCFs, fractures below the sixth thoracic vertebrae level, patients who visited our facility within the initial 2 months following their fall, patients aged >55 years, and patients compliant to medical management with antiresorptive/TTPD treatment.
2. Exclusion criteria
The exclusion criteria were as follows: patients not consenting to BP or TTPD therapy; patients aged <55 years; patients with fractures above the sixth thoracic vertebrae level; patients diagnosed with Kummels lesion before starting treatment; patients with a previous history of using antiresorptive therapy; patients with acute neuro-deficit after fractures, patients with fractures due to other secondary causes such as infectious pathology, metastasis, multiple myeloma; patients without follow-up or on any steroid therapy; and patients with uncontrolled hypertension, renal/hepatic impairment, chronic tobacco use, and other significant medical conditions like cancer.
3. Statistical analysis
All variables were expressed as numbers or percentages and compared using the chi-square or Fisher exact test. Data from both groups were compared using the Student t-test. The mean values and SDs were calculated for each characteristic in both groups. To compare changes in treatment in both groups at all follow-up points, an analysis of variance test was performed. All these statistical analyses were performed using IBM SPSS Statistics for Windows ver. 20.0 (IBM Corp., Armonk, NY, USA), with 0.05 regarded.
Results
This study consisted of a total of 194 patients, who were divided into two cohort groups based on the treatment received. All demographic and statistical data were available after the 2-year follow-up for all patients, except for one or two patients from the BP group. The BP group included 104 patients. Eighty-seven patients were treated in the TTPD group.
Some demographic variables were compared in both groups (Table 1). The mean ages in the BP and TTPD were 70.35 years and 71.06 years, respectively. The average BMI scores at baseline were 26.58 kg/m2 and 26.59 kg/m2 for the BP and TTPD groups, respectively. Both groups had nearly similar mean baseline BMD (T-scores), with groups A and B having 3.05 and 3.06, respectively. No significant statistical difference was found in the comparisons of all demographic data (p>0.05).

Demographics
The BP group included 37 male and 67 female patients, whereas the TTPD group included 35 male and 52 female patients. The BP group exhibited a prevalence of diabetes in 40.4% of the patients, whereas the TTPD group demonstrated a diabetes prevalence of 32.1%. The percentage of vertebral body collapse was calculated in both groups (Table 1). In the BP group, 10% collapse was noted in 22 patients, 10%–20% in 20, 20%–30% in 15, 30%–40% in 19, 40%–50% in 14, and >50% in 14 of them. The TTPD group also had comparable results with <10% collapse in 22 patients, 10%–20% in 13, 20%–30% in 14, 30%–40% in 12, 40%–50% in 13, and >50% in 13 of them. The BP group included 35.6% male and 64.4% female patients, whereas the TTPD group included 40.2% male and 59.8% female patients. The percentage of vertebral collapse was also analyzed at baseline, with the BP group having the maximum number (21.2%) of patients with <10% of vertebral body collapse. Similar trends were also seen in the TTPD group, with 25.3% of patients having <10% vertebral body collapse. No significant statistical difference was found in the comparisons of all demographic data (p>0.05)
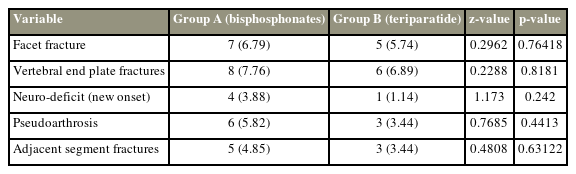
In this study, facet fractures occurred in 6.79% of the patients in the BP group and 5.74% in the TTPD group, with no statistically significant difference (p>0.05). Moreover, eight patients and six patients in the BP and TTPD groups had both vertebral endplate fractures (p>0.5). New-onset neuro-deficit occurred in 3.88% of the patients in the BP group and 1.14% in the TTPD group. In the BP and TTPD groups, 5.82% and 3.44% of the patients, respectively, experienced pseudoarthrosis. Adjacent segment fractures were found in 3.44% and 4.85% of the patients in the BP and TTPD groups, respectively (Table 2).
Incidence of facet fractures and involvement of both endplate fractures
A p-value >0.05 indicated no significant difference in the proportions of facet fractures, vertebral endplate fractures, new-onset neuro-deficit, pseudoarthrosis, and adjacent segment fractures when compared between groups A and B (Table 2).
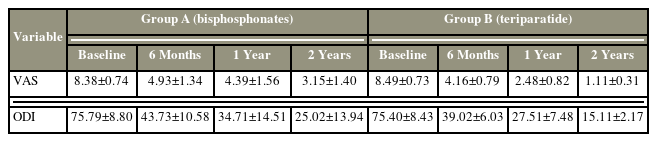
Although the difference in the demographic statistics was not statistically significant, the TTPD group appeared to have better results in reducing pain overall than the BP group (Table 3). The VAS score at the first visit had a mean of 8.38 in the BP group and 8.49 in the TTPD group. Significant reductions in the average VAS scores at 6-month, 1-year, and 2-year follow-ups were found in the BP group. Similar trends were also seen in the TTPD group, as shown in Table 3. Although the average VAS score was reduced and was comparable in both groups at the 2-year follow-up, the BP group had a mean VAS score of 3.15±1.40, whereas the TTPD group had a significant reduction in the average VAS score to 1.11±0.31. This shows that the TTPD group had a more significant reduction in pain scores at 1- and 2-year follow-ups (Table 3).
Variables VAS, ODI: timeline after initiating treatment
A similar pattern was also observed while comparing the ODI scores that showed a significantly reduced trend in both the BP and TTPD groups throughout the follow-up (Table 3). At the 2-year follow-up, the TTPD group had a more significant reduction in ODI scores to 15.11±2.17 in comparison with the BP group that had an ODI score of 25.02±13.94. This shows a significant reduction in ODI scores of approximately 60 from baseline to the 2-year follow-up in the TTPD group (p<0.5). No significant differences were observed between male and female patients in terms of VAS and ODI. However, in the TTPD group, the VAS scores were significantly improved compared with those in other groups at the final follow-up (Table 4).

Comparison of outcome in male and female patients
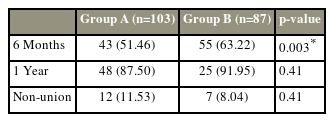
On radiological analysis, 51.46% of the patients in the BP group achieved union in 6 months, whereas in the TTPD group, 63.22% achieved union at 6 months (p<0.05). However, at 1-year follow-up and final follow-up, no significant difference was found in both groups. The BP group had slightly higher nonunion rates (11.53%) than the TTPD group (8.04%) (Table 5).
Radiological comparison of union/non-union
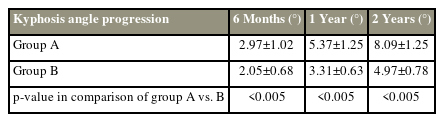
The progression of local Kp was compared between the BP group and the TTPD group (Table 6). At 6 months, the mean Kp progression in BP group was 2.97°±1.02°; in the TTPD group, Kp progressed by 2.05°±0.68°. At the 1-year follow-up, the TTPD group Kp progressed only to 3.31°±0.63°, whereas in the BP group, Kp progressed to 5.37°±1.25°. At the final follow-up, progression angles (Kp) were significantly lower in the TTPD group (4.97°±0.78°) and much higher in the BP group (8.09°±1.25°).
Progression of kyphosis at follow-up
Discussion
OVCFs can be challenging to treat. When considering patients with OVCF, it appears that the pain associated with OVCFs is more difficult to cope with than the fracture itself. In this study, the baseline VAS scores and ODI were consistently high, indicating the importance of the need for the management of pain associated with such fractures. Many studies have proven the requirement of TTPD and BPs as treatment options for OVCFs. For many years, BPs play a major role and are considered the gold standard in the treatment of osteoporosis. Fig. 1 shows a patient with OVCFs treated with BP alone, giving good complete union at the end of the 2-year follow-up visit. TTPD has recently gained a lot of attention because of its anabolic effects on bone turnover markers. A pilot study conducted in 2016 compared TTPD with a placebo regarding its effects on bone biomarkers and found that TTPD had positive anabolic effects on bone turnover markers that may help speed up fracture healing [17].
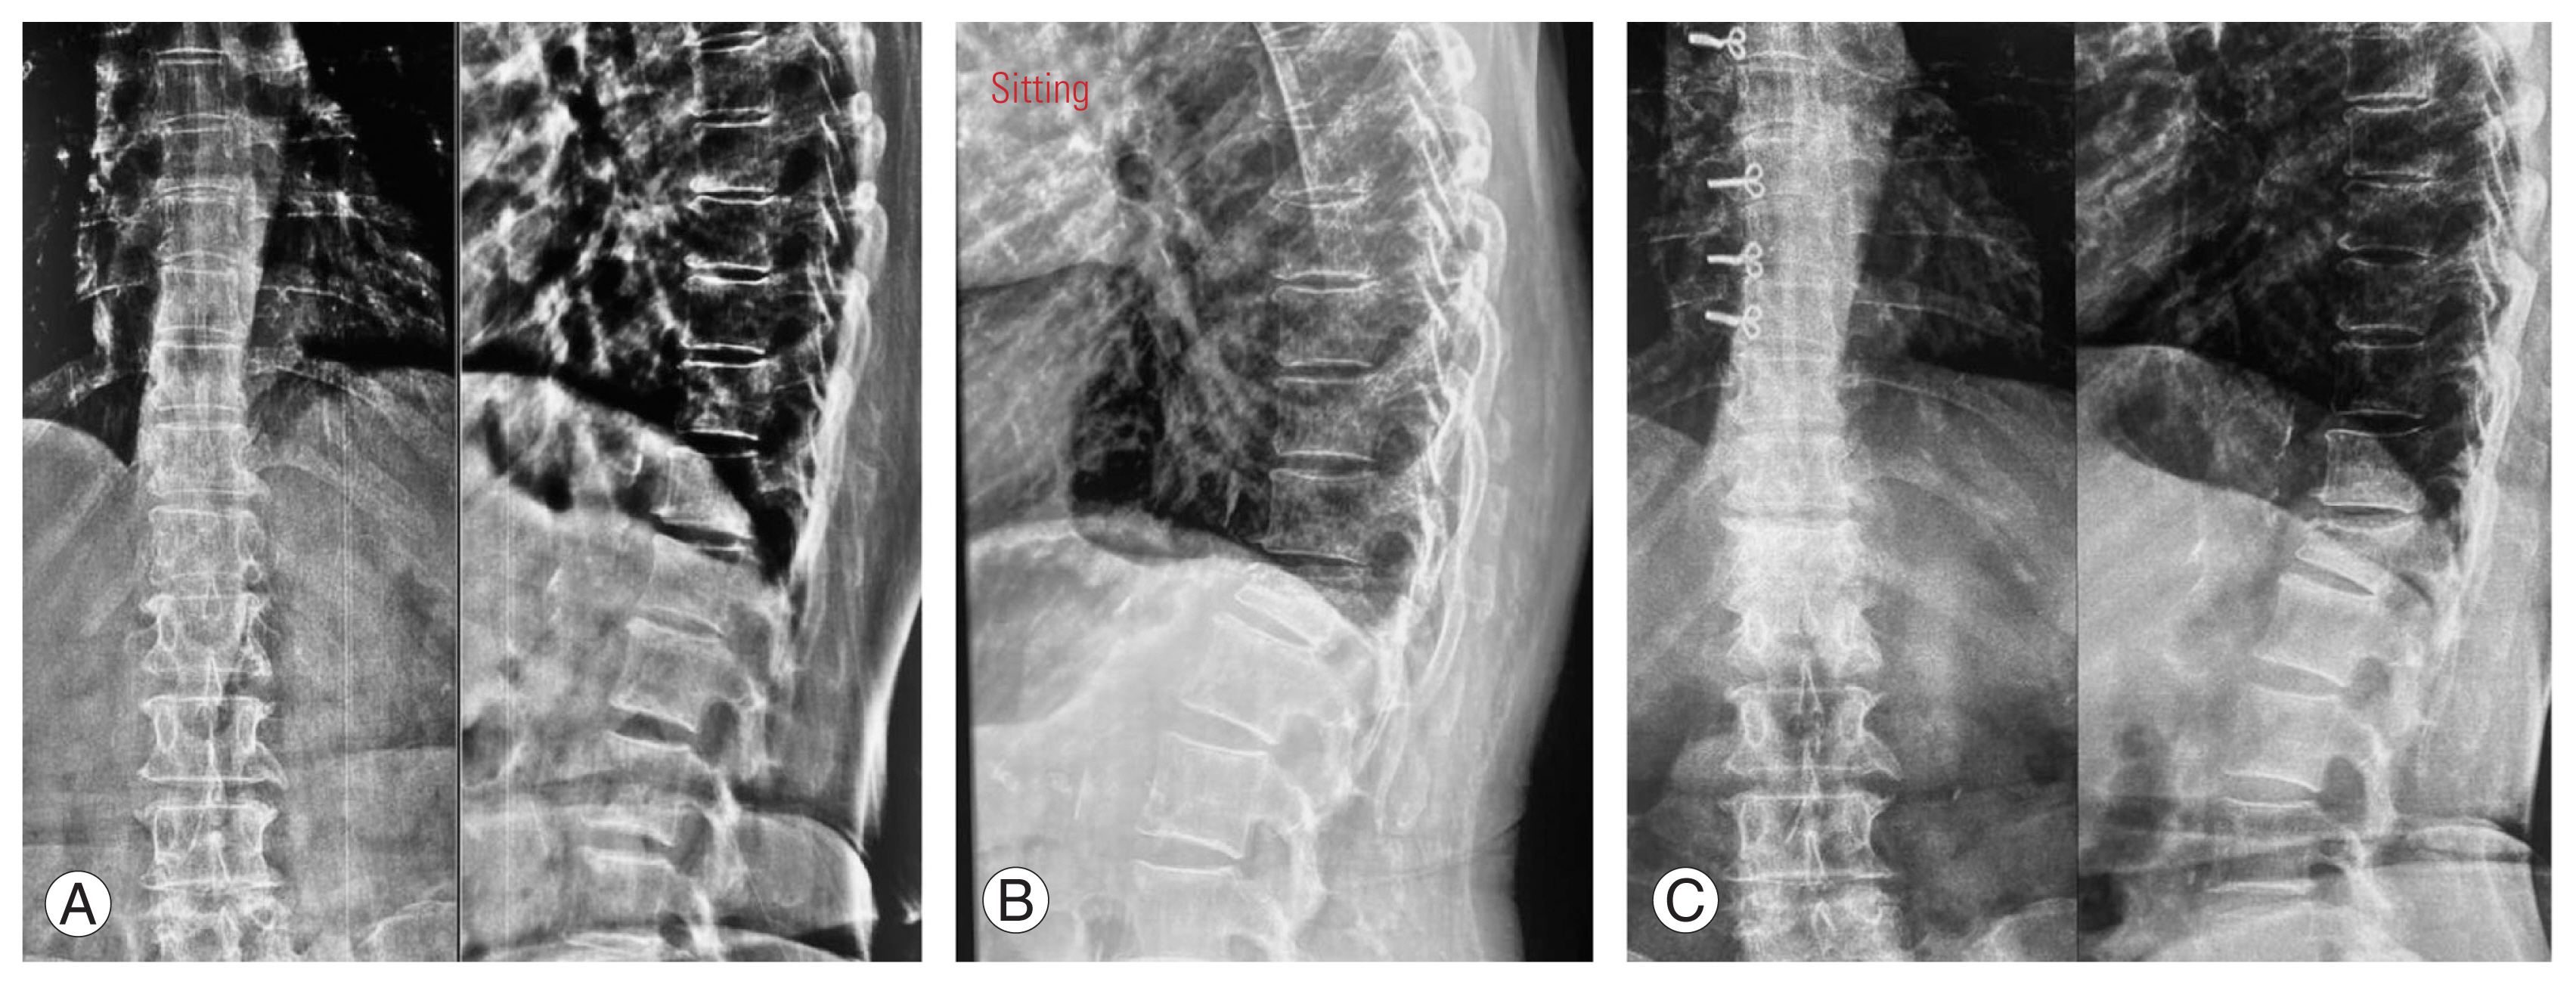
Patients serial X-rays after treatment with Bisphosphonates at 6-month (A), 1-year (B), and 2-year (C) follow-up.
In this retrospective observational study, both BPs and TTPD give good clinical results in terms of pain management and improved quality of life in patients with OVCFs. The VAS and ODI scores at 2 years of follow-up show that, in comparison with the BP group, the TTPD group has a superior reduction in pain scores associated with fractures. Chen et al. [18] compared the pain scores in a control group and TTPD group. The TTPD group showed a significant reduction in pain scores in comparison with the control group [18]. Studies also show that patients treated with BPs for up to 2–3 years have a significant reduction in the occurrence of osteoporotic fractures and better BMD scores [19]. Osteoporotic fractures treated with 12 months of TTPD adjusted the BMD scores of the spine from 3.23±0.24 to 2.88±0.24 [20].
Osteoporosis has a multifaceted cellular mechanism. The cumulative effects of normal aging, menopause, dietary calcium deficiency, and inactivity lead to an increase in bone resorption [21]. Osteoporosis causes a decrease in BMD scores, exposing patients to fractures even without any significant traumatic event. The treatment line for a patient with osteoporosis can be either antiresorptive therapy or anabolic medications. A meta-analysis conducted in 2021 showed that TTPD was superior to BPs in increasing BMD scores and was helpful for postmenopausal women in the short- and long-term treatment of osteoporosis [22]. A retrospective study conducted in 2021 on patients with OVCF treated with TTPD and alendronate showed that the area of bone mineralization in the TTPD group (54.28%) was significantly higher than that of the alendronate group (35.57%) [23]. Many such studies have shown the efficacy of TTPD in fracture healing. In the TTPD group (Fig. 2), good union was seen radiologically as well as a minimal Kp was observed after a 2-year follow-up.
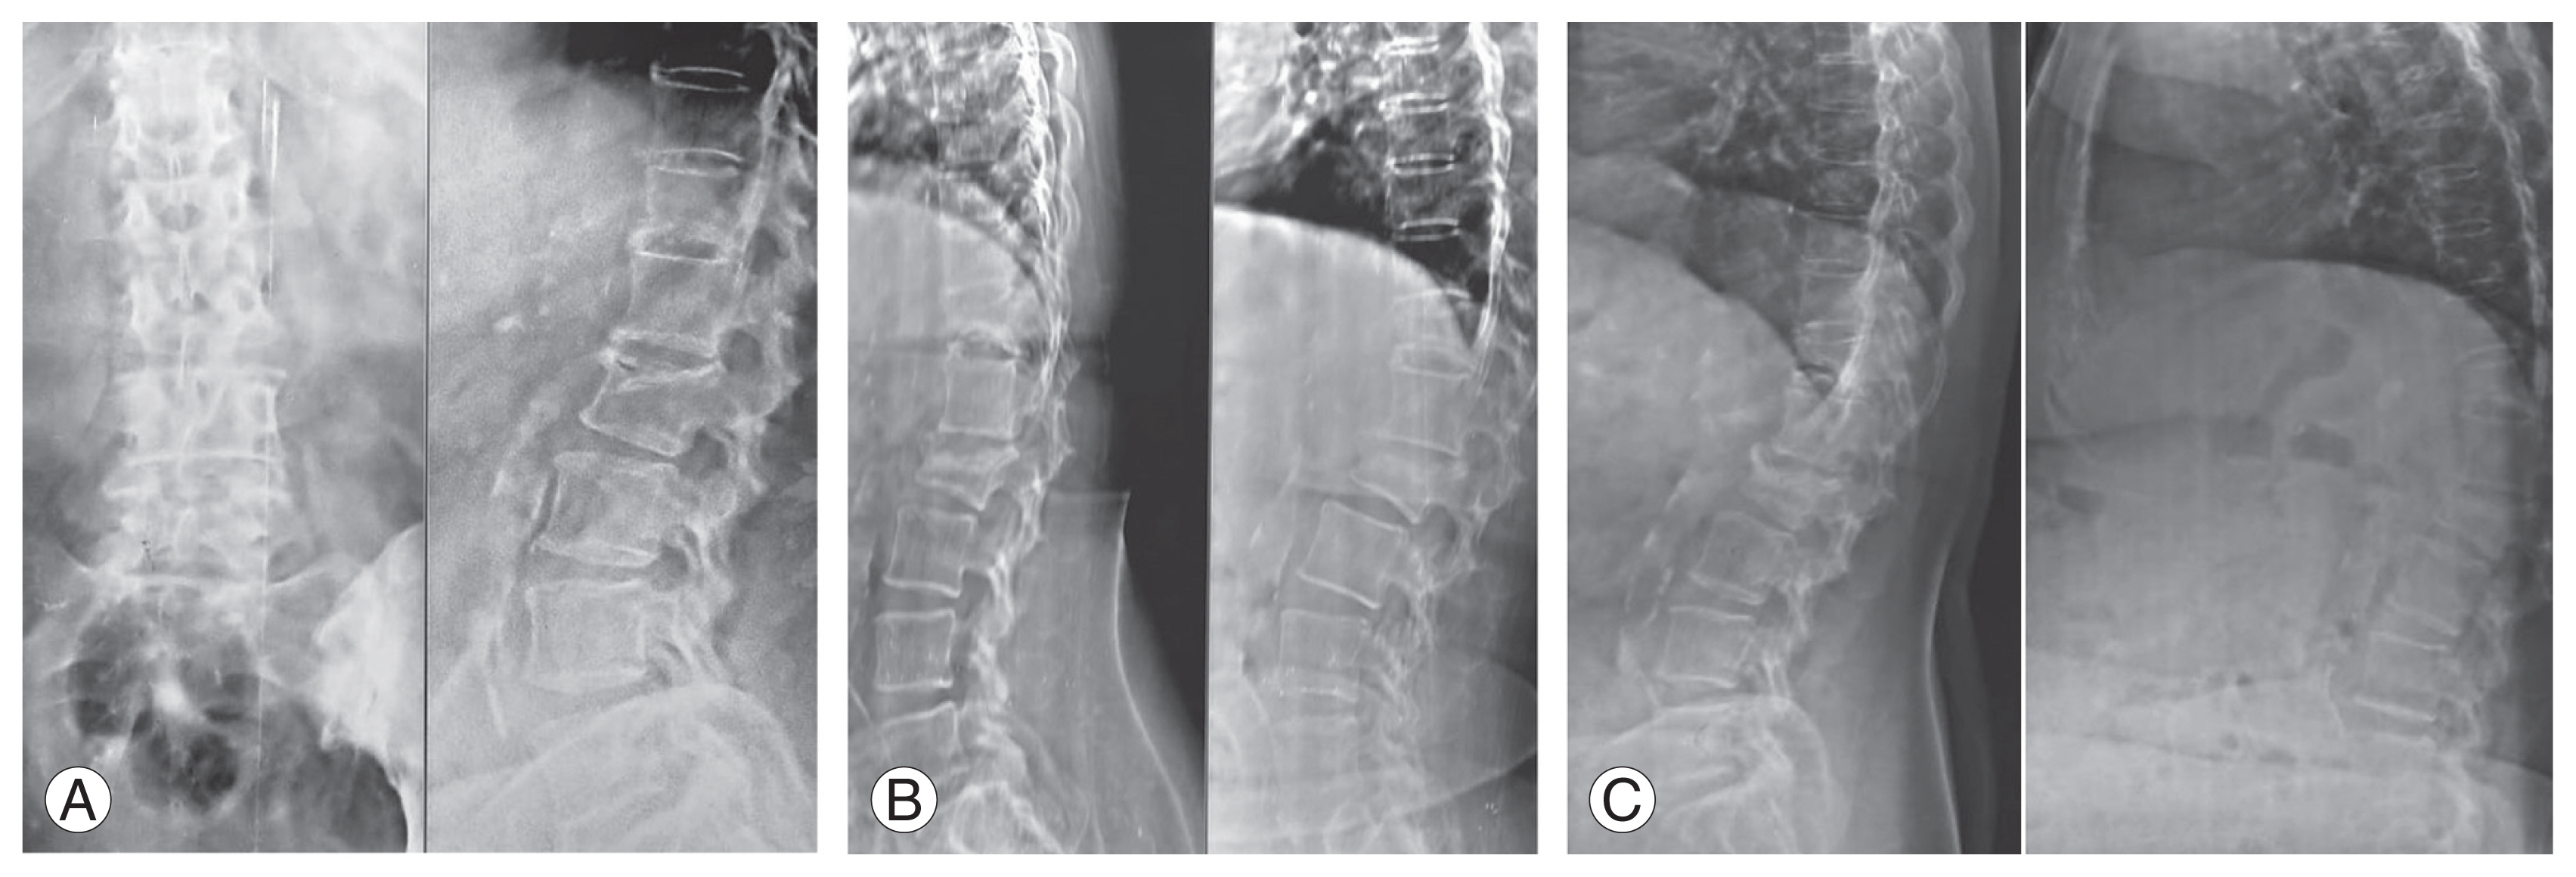
Patient treated with teriparatide, X-ray images at 1st visit (A), 1-year (B), and 2-year (C) follow-up.
This study also showed that TTPD therapy was associated with faster union rates, with only 5.75% of patients in the TTPD group experiencing nonunion (Kummels disease) in comparison with 10.68% in the BP group. The most important treatment strategy for patients with OVCFs is to prevent them from going into nonunion (Kummels disease). Nonunion cases become difficult to treat, requiring surgical procedures that might involve long-segment fixations along with bone grafting or vertebroplasty. Patients with nonunion have intractable pain because of a non-healing fracture [24]. The findings of this study indicate that when comparing the VAS scores between the pre-treatment and last follow-up assessments, the BP group demonstrated an average outcome score in 29% of the patients, 66% had scores falling within the good range, and 5% within the excellent range. By contrast, the TTPD group exhibited an average outcome score in 5.74% of the patients, 29.89% had scores falling within the good range, and 64.36% had scores within the excellent range (Fig. 3). A comparable trend was also observed in ODI outcomes, with the BP group achieving an average score in 24.30% of the patients, good score in 70.90%, and excellent score in 4.85% patients. By contrast, the TTPD group included 4.60% of patients with average outcomes, 91.92% with good outcomes, and 3.44% with excellent outcomes (Fig. 4).
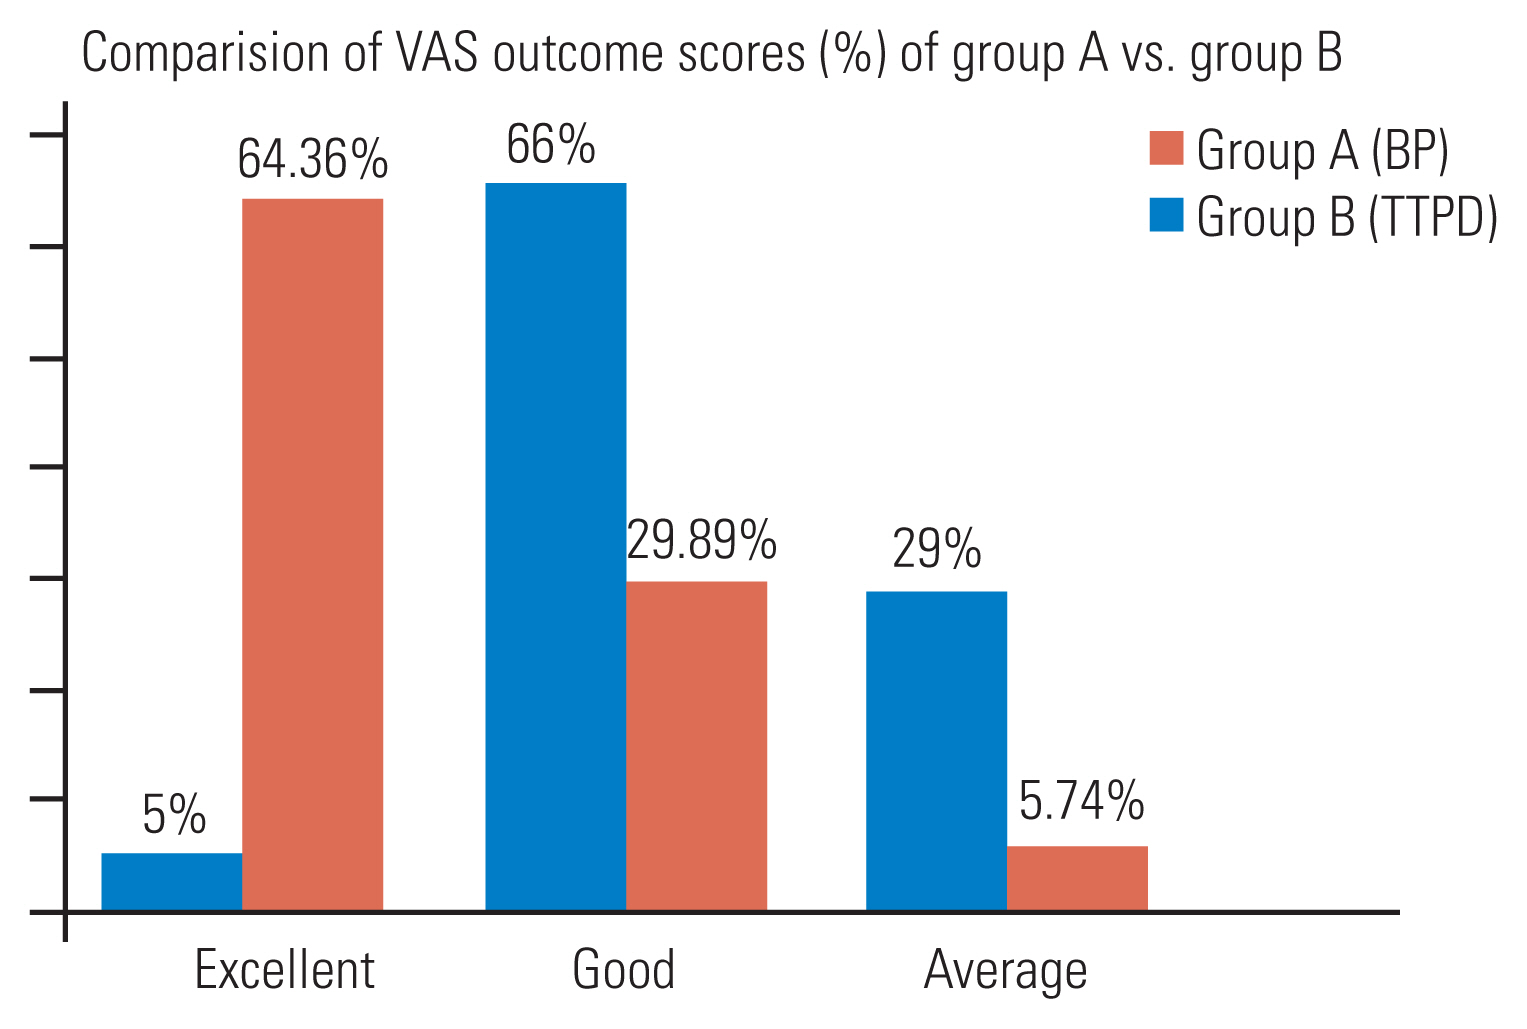
Comparative outcome of results in Visual Analog Scale (VAS) scores in both groups (Group A: bisphosphonates [BP] group; Group B: teriparatide [TTPD] group).
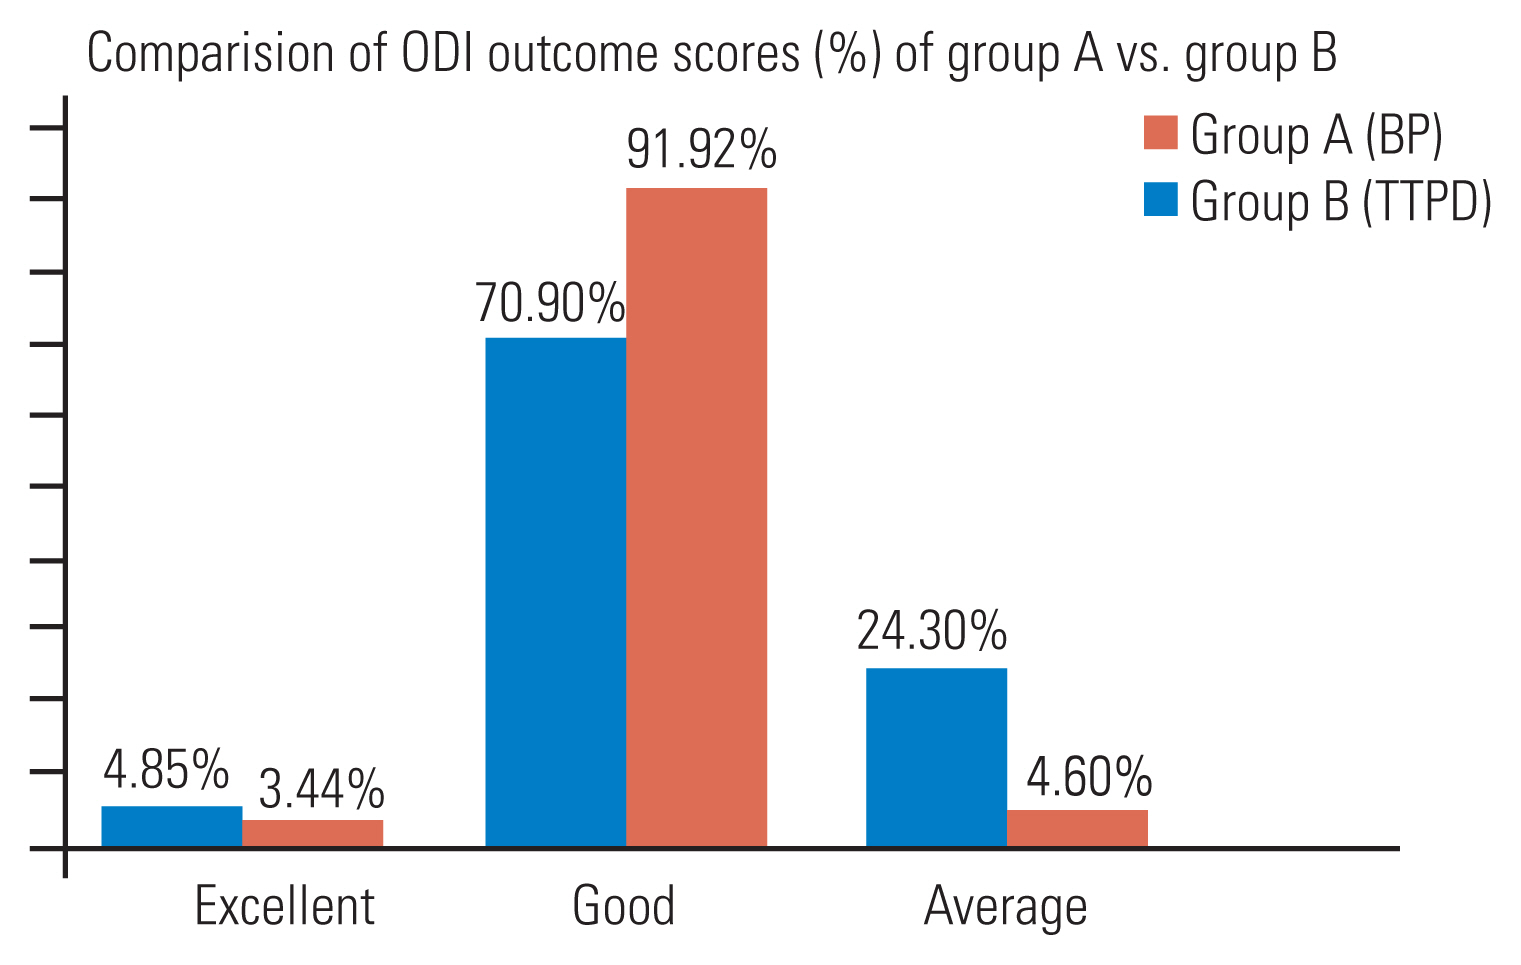
Comparative outcome of results in Oswestry Disability Index (ODI) scores in both groups (Group A: bisphosphonates [BP] group; Group B: teriparatide [TTPD] group).
A radiological study conducted in 2014 showed that 41 (75.9%) of the 54 total patients with a superior endplate fracture developed significant local Kp at the final follow-up [25]. In the present study, both BP and TTPD groups had a comparable percentage of endplate fractures, with the BP and TTPD groups having 7.76% and 6.89%, respectively. A study showed that Kp progression usually occurs weeks or months after the fracture that might not be affected much by TTPD therapy [26]. Irrespective of the union of OVCFs, progressive Kp has certain effects on a patient’s back pain and development of adjacent-level fractures [27]. In the present study, at the first visit, the Kp angles in both groups were comparable, with the BP and TTPD groups having mean Kp angles of 14.95° and 15.95°, respectively. However, on serial follow-up X-rays, the Kp progression in all cases was measured at 6 months, 1 year, and 2 years. More Kp progression was noted in the BP group (Table 6). The TTPD group had significantly less progression in local Kp angles.
This study was conducted with a 2-year follow-up period. This study helped us understand the analgesic effects of TTPD and BPs in a long-term setting. The incidence of Kummels lesion was comparable in the BP group (10.68%) and relatively lower in the TTPD group (5.75%). All patients with Kummel lesions had to undergo surgery to alleviate pain. A study conducted in 2020 that compared TTPD and operative treatment for OVCFs, showed similar results in terms of clinical outcome and that TTPD was superior because of the larger cost advantage in comparison with the operative procedure [28].
All patients were compliant with treatment, and no fallout from treatment was noted in either the BP or TTPD groups. The drawbacks in this study could be related to our inability to trace the bone turnover biomarkers, and a BMD analysis was not conducted to show the anabolic effects of both groups. Our study is also limited to a single center; hence, a multicenter study with long-term follow-up might provide a better perspective. Undoubtedly, even today, BPs should be considered the first line of management in treating patients with osteoporosis. The use of TTPD should be reserved for cases with frank osteoporosis, multiple-level OVCFs, and failed conservative treatment with BPs. However, with the higher nonunion rates in the BP group (Fig. 5), BPs alone might not give the desired result in every patient.
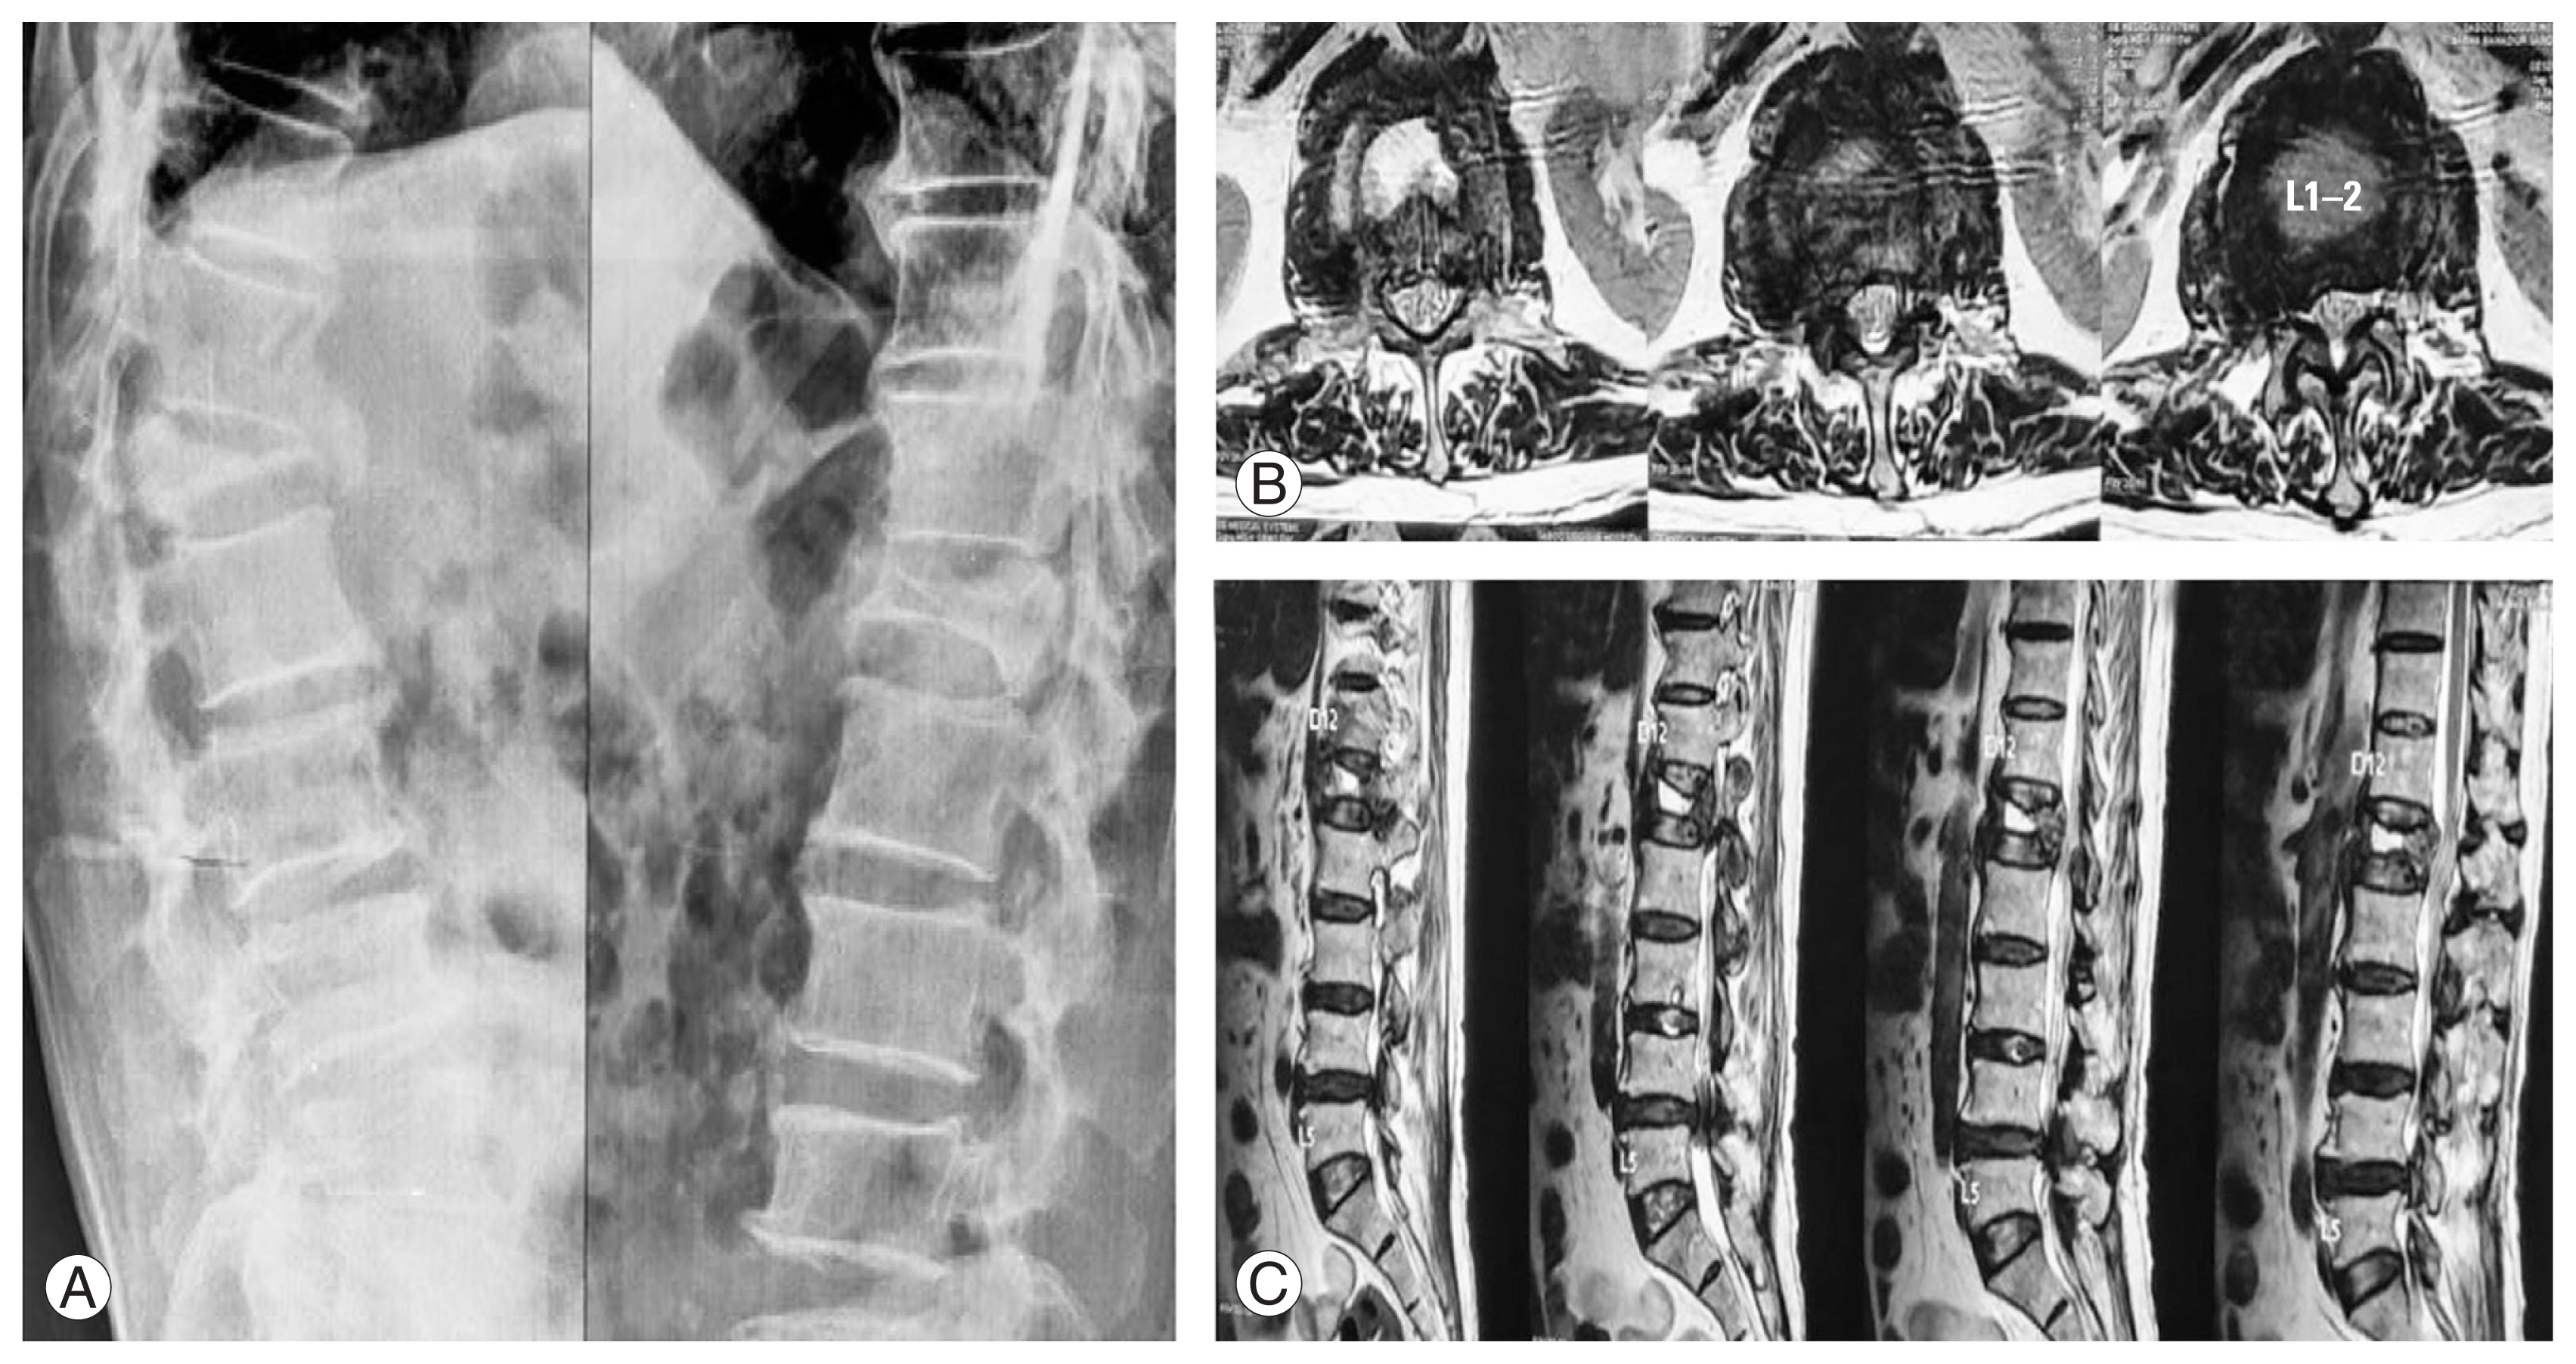
(A–C) Patient treated with Bisphosphonates for 6 months: non-union (Kummels lesion).
Conclusions
TTPD therapy has demonstrated favorable clinical outcomes, as evidenced by improvements in VAS and ODI scores, among individuals diagnosed with OVCFs. Although the BP group also demonstrated favorable clinical outcomes, the TTPD group exhibited significantly higher union rates at 6 months. However, no statistically significant difference was observed between the two groups in terms of the union rates after 1 year. The TTPD group exhibited a significantly lower increase in segmental Kp compared with the BP groups across all follow-up periods.
Notes
Conflict of Interest
No potential conflict of interest relevant to this article was reported.
Author Contributions
Conceptualization: VK, VN; data curation: VN, AS, MJ; formal analysis: VN, ND; methodology: VK, VN; project administration: VN; visualization: VK, VN; writing–original draft: VN; writing–review & editing: VK; and final approval of the manuscript: all authors.