Erector Spinae Atrophy Correlates with Global Sagittal Imbalance and Postoperative Proximal Junctional Kyphosis Incidence in Lumbar Degenerative Kyphosis
Article information

Abstract
Study Design
Retrospective cohort study.
Purpose
This study aimed to investigate the relationship between lumbar erector muscle atrophy and global sagittal imbalance in lumbar degenerative kyphosis (LDK) and with postoperative proximal junctional kyphosis.
Overview of Literature
Lumbar erector muscle atrophy has been studied in LDK. However, its role in the compensatory mechanism is still under intense discussion, and the role of erector spinae (ES) muscle is always overlooked.
Methods
This study enrolled 51 patients with LDK out of 382 patients with adult degenerative spinal deformity. Baseline information was reviewed including demographic data and complications. Sagittal spinopelvic alignments and global imbalance parameters were assessed on full-length X-ray images of the spine. Muscularity and the fatty infiltration area of the ES and multifidus (MF) were measured at the L4/5 level on preoperative magnetic resonance image to evaluate the lumbar erector muscle atrophy. Stratification by sagittal vertical axis (SVA) was performed: group 1 with SVA <100 mm and group 2 with SVA >100 mm, and these groups were compared. Spearman correlation and multivariable logistic regression analyses were performed to analyze and define risk factors of postoperative proximal junctional kyphosis (PJK).
Results
Group 2 had lower ES and MF muscularity than group 1. ES muscularity correlated with SVA (r=−0.510, p=0.003), lumbar lordosis (r=−0.415, p=0.018), and postoperative PJK (r=−0.508, p=0.022). MF muscularity did not correlate with the above parameters. Multivariable logistic regression analysis verified ES muscularity (odds ratio [OR], 0.001; p=0.039) and SVA (OR, 1.034; p=0.048) as the risk factors for postoperative PJK.
Conclusions
ES atrophy, besides the MF, is an important predictor in distinguishing decompensated LDK from well-compensated ones. It plays an important role in compensatory mechanism, not only correlates with global sagittal imbalance but also ties to PJK after deformity corrective surgery.
Introduction
Lumbar degenerative kyphosis (LDK) has become a common disease in older people [1,2]. It is defined as sagittal imbalance caused by lumbar kyphosis or loss of lumbar lordosis (LL) [3]. Dynamic imbalance and obvious stooping are the characteristics of LDK [4,5]. Takemitsu et al. [6] revealed the pathology as disc narrowing and lumbar extensor muscle atrophy. According to Kang et al. [7], lumbar multifidus (MF) muscularity was smaller in the LDK group than in the control group. Yagi et al. [2,8] also reported significantly decreased cross-sectional area (CSA) and increased fatty infiltration area (FIA) of the MF in LDK. Owing to the tremendous increase in the sagittal vertical axis (SVA), they redefined LDK as a drop body syndrome (DBS), as a distinct form of adult degenerative spinal deformity (ADSD) [8]. Most previous studies have focused on MF muscularity in patients with LDK; however, the role of the erector spinae (ES) muscle is overlooked.
Some patients with LDK have a severe imbalance with increased SVA, whereas some are well-compensated ones with normal or slightly increased SVA [9]. A flat or lordotic thoracolumbar junction is the predictor of well compensation [5]. Lumbar extensor muscles, particularly the ES, might be crucial in the compensatory mechanism [10–12].
Accordingly, this study aimed to investigate the relationship between the lumbar erector muscles (i.e., ES and MF) and global sagittal balance in LDK, and the postoperative proximal junctional kyphosis (PJK) after deformity corrective surgery.
Materials and Methods
Between September 2003 and December 2020, a total of 382 consecutive patients with ADSD were enrolled in our institution, 210 patients with leg pain were excluded because of severe neurological symptoms, and another 108 patients were excluded because of obvious coronal plane deformity (Cobb angle >30°). Out of 64 patients with LDK, 13 with follow-up of <2 years were excluded, and 51 patients with LDK were enrolled in the study.
This was a retrospective study of medical records. This study was approved by the Shandong Provincial Hospital Affiliated to Shandong First Medical University (IRB no., NFSF 2020-528), and written informed consent was obtained from all participants. Baseline data consisted of demographic information and clinical information including natural history, rate of deformity corrective surgery, incidence of PJK, and clinical outcomes evaluated by the Oswestry Disability Index (ODI) [13].
The inclusion criteria were as follows [8,14]: patients with LDK, aged >50 years, with LL <10°, or pelvic incidence–lumbar lordosis mismatch (PI–LL) of >30°, with follow-up of >2 years, without obvious coronal plane deformity (Cobb angle <30°). The exclusion criteria were as follows: a history of syndromic imbalance or neuromuscular scoliosis; a history of lumbar spinal surgery; a spinal pathology such as osteoporosis vertebral fracture, infection, and tumor; an obvious coronal plane deformity (Cobb angle >30°); and with follow-up <2 years.
Sagittal spinopelvic alignment and global balance parameters were assessed on lateral 36-inch (91.44 cm) standing radiographs according to the established positioning protocol, including pelvic incidence (PI), pelvic tilt, and sacral slope (SS), LL, proximal LL (PLL, Cobb angle between the upper endplate of L1 and L4) [15], distal LL lordosis (DLL, Cobb angle between the upper endplate of L4 and S1), thoracolumbar kyphosis (TLK), thoracic kyphosis, SVA, T1 pelvic angle (TPA) [16], and PI–LL mismatch [17]. The proximal junctional angle (PJA) was measured from the lower endplate of the upper instrumented vertebra (UIV) to the upper endplate of the second supra-adjacent vertebra above the UIV. PJK was diagnosed when the PJA met the following criteria: (1) PJA ≥10° and (2) at least 10° greater than the preoperative measurement. The measurement was done on Surgimap software (Nemaris Inc., New York, NY, USA) (Fig. 1A). Lordosis was recorded as negative, whereas kyphosis was recorded as positive.
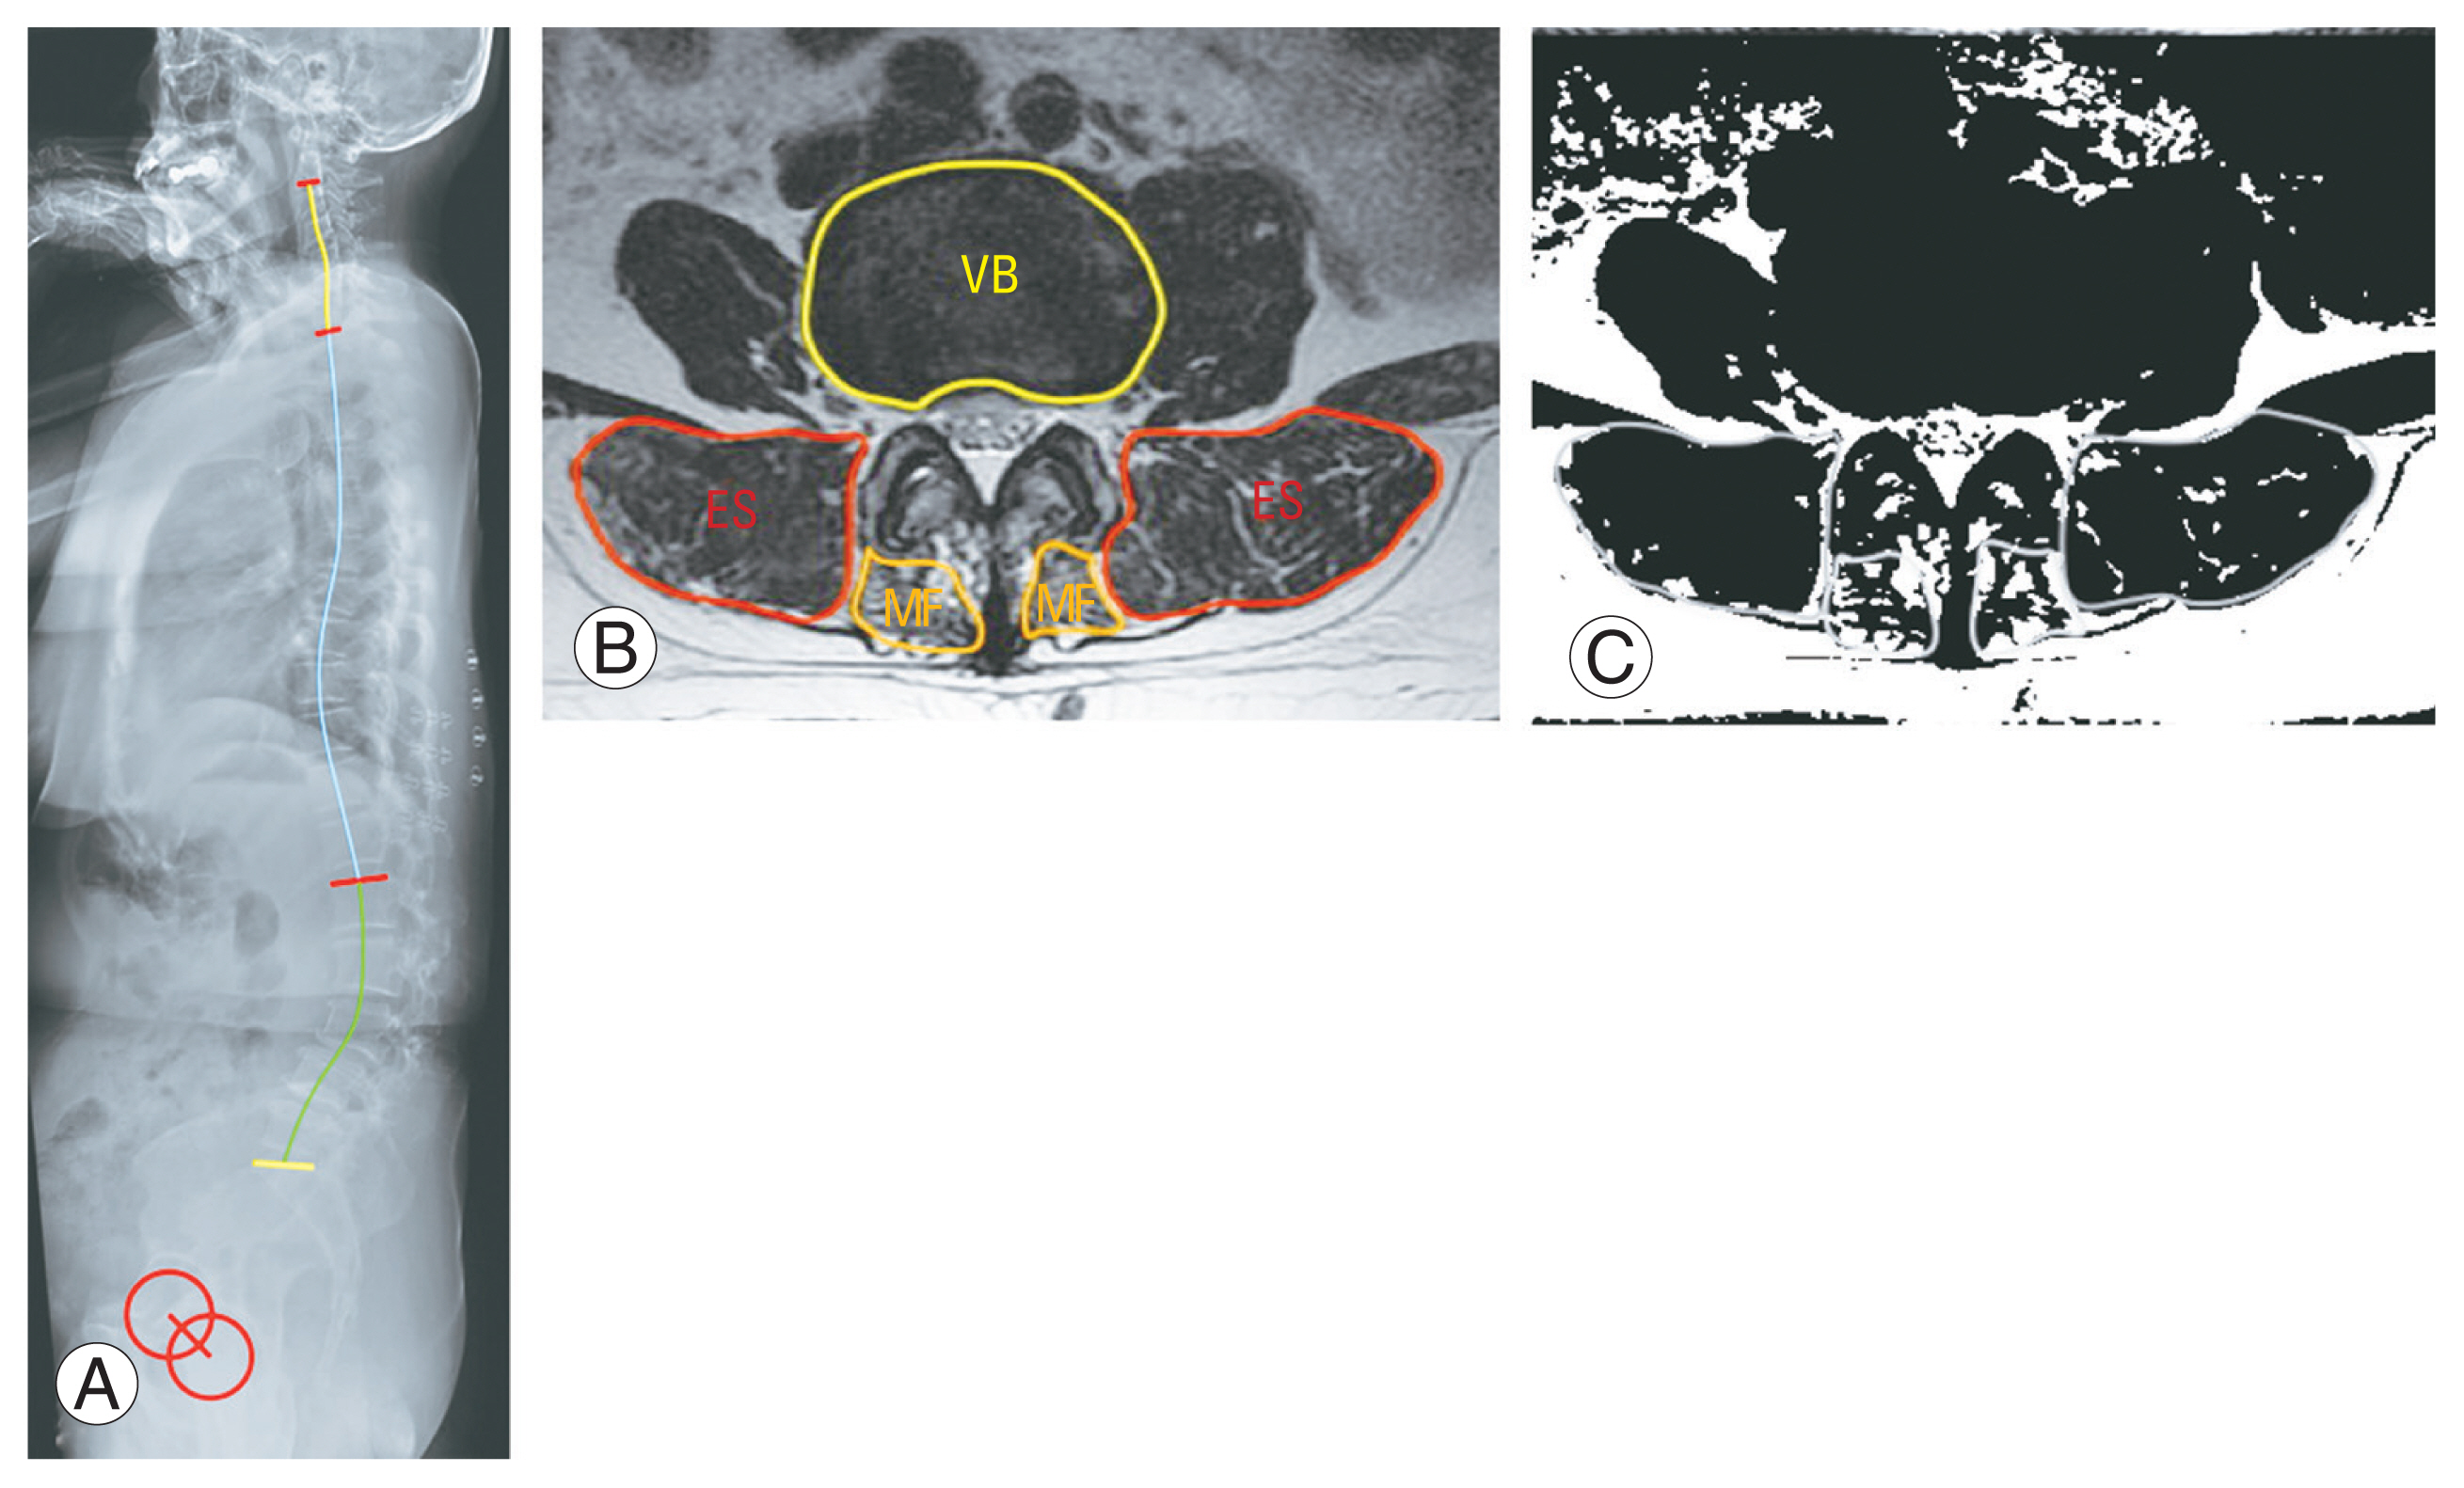
The graph shows the measurement of the sagittal spinopelvic alignments (A) and cross-sectional area (CSA) of erector spinae (ES) and multifidus (MF) and L4 vertebral body (VB) using magnetic resonance imaging (B). CSA of muscle was calculated as the mean value of bilateral CSA. Muscularity=CSA of muscle-VB ratio. (C) Then the image was converted into a binary image after calculating CSA of ES and MF, and the white area was considered fatty infiltration area (FIA) and was calculated as the ratio of FIA to total CSA.
The quantity and quality of lumbar muscles were represented by muscularity and FIA, respectively. ES and MF muscularity were measured as the ratio of the CSA of the ES and MF to the CSA of the vertebral body (VB) [18]. ES, MF, and VB were measured on magnetic resonance images at the L4 inferior endplate level [7]. The CSA of ES and MF measurements were processed on ImageJ (National Institutes of Health, Bethesda, MD, USA). The fascial boundaries of the ES and MF were outlined on the T2-weighted image, and the CSA was calculated by ImageJ (Fig. 1B). The mean value of the bilateral CSA was recorded as the CSA of the ES and MF. The FIA in the total CSA of the ES and MF was evaluated [8]: the image was converted into a binary image after calculating the CSA of the ES and MF, and the white area was considered the FIA and was calculated as the ratio of the FIA to the total CSA (Fig. 1C).
Stratification by the SVA value was performed: group 1 with SVA <100 mm and group 2 with SVA >100 mm. The independent t-test was performed to compare quantitative variables between the two groups, and the chi-square test was performed for qualitative variables. The Spearman correlation coefficient was used to analyze the relationship between parameters in the entire cohort. Multivariable logistic regression analysis was performed to define the risk factors for postoperative PJK. The distribution of parameters was recorded as means and standard deviations. The significance threshold was set at 5% (p<0.05). The statistical analysis was performed on IBM SPSS software ver. 27.0 (IBM Corp., Armonk, NY, USA).
Results
Groups 1 and 2 included 27 and 24 patients, respectively. No significant difference was found in the basic demographic parameters between the two groups. The mean age was 61±6 years in group 1 and 62±5 years in group 2 (p=0.812). The body height was 161±36 cm in group 1 and 162±31 cm in group 2 (p=0.535). The body weight was 63.2±4.4 kg in group 1 and 63.4±5.0 in group 2 (p=0.963). The body mass index (BMI) was 24.3±1.4 in group 1 and 24.1±1.5 in group 2 (p=0.799). All patients with LDK included in this study were female. The initial and final ODI values were 58.2±9.5 and 36.5±10.3, respectively. The rate of deformity corrective surgery was comparable between the two groups (p=0.958): 21 of 27 cases in group 1 and 19 of 24 cases in group 2. Group 2 had a higher PJK incidence than group 1, albeit without significance (p=0.177) after deformity corrective surgery: seven out of 21 in group 1 and 10 out of 19 in group 2.
Group 1 had higher lumbar erector muscle muscularity than group 2; however, FIA was comparable between the two groups (Table 1). ES muscularity was 0.79±0.24 in group 1 and 0.49±0.17 in group 2 (p=0.001), MF muscularity was 0.24±0.06 in group 1 and 0.17±0.07 in group 2 (p=0.004). The FIA of the ES was 0.32±0.21 in group 1 and 0.51±0.29 in group 2 (p=0.090), and those of MF were 0.41±0.25 in group 1 and 0.58±0.26 in group 2 (p=0.127). Except for the sagittal global parameters consisting of SVA, PI–LL mismatch, and TPA, the only sagittal spinal alignment parameter with a statistically significant difference between the two groups was DLL (p=0.015): group 1 had a greater DLL (−26.4°±15.4°) than group 2 (−12.3°±14.1°).
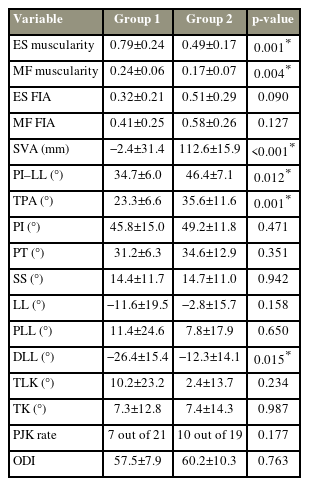
Comparison of spinal alignments and lumbar muscularity between two groups
According to the results of the Spearman correlation coefficient analysis, ES muscularity was found to correlate with the SVA (r=−0.510, p=0.003), PI–LL (r=−0.517, p=0.002), TPA (r=−0.543, p=0.001), LL (r=−0.415, p=0.018), and DLL (r=−0.349, p=0.053) (Table 2). MF muscularity did not correlate with the above parameters. Except for the sagittal global balance parameters consisting of the PI–LL mismatch and TPA, DLL was the only spinal alignment parameter that correlated with the SVA (r=0.565, p=0.001). DLL also correlated with the PLL (r=−0.613, p<0.001) and TLK (r=−0.713, p<0.001). PJK after deformity corrective surgery correlated with ES muscularity (r=−0.508, p=0.022), SVA (r=0.574, p=0.005), DLL (r=0.495, p=0.037), and TPA (r=0.489, p=0.021).
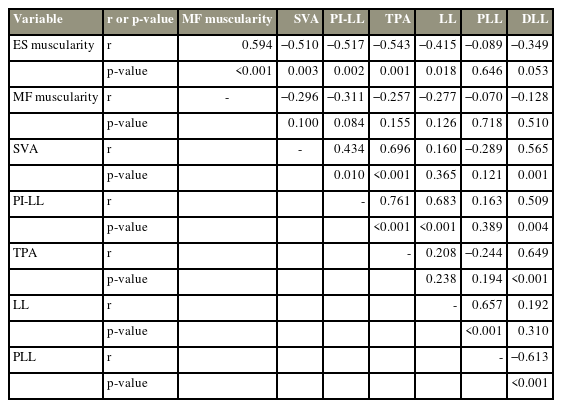
Spearman correlation coefficients between lumbar muscularity and sagittal spinal alignment parameters
Multivariable logistic regression analysis was performed to verify the risk factors of postoperative PJK (Table 3). ES muscularity (odds ratio [OR], 0.001; 95% confidence interval [CI], 0.000–0.600; p=0.039) and SVA (OR, 1.034; 95% CI, 1.000–1.069; p=0.048) were found as risk factors of postoperative PJK. MF muscularity and MF FIA were not risk factors of postoperative PJK.

Multivariable logistic regression analysis of risk factors for postoperative proximal junctional kyphosis
Discussion
LDK initially presents as degenerative loss of LL or flatback syndrome without a history of spinal surgery [6]. It is more frequently reported in Asian populations than in Western populations [19]. A floor-living lifestyle and a squatting posture in household work might contribute to the fact that LDK mainly occurs in older and female patients [19,20]. The main problems caused by LDK included sagittal imbalance and mechanical pain, as same as the other ADSD types [21]. Typically, as there was no obvious coronal deformity, LDK is usually categorized as “N type” (no major coronal deformity) according to the SRS-Schwab ADSD classification [14]. Owing to the unique characteristics of LDK, Yagi et al. [2] redefined LDK as DBS, as one distinct form of ADSD.
Lumbar extensor muscle atrophy is the main cause of LDK [6,7]. To compensate spinal malalignment caused by LDK and to erect position, the ES musculature must be tensed [9]. However, patients with LDK possess decreased muscularity and increased FIA of lumbar extensor muscles [7,8,12], including both ES and MF. Studies on lumbar extensor muscle atrophy of LDK have mainly focused on comparisons with a control cohort with low back pain [7] or comparison with other kinds of ASD [8]. To further investigate the role of lumbar extensor muscles in the compensatory mechanism of LDK, we focused on the difference in lumbar extensor muscle atrophy between patients with decompensated and well-compensated LDK.
Patients with decompensated LDK in group 2 possess lower muscularity of both ES and MF than the well-compensated ones in group 1 (Fig. 2); however, the FIA of both ES and MF are comparable between the two groups. The results demonstrate the key role of lumbar extensor muscle atrophy in the compensatory mechanism [11,22]. ES might play a more crucial role than MF because ES muscularity, other than MF, correlated with sagittal global balance parameters consisting of SVA, PI–LL, and TPA and spinal alignment including LL and DLL.
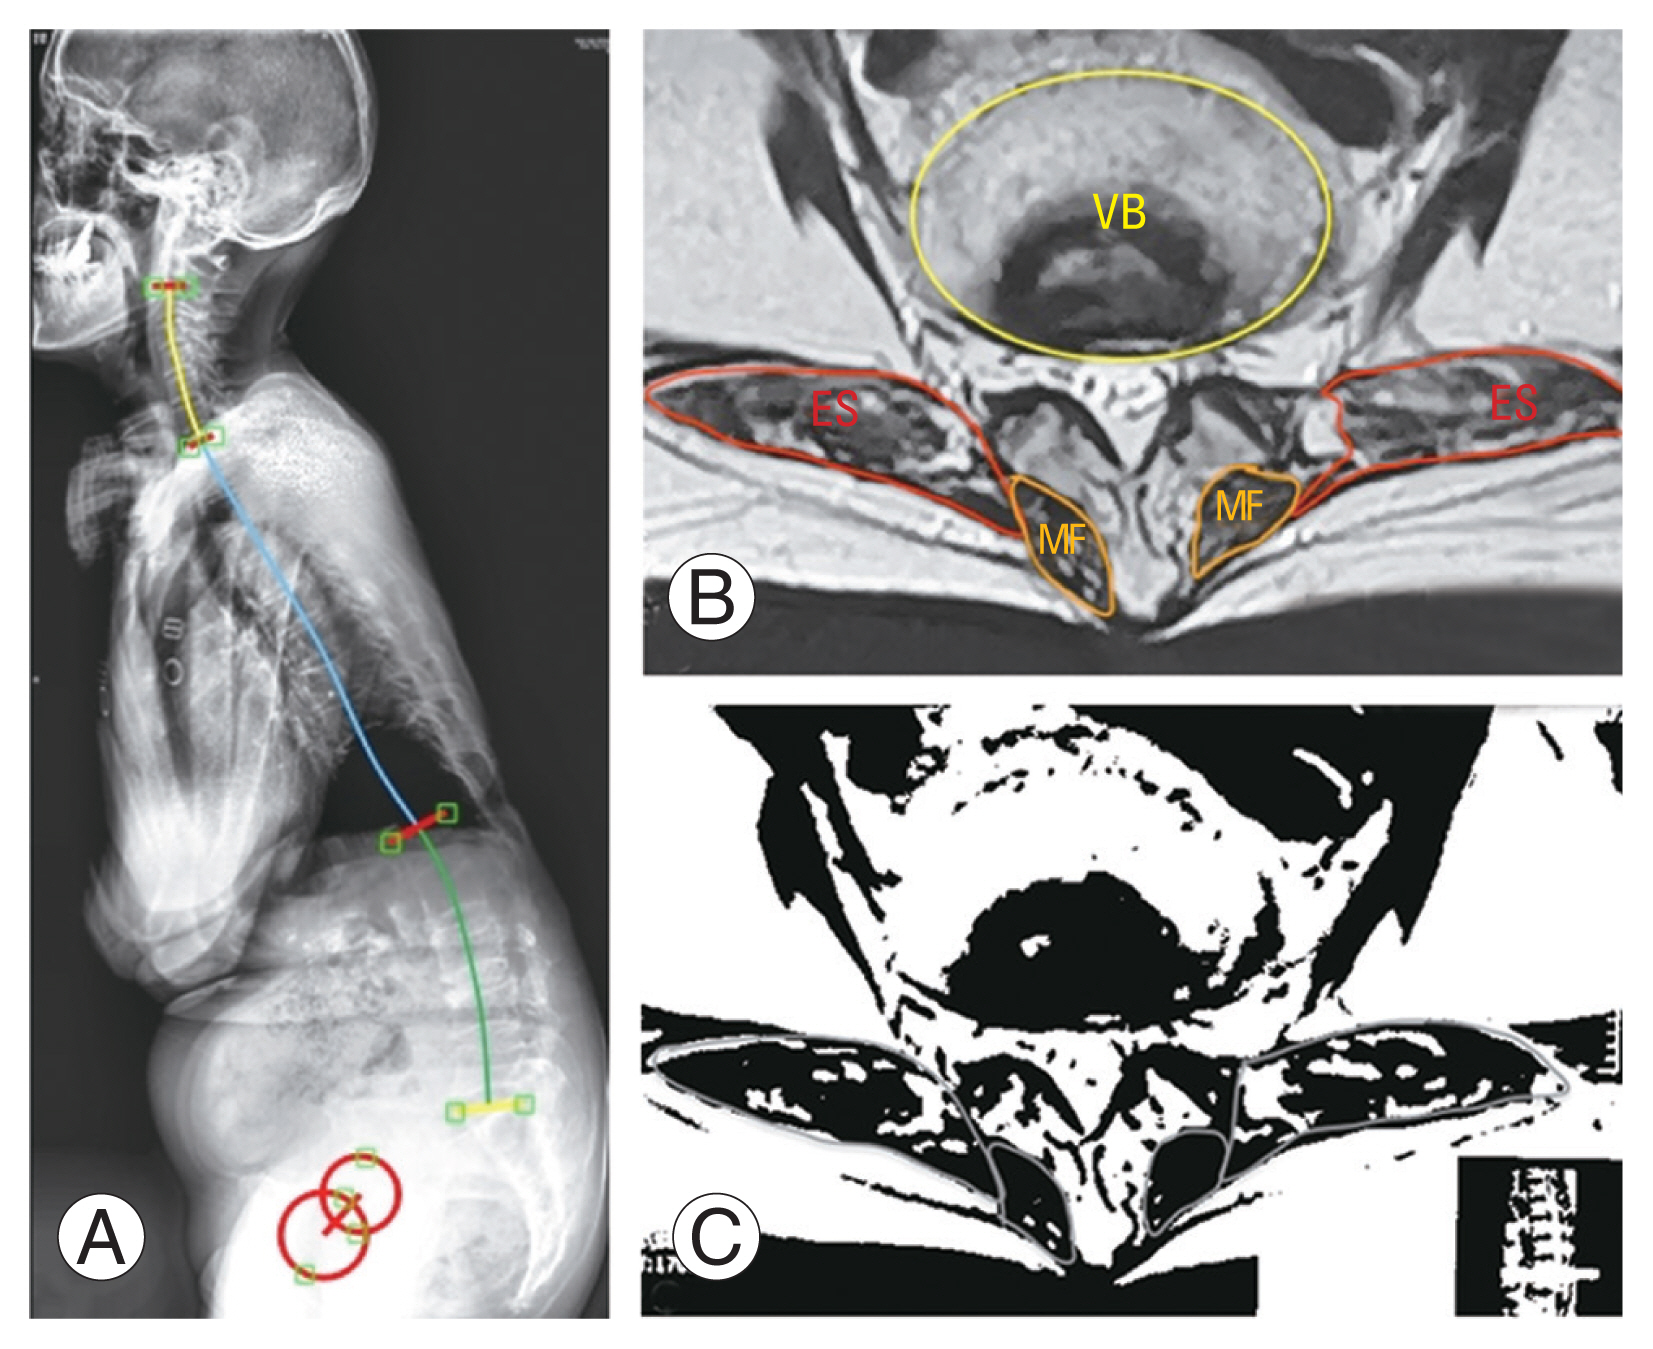
(A) The graph shows a decompensated lumbar degenerative kyphosis patient with sagittal vertical axis=203 mm and PI–LL=81°. (B, C) She has obvious erector spinae (ES) atrophy, which is revealed by decreased ES muscularity (0.229). MF, multifidus; VB, vertebral body; PI–LL, pelvic incidence-lumbar lordosis mismatch.
Sagittal spinal malalignment is the result of compensation to lumbar kyphosis. A flat or lordotic thoracolumbar junction upon the lumbar kyphosis is supposed as the predictor of the well compensation of LDK [3,9], although the magnitude of lumbar kyphosis does not correlate with either global sagittal imbalance or clinical outcomes [23]. When dividing LL morphology into proximal and distal proportions [15,24], the distal part (DLL) correlated with the SVA, PLL, and TLK. This illustrates that DLL loss might be the driver of sagittal malalignment. A lordotic thoracolumbar junction is sequentially generated to compensate for the stooping posture caused by DLL loss (Fig. 3). Accordingly, deformity corrective surgery should focus on restoring an ideal DLL [9].

The graph illustrates the impact of loss of distal lumbar lordosis (DLL) on global sagittal imbalance. (A) Patient in group 1 has a flat lumbar lordosis (LL=−6°) and increased PI–LL mismatch (PI–LL=35°). (B) She is well-compensated due to the well-maintained DLL (−27°), a deformity corrective surgery helps to improve the clinical outcomes. (C) A flat DLL (−3°) exhibits in patient in group 2 and causes severe global sagittal imbalance (sagittal vertical axis=101 mm, PI–LL=72°), albeit a lordotic thoracolumbar junction is sequentially generated to compensate the loss of DLL. (D) Global sagittal balance maintains well at 6-year follow-up after deformity corrective surgery from T10 to S1. PI, pelvic incidence.
Global sagittal imbalance occurs after LDK progressed into decompensation [9]. SVA and PI–LL mismatch are valid sagittal modifiers in the SRS-Schwab classification [14]. SVA >100 mm and PI–LL >30° predicted severe global sagittal imbalance, pain, and disability [14]. Accordingly, in the present study, these cutoff values are used to distinguish decompensated and well-compensated LDK. TPA is another parameter used to evaluate global sagittal imbalance and correlated with clinical outcomes [16,25]. In this study, SVA, PI–LL mismatch, and TPA strongly correlated with each other and indicated a high extent of global sagittal imbalance in patients with LDK. ES plays a more important role in global sagittal imbalance than MF, which is a novel finding. ES muscularity correlated with the global sagittal imbalance parameters, such as SVA, PI–LL mismatch, and TPA; however, MF muscularity did not correlate with the global sagittal imbalance parameters.
The prevalence of PJK in LDK is higher than the other ADSD types [2], albeit surgeons have paid great caution [9,20]. The incidence of PJK after deformity corrective surgery in the analyzed cohort is comparable to that in previous studies [2,9,19,20,23]. Numerous risk factors for PJK have been reported, including old age, upper instrumented vertebrae below L2, LL–PI ratio, LL magnitude, SS related to PI, fusion down to the sacrum and ilium, oversized LL correction, improper rod contouring angle, and postoperative Roussouly-type mismatch [19,26–29]. The results of this study verified ES atrophy as an important risk factor of PJK after long fusion stopping at the thoracolumbar junction. The Spearman correlation analysis showed that PJK correlated with ES muscularity, SVA, TPA, and DLL. The multivariable logistic regression analysis only identified ES muscularity and SVA as risk factors of postoperative PJK. Patients with LDK and lower ES muscularity and greater SVA have higher risks of PJK after deformity corrective surgery.
This study has some limitations that need further discussion and investigation. First, the study involved a small number of patients. Spinal deformity, particularly LDK, is not a common disease. Enrolling many patients in a single-center retrospective study is difficult. Second, most patients with ADSD have neurological symptoms such as leg pain caused by lumbar disc herniation and lumbar stenosis, which influence sagittal spinal alignments. To avoid those influences, this study excluded ADSD cases with neurological symptoms or obvious coronal spinal deformity with a Cobb angle of >30°. The exclusion criteria make the samples even less. Finally, the study only points out the high risk of postoperative PJK in LDK but does not provide a strategy to prevent it, which is the hardest part and needs further investigation.
Conclusions
ES atrophy, besides the MF, is an important predictor in distinguishing decompensated LDK from well-compensated ones. It plays an important role in compensatory mechanism, not only correlates with global sagittal imbalance but also ties to PJK after deformity corrective surgery. Loss of distal lumbar lordosis would cause severe global sagittal imbalance. Accordingly, deformity corrective surgery should focus on restoring an ideal DLL.
Acknowledgments
The authors thank the Department of Imaging in Shandong Provincial Hospital Affiliated to Shandong First Medical University for providing the image data.
Notes
Conflict of Interest
No potential conflict of interest relevant to this article was reported.
Author Contributions
GW and PL did the data collection and wrote the article. YL and CZ finished the measurement and analysis. JS did the critical revision. All authors read and approved the final manuscript.
Funding
This article receives funding from the Natural Science Foundation of Shandong Province (Award No., ZR2020QH264), Clinical Medical Science and Technology Innovation Plan of Jinan (Award No., 202019202), Shanghai Natural Science Foundation (No., 21ZR1459500), Municipal Commission of Health and Family Planning Foundation of Shanghai (No., 202140413), Medical Health Science and Technology Innovation Plan of Jinan (No., 202019182), science and technology innovation project of Medical staff in Shandong Province, and Natural Science Foundation of Shandong Province (No., ZR2020QH264).