Relationship between Treatment Choices according to the Modified Osteoporotic Fracture Score and Posttreatment Radiographic Outcomes
Article information

Abstract
Study Design
Retrospective observational study.
Purpose
To evaluate the mOF scores in three treatment groups and compare imaging findings in patients treated and not treated according to the mOF score-based treatment recommendation.
Overview of Literature
The osteoporotic fracture (OF) score was established by the AO Spine to guide therapeutic decisions. To enhance its applicability, a modified OF (mOF) score was recently introduced.
Methods
Consecutive patients diagnosed with OFs at Fujieda Heisei Memorial Hospital were divided into three groups: nonsurgical therapy, balloon kyphoplasty (BKP), and open surgery groups. The mOF score was calculated, and the levels of independence and posttreatment imaging data were compared between patients treated and not treated according to the mOF score-based treatment recommendation.
Results
In total, 118 patients were included (nonsurgical therapy, n=57; BKP, n=48; open surgery, n=13), of whom 100 (85%) received treatment consistent with the mOF score-based treatment recommendation. In the BKP and open surgery groups, the mOF score-based treatment recommendations were consistent with the actual treatment in 93% of the patients. However, in the nonsurgical group, the mOF score-based treatment recommendation was not consistent with the actual treatment in 25% of the patients. In this group, patients not treated according to the mOF score had significantly shorter vertebral body height, greater local kyphosis, and smaller sacral slope after treatment than patients treated according to the mOF score-based treatment recommendation.
Conclusions
In the BKP and open surgery groups, the mOF scores were consistent with actual clinical selection. In the nonsurgical therapy group, patients not treated according to the mOF score-based treatment recommendation exhibited severe vertebral body deformity and a less well-balanced spine shape after treatment. The mOF score may help in selecting suitable treatments for OFs.
Introduction
The economic cost and prevalence of osteoporosis are important issues driven by the aging of the general population [1,2]. Moreover, osteoporotic vertebral fractures are a significant cause of morbidity and mortality [3]. Despite the widely used classifications and criteria of treatment recommendations for traumatic vertebral fractures [4,5], no commonly accepted classification has been established.
The Osteoporotic Fracture Working Group (the Spine Section of the German Society of Orthopaedics and Trauma [DGOU]) proposed a new classification for osteoporotic vertebral fractures [6,7]. An osteoporotic fracture (OF) classification-based score for therapeutic decision-making (OF score) has also been developed [6,8]. The clinical validity of the OF score was assessed in the Evaluation of the Osteoporotic Fracture Classification, Treatment Score and Therapy Recommendations study, and treatment according to the OF score-based recommendations was suggested to lead to favorable clinical results [9]. However, the score was further adjusted to increase its compliance. Therefore, a new score for therapeutic decision-making in patients with OF, namely, the modified OF (mOF) score, was established by AO Spine [10].
To assess the clinical utility of the mOF score, the concordance between mOF score-based treatment recommendations and actual treatment decisions among patients receiving nonsurgical therapy, balloon kyphoplasty (BKP), and open surgery was analyzed retrospectively. In addition, pretreatment and posttreatment imaging findings were evaluated in patients treated and not treated according to the mOF score-based treatment recommendations. Moreover, the independence level of the patients in each group after treatment was also assessed.
Materials and Methods
1. Study design
All consecutive patients diagnosed with a new osteoporotic vertebral compression fracture at Fujieda Heisei Memorial Hospital between January 2018 and December 2022 were included in this single center, retrospective, observational study. Osteoporotic vertebral compression fractures were diagnosed using the 2015 Japanese Society for Bone and Mineral Metabolism criteria [11]. Accordingly, osteoporosis was confirmed when patients met the following criteria: (1) fragility fracture in the proximal femur or vertebral body, (2) other fragility fractures with a young adult mean (YAM) of <80%, or (3) YAM of ≤70%, or the T-score was ≤−2.5. However, the proponents of the mOF score suggested its use for patients only with a T-score <−2.5 [10]. This agrees with the World Health Organization definition, which classifies scores between −1 and −2.5 as osteopenia and scores below −2.5 as osteoporosis. Thus, patients with a T-score >−2.5 were excluded from this study. Patients with simultaneous multiple fractures, tumors, and high-energy trauma were also excluded.
The included patients were divided into three groups according to the treatment received: nonsurgical therapy, BKP, and open surgery. Nonsurgical treatment involved the use of orthoses. At Fujieda Heisei Memorial Hospital, BKP was indicated for patients with persistent pain or reduced daily activities after 4–6 weeks of nonsurgical treatment. Open surgery was performed in patients with neurological issues or significant instability from vertebral fractures. Both BKP and open surgery were performed under general anesthesia.
This study was conducted in compliance with the principles of the Declaration of Helsinki. The study protocol was reviewed and approved by the institutional review board of Fujieda Heisei Memorial Hospital (FHR 2023-1). All study participants provided written informed consent.
2. Overview of OF classification and mOF score
Tables 1 and 2 present an overview of the OF classification and mOF score [6,7,10]. The mOF score has adapted parameters from the original OF score, with distinct cutoff values for the Visual Analog Scale (VAS) score and health status parameters (VAS score ≥5/<5, health status including American Society of Anesthesiologists [ASA], modified frailty index, and anticoagulation) in contrast to the OF score’s parameters (VAS score ≥4/<4, health status including ASA, body mass index, nursing care, and anticoagulation). Deformity progression was defined as the progression of kyphotic or scoliotic curves by at least 10° on consecutive radiographs. The presence of neurological symptoms was classified into six groups (N0–4, NX) according to the thoracolumbar classification system by AO Spine [4]. Nonsurgical, surgical or nonsurgical, and surgical treatments were recommended for patients with mOF scores of 0–5, 6, and ≥7 points, respectively. Decision-making based on mOF scores in the two cases is shown in Fig. 1.
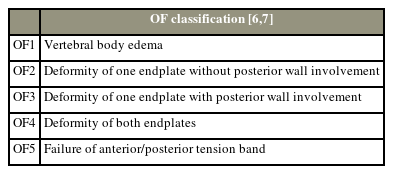
OF classification

Modified OF score
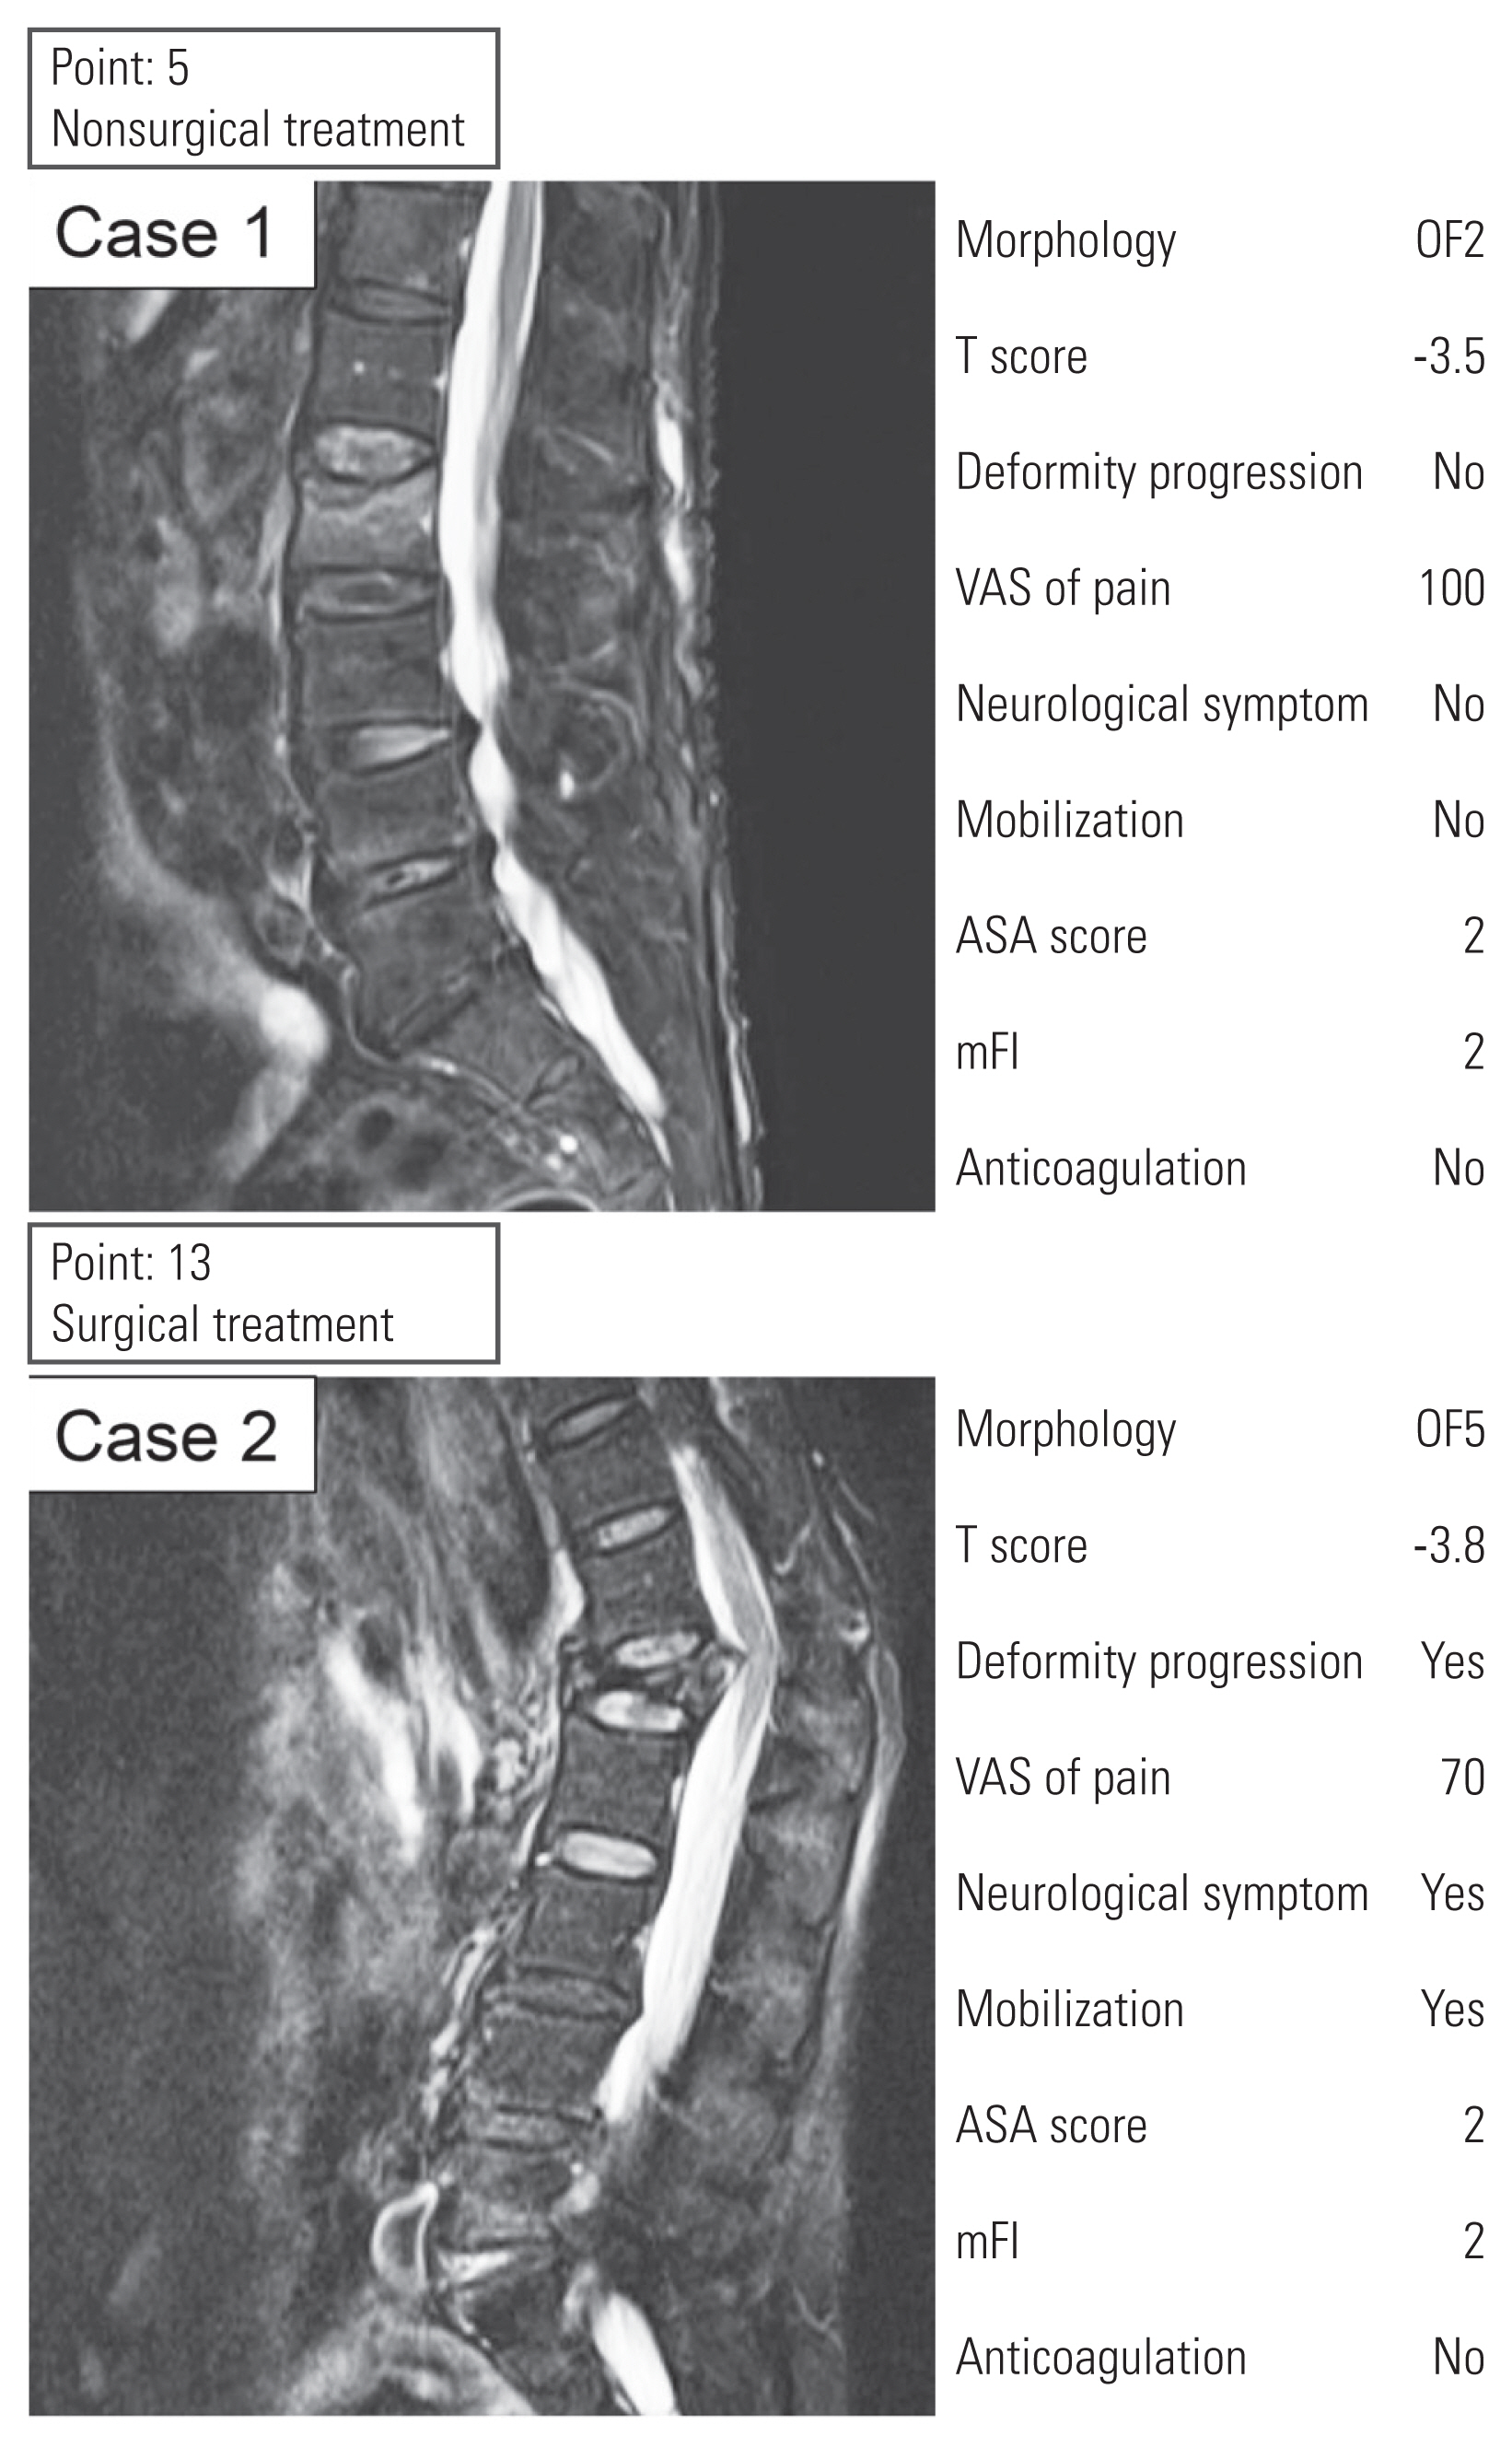
Application of modified osteoporotic fracture (OF) score in two cases. VAS, Visual Analog Scale; ASA, American Society of Anesthesiologists; mFI, modified frailty index.
3. Evaluation of parameters
Pretreatment magnetic resonance imaging findings were classified based on the OF classification, and the mOF score was calculated based on patient background. The use of antiosteoporotic medications was investigated both before and after fractures. These medications included bisphosphonates, parathyroid hormone, antireceptor activators of nuclear factor-kappa B ligand antibody, selective estrogen receptor modulators, activated vitamin D3, and vitamin K2. Pretreatment and posttreatment imaging findings were compared between patients treated or not treated according to the mOF score-based treatment recommendation. Because nearly all patients (57 of 61 [93%]) in the BKP and open surgery groups were treated consistently with decision-making based on the mOF score, the imaging findings of nonsurgically treated patients were analyzed. Patients who received nonsurgical treatment were divided into two groups: those with an mOF score above the threshold for surgical recommendations (≥7 points) and those with an mOF score below the threshold (≤6 points). In each group, pretreatment and posttreatment plain radiographic parameters were evaluated.
Posttreatment plain radiographs were obtained 6–24 months after the pretreatment image was taken. The relative height of the fractured vertebra to the mean height of the nearest unfractured vertebrae proximally and distally was evaluated [12]. The relative vertebral body height (VBH) was calculated for the anterior (AVBH), middle (MBVH), and posterior portions of the fractured vertebra. The angle of the superior and inferior endplates of the fractured vertebra, that is, the local kyphotic angle (LKA) [12], was measured. Lumbar lordosis of L1–L5 and the sacral slope (SS) were also evaluated as radiographic parameters of the sagittal balance of the spine.
The level of independent living in patients 6 months after treatment was assessed as a key clinical outcome measure. Patients were divided into five groups according to a previous report on independent living 1 year after BKP [13]: group A, patients who can go outdoors by themselves; group B, patients who needed assistance to go outdoors; group C, patients who needed assistance indoors; group D, patients who had unknown outcome; and group E, patients who had died. According to a previous study [13], groups A and B were considered to demonstrate good outcomes, whereas groups C–E indicated poor outcomes. Patient independence was evaluated across the three treatment groups: nonsurgical therapy, BKP, and open surgery. In the nonsurgical group, patients were further delineated as those treated in accordance with the mOF score-based treatment recommendations (≤6 points) and those treated not in accordance with such recommendations (≥7 points).
4. Statistical analysis
Patient characteristics are presented as mean±standard deviation. Baseline characteristics and mOF scores were compared between the three groups using the one-way analysis of variance for each parameter. The chi-square test with Bonferroni correction was applied to the antiosteoporotic medication data. Paired t-tests were performed to examine the differences in pre- and posttreatment radiographic parameters between patients treated and not treated according to mOF score-based treatment recommendations. Hypothesis testing for differences in population proportions was performed to assess disparities in the levels of posttreatment independence. All statistical analyses were performed using R software for Windows ver. 4.3.0 (R Foundation for Statistical Computing, Vienna, Austria). All reported p-values were two-sided, and p-value ≤0.05 was considered significant.
Results
In total, 487 consecutive patients were diagnosed with a new OF at Fujieda Heisei Memorial Hospital between January 2018 and December 2022. Moreover, 337 patients underwent nonsurgical therapy, 96 underwent BKP, and 52 underwent open surgery. A total of 118 patients underwent further analysis according to the inclusion criteria (Fig. 2). Finally, 57 patients in the nonsurgical group, 48 in the BKP group, and 13 in the open surgery group were evaluated. The open surgery group underwent fixation surgery with or without vertebroplasty, except for one patient who only underwent decompression surgery. The baseline characteristics of the study population are shown in Table 3. The use of antiosteoporotic drugs before fracture and the modified frailty index showed significant differences across the three groups. Notably, the difference in antiosteoporotic drug use between the nonsurgical and BKP groups was significant (p=0.006). The use of antiosteoporotic medication after the fracture was high in all three groups.
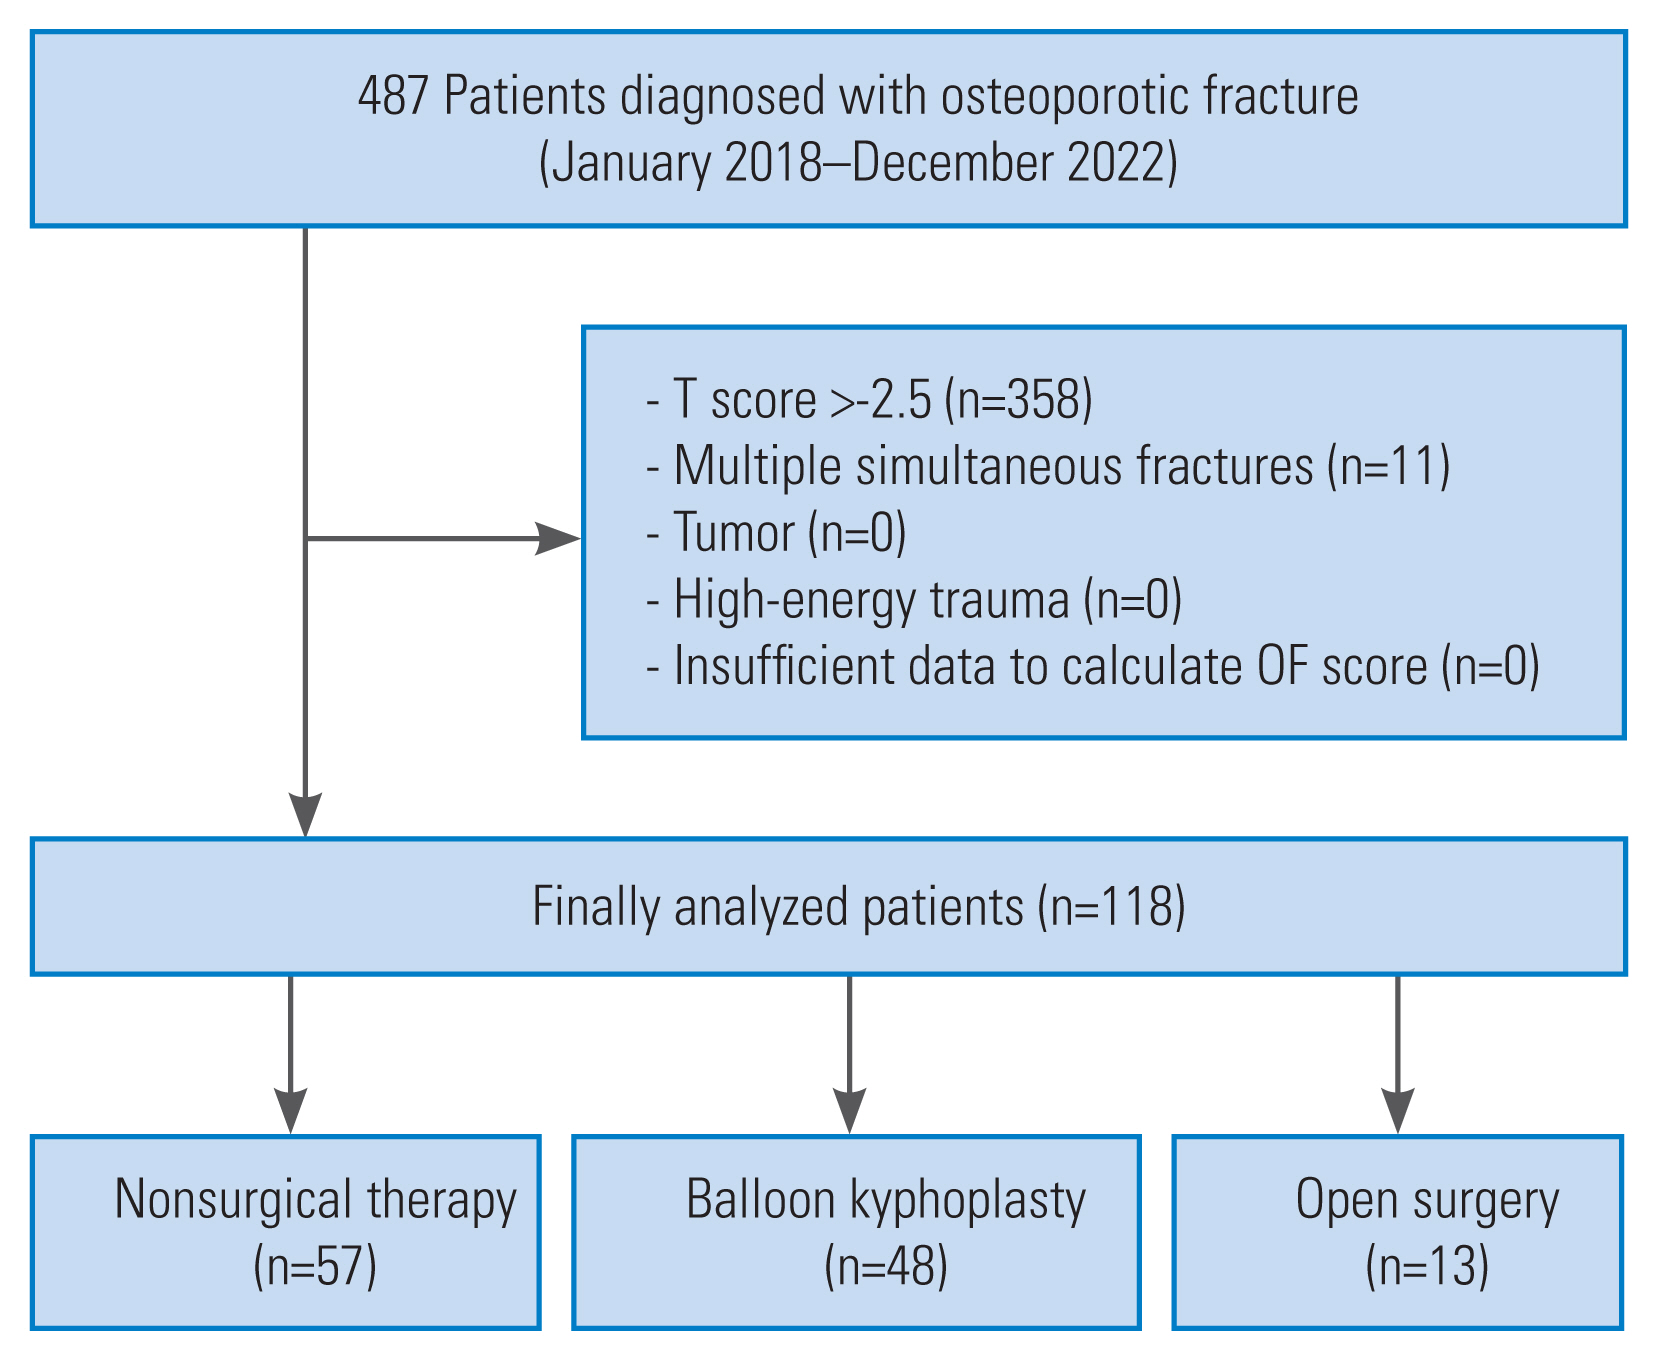
Study flowchart. OF, osteoporotic fracture.
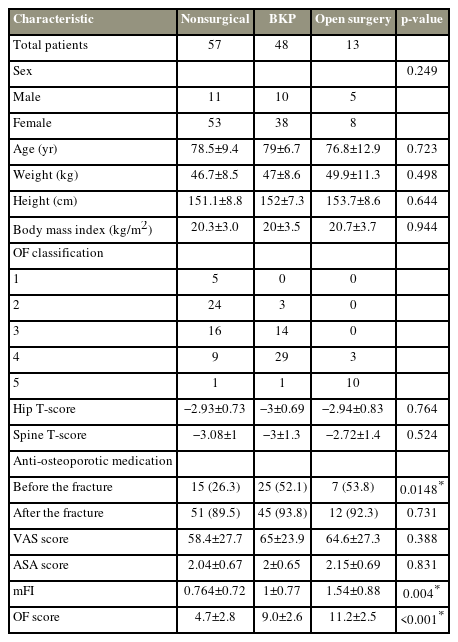
Baseline characteristics of the study population
In 100 of 118 patients, the treatment was consistent with the mOF score-based treatment recommendation. Significant differences were found in the scores among patients in the nonsurgical, BKP, and open surgery groups (nonsurgical therapy, 4.7±2.8; BKP, 9.0±2.6; open surgery, 11.2±2.5; p<0.0001) (Fig. 3A). In 14 of 57 patients (Fig. 3B), the mOF scores for the nonsurgical group were above the threshold for surgery recommendation (≥7 points). Of these 14 patients, seven did not wish to undergo surgery, and three did not undergo surgery because of serious general complications. In the BKP group, only four of 48 patients were recommended to undergo nonsurgical treatment according to the mOF scores (Fig. 3C). In the open surgery group, treatment selection was consistent with the mOF score-based treatment recommendations in all patients (Fig. 3D). When 6.5 was used as the cutoff for surgical recommendation, the sensitivity and specificity of the mOF score were 82% (95% confidence interval, 0.74–0.88) and 75% (95% confidence interval, 0.67–0.82), respectively.
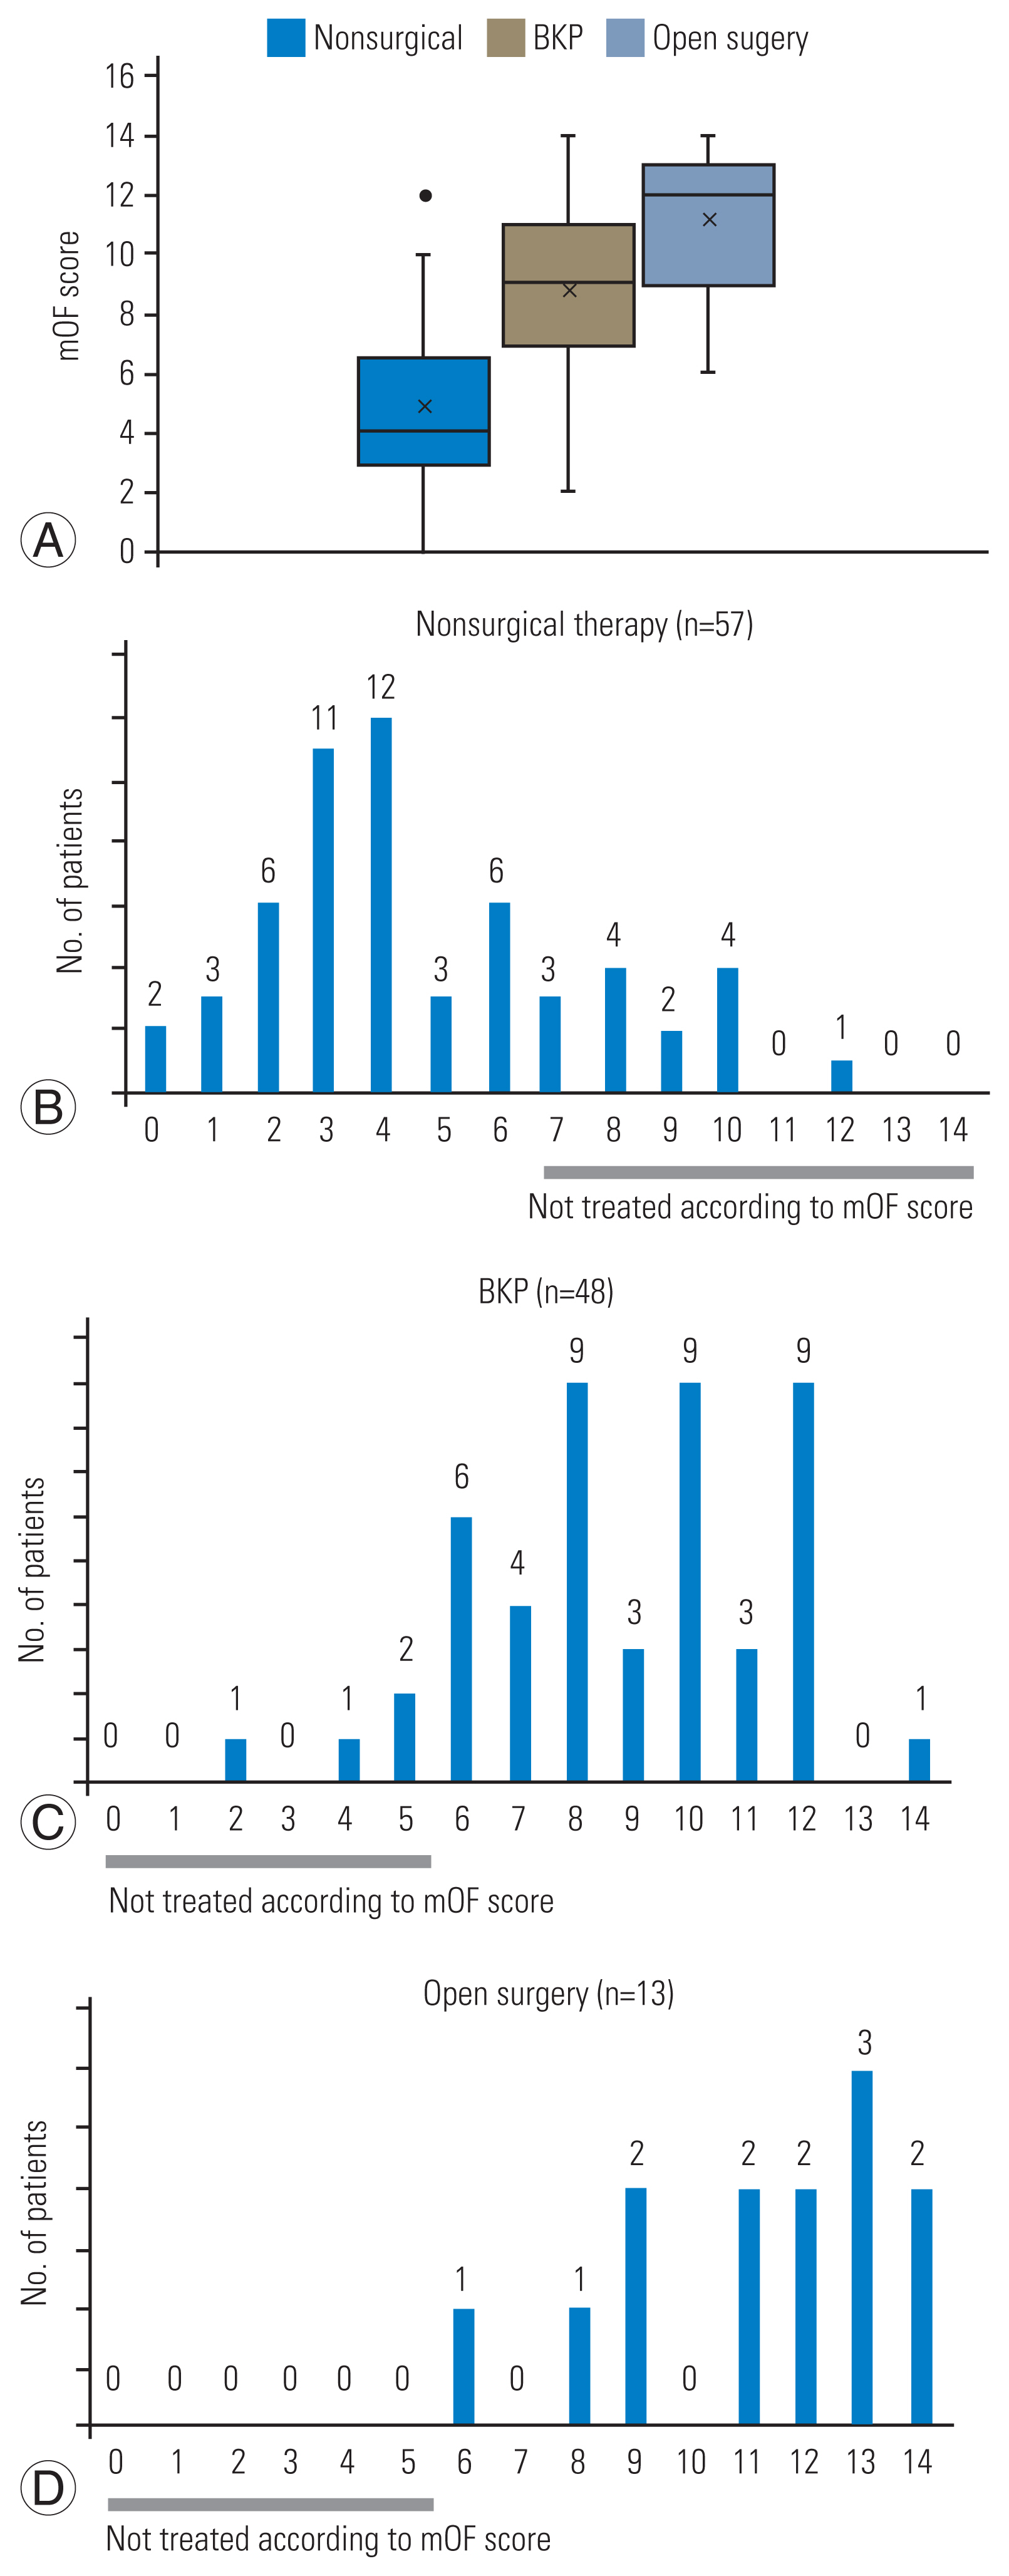
Distribution of cases based on modified osteoporotic fracture (mOF) score. (A) The mOF score value in each treatment group. The distribution of mOF score in nonsurgical therapy group (B), in balloon kyphoplasty (BKP) group (C), and in open surgery group (D).
Then, pretreatment and posttreatment radiographic parameters were compared in patients in the nonsurgical group. On pretreatment plain radiography, patients not treated according to the mOF score-based treatment recommendations (≥7 points) had significantly higher AVBH, MVBH, and LKA than patients with scores below the threshold (p<0.001) (Table 4). Other radiographic parameters were not different in the pretreatment study. Posttreatment image findings also showed that AVBH, MVBH, and LKA were significantly greater in patients not treated according to the mOF score-based treatment recommendation (p<0.001) (Table 4); however, a significant difference in SS was noted (p<0.001). An overview of the posttreatment radiographic parameters is shown in Fig. 4.

Radiographic outcomes in patients treated non-surgically
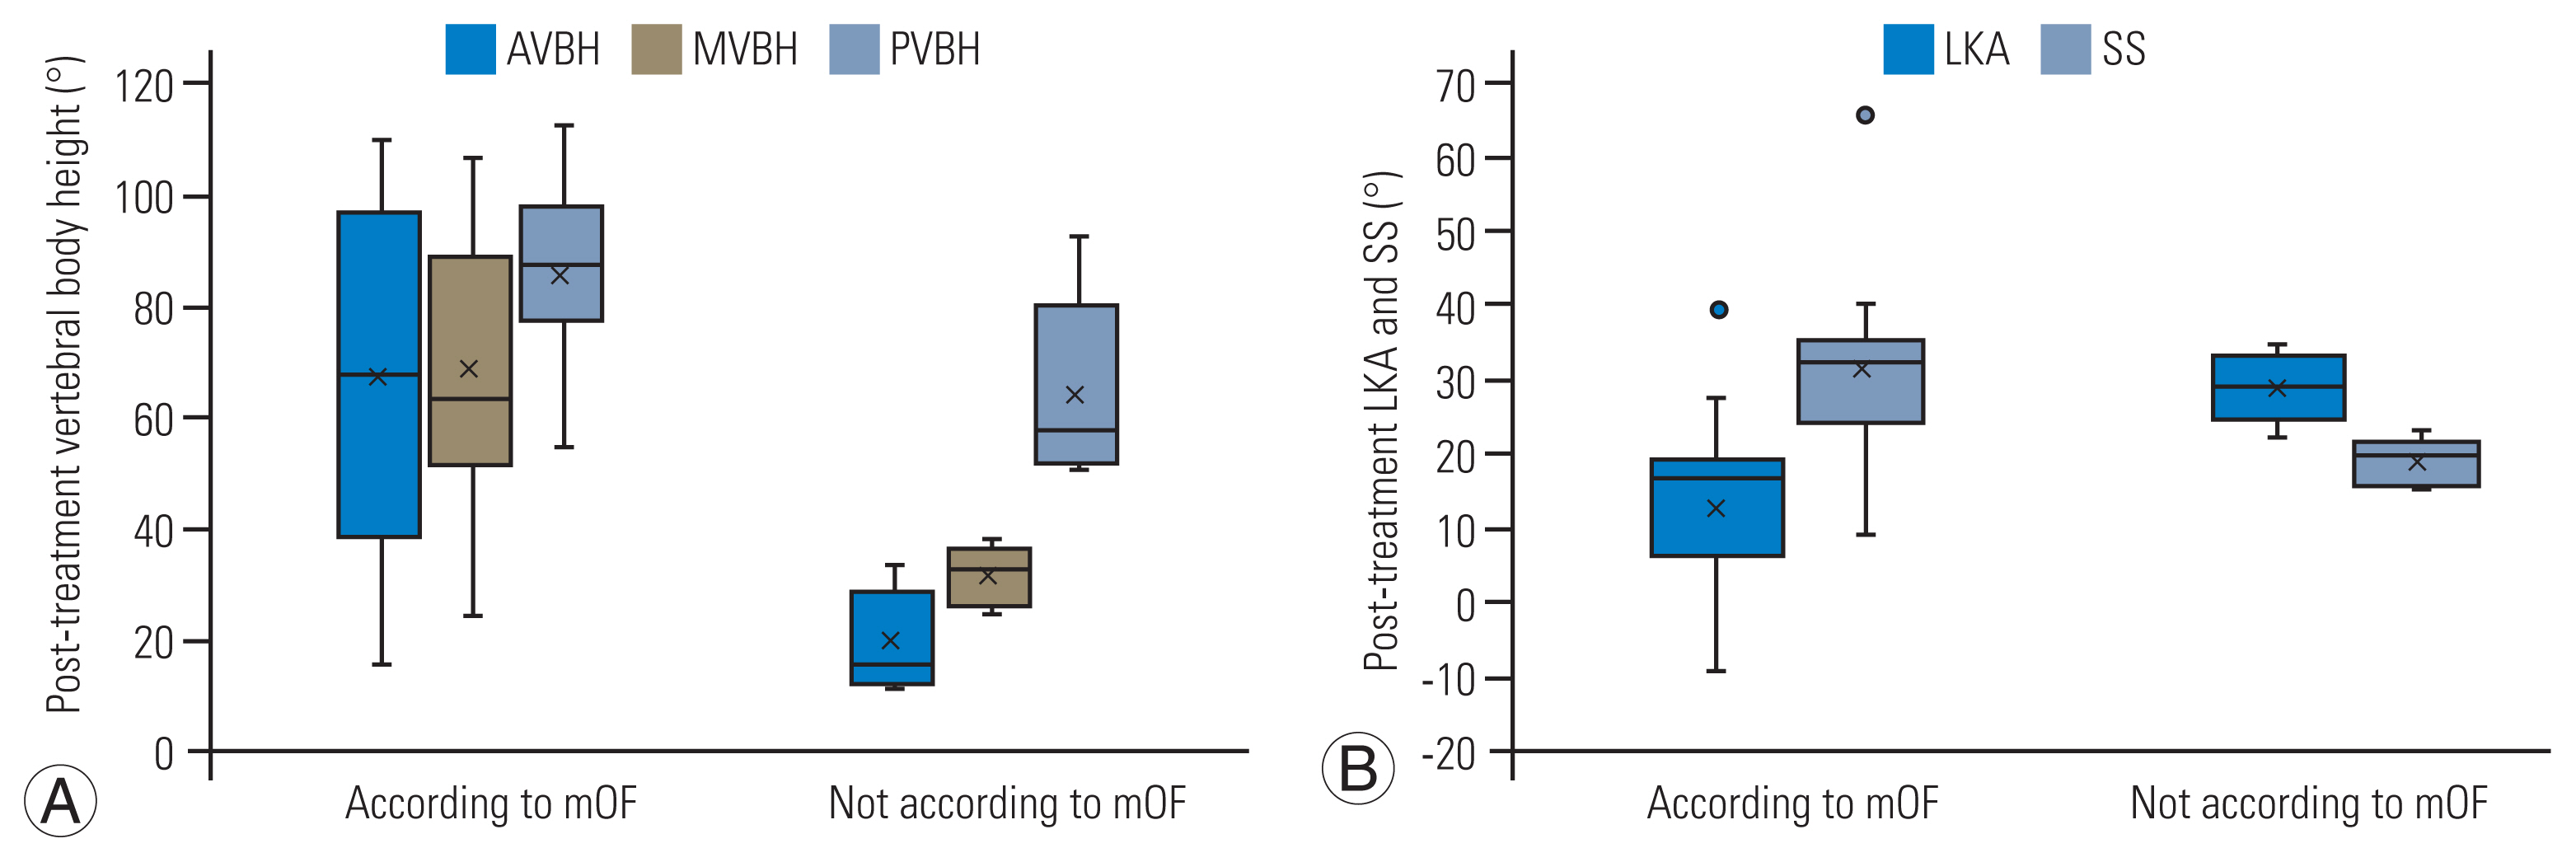
(A, B) Overview of post-treatment radiographic parameters. AVBH, vertebral body height in the anterior portion; MVBH, vertebral body height in the middle portion; PVBH, vertebral body height in the posterior portion; mOF, modified osteoporotic fracture; LKA, local kyphotic angle; SS, sacral slope.
The levels of independence 6 months after treatment in the three treatment groups are presented in Fig. 5. Approximately 80% of patients were categorized into the good clinical outcome group (groups A and B) across all treatment modalities (nonsurgical therapy, 79%; BKP, 79%; and open surgery, 85%). In the nonsurgical group, 85% of the patients treated in accordance with the mOF score-based treatment recommendation were categorized into the good clinical outcome group, whereas only 69% of the patients not treated in accordance with the mOF score-based treatment recommendation achieved a good clinical outcome. However, no significant difference was found between the two groups (p=0.194).
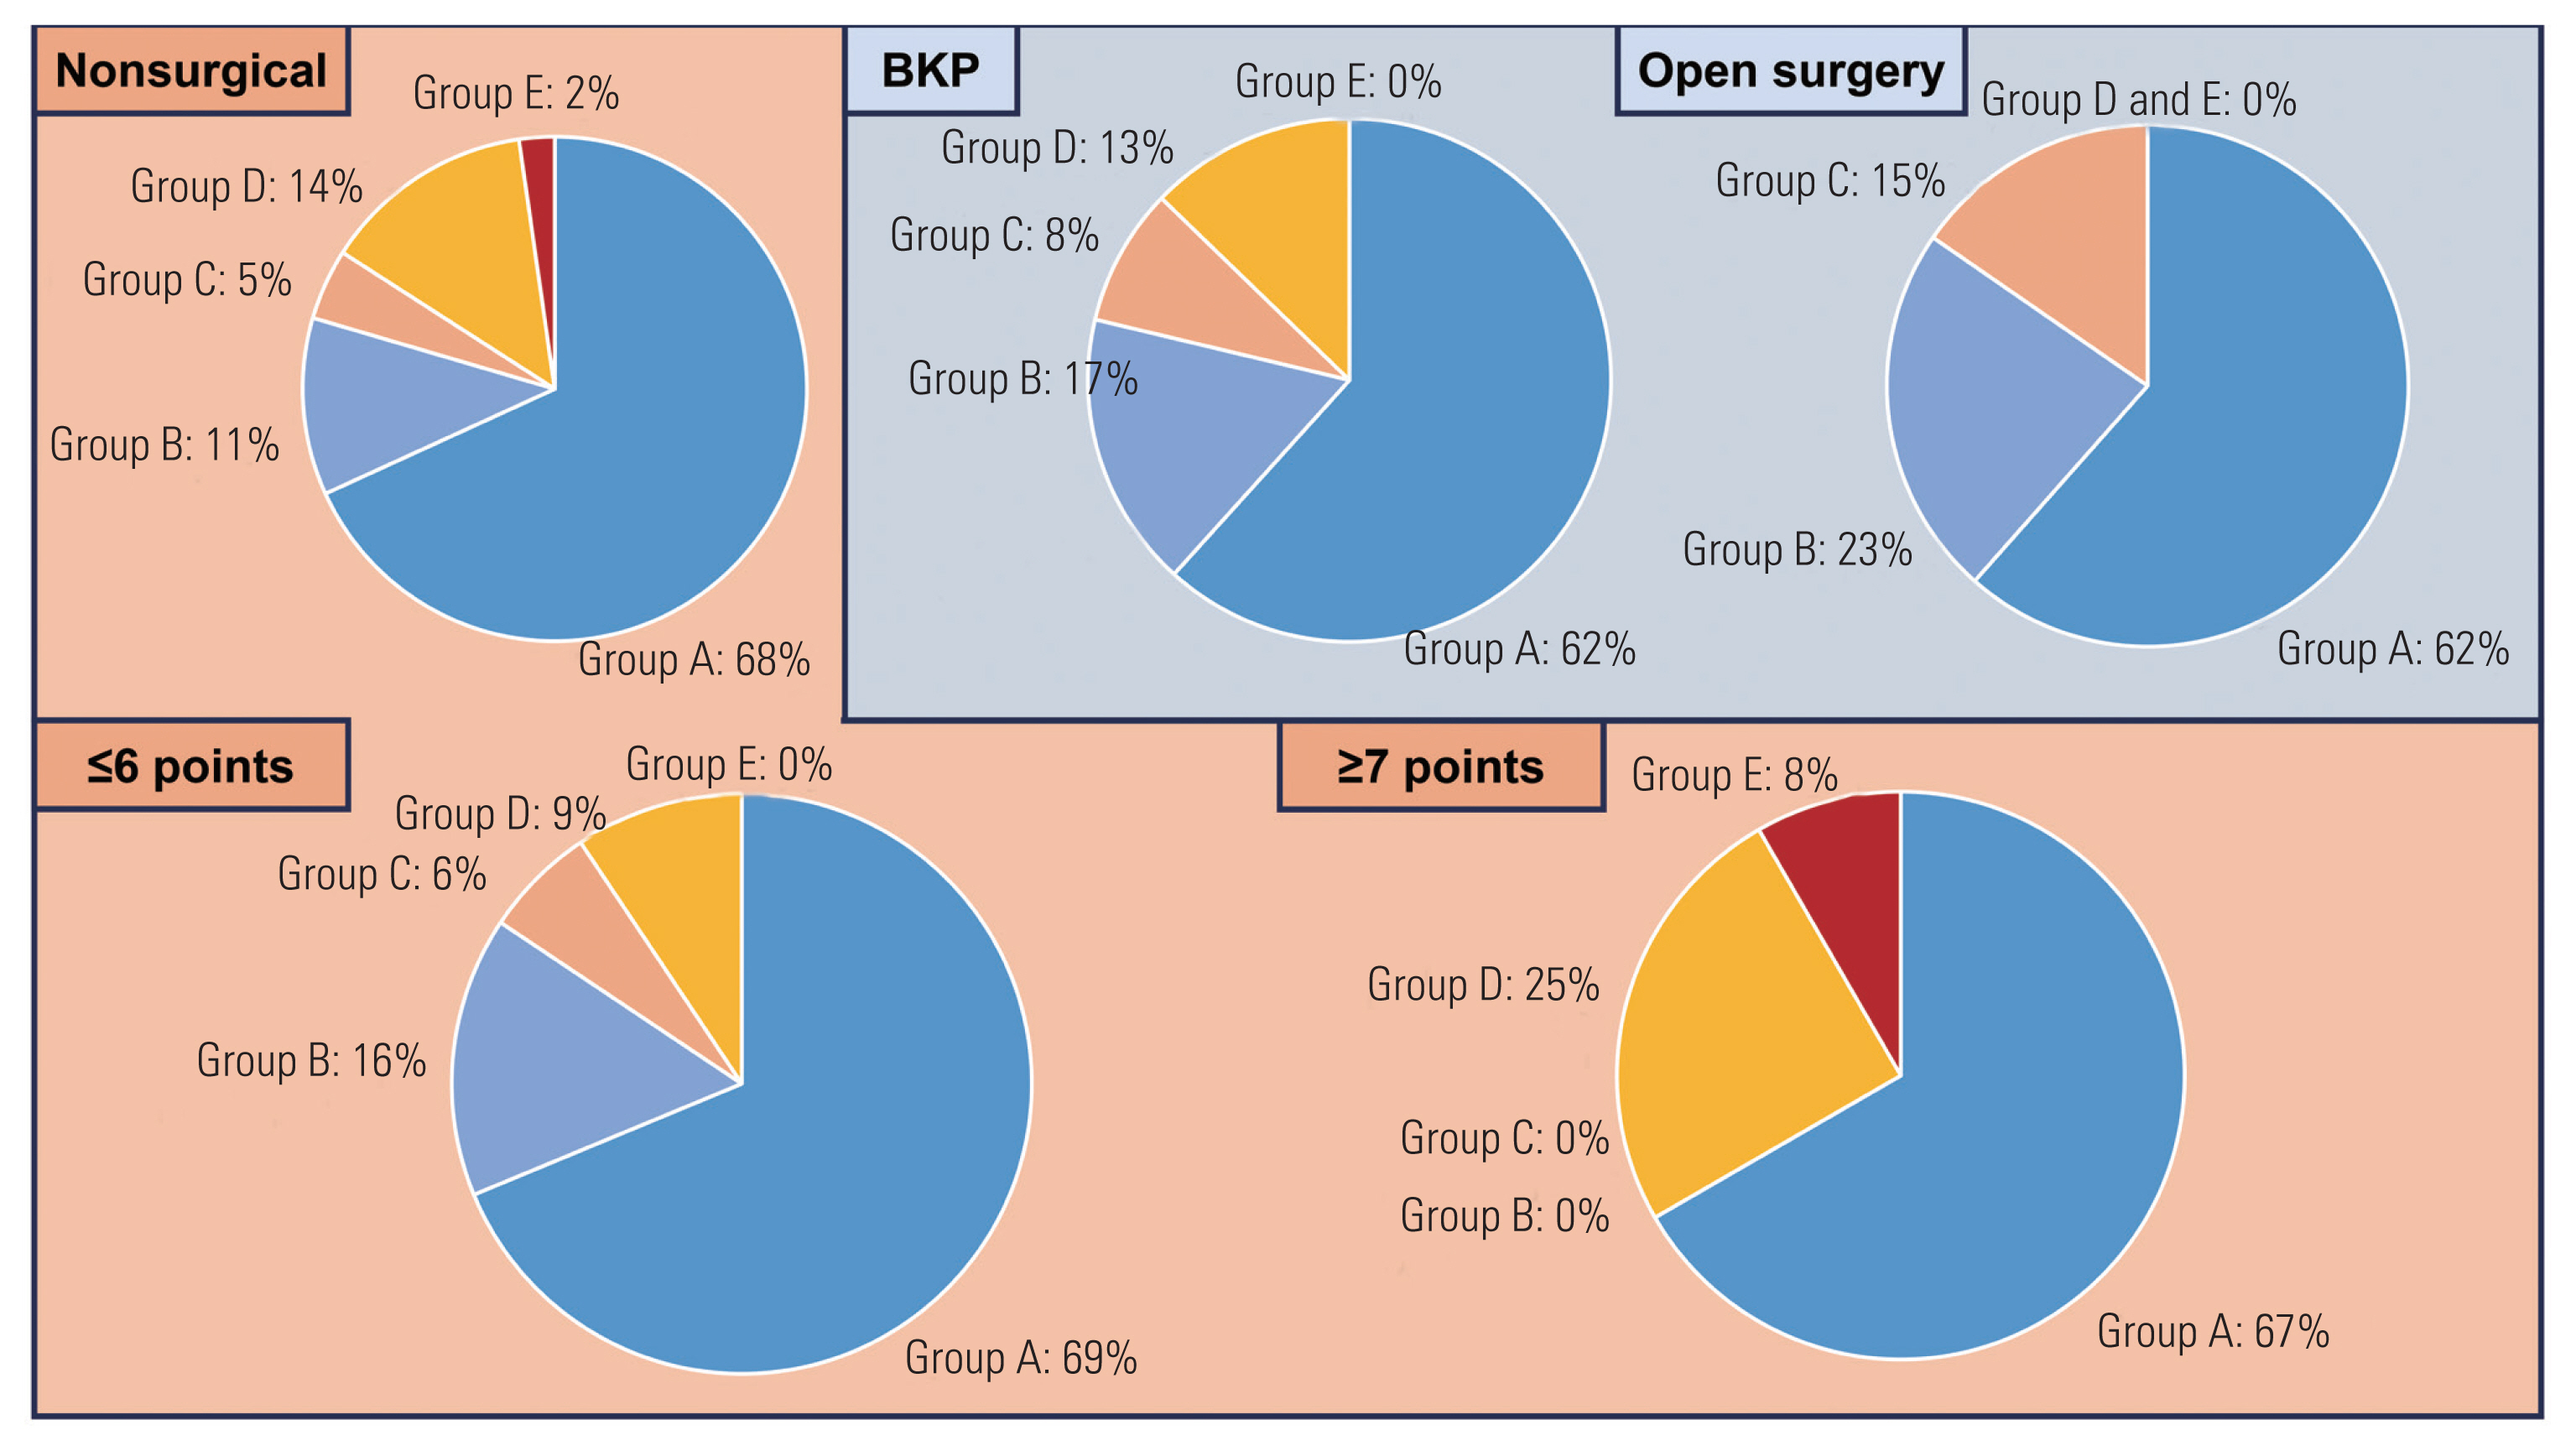
Levels of patient independence at 6 months post-treatment. Upper row: patients in nonsurgical therapy, balloon kyphoplasty (BKP), and, open surgery groups. Lower row: patients in two nonsurgical therapy subgroups treated in accordance with modified osteoporotic fracture (mOF) score recommendations (≤6 points) and treated not in accordance with mOF score recommendations (≥7 points).
Discussion
In this study, a significant difference was found in the mOF scores among the three groups, including between the BKP and open surgery groups. This suggests that the mOF score mirrors the invasiveness of the treatment and may indicate the type of surgical intervention required. In a previous study, 75% of the patients received treatment consistent with the OF score-based recommendation [9], whereas 100 of 118 patients (85%) in the present study received treatment consistent with the mOF score-based treatment recommendation. This suggests that the mOF score has higher compliance than the OF score.
In total, 57 of 61 patients (93%) in the BKP and open surgery groups were treated consistently with the mOF score-based decision. In contrast, in 14 of 57 patients who underwent nonsurgical therapy, the actual treatment choice did not match the mOF score-based decision. In the nonsurgical therapy group, patients with treatment choices inconsistent with the mOF score had smaller pretreatment and posttreatment VBH and larger LKA. The posttreatment results suggest that treatment inconsistent with the mOF score-based treatment recommendation leads to greater vertebral body deformity. Furthermore, patients with treatment choices inconsistent with the mOF score-based treatment recommendation had a smaller SS after treatment. The SS reflects the sagittal balance of the spine, and the shape of the thoracolumbar spine can be classified into three types based on the SS according to a previous report [14]: a low SS (<35°) is classified as types 1 and 2, a medium SS (35°–45°) as type 3, and a high SS (>45°) as type 4. Type 3 is the most balanced type, whereas the other types are related to thoracolumbar spine deformation. According to that study, patients treated consistent with the mOF score-based treatment recommendation in the present study were classified as having type 1, 2, or 3 based on the mean and standard deviation of the SS. In contrast, all patients treated inconsistently with the mOF score-based treatment recommendations were classified as having type 1 or 2. This result indicates that patients who received treatment inconsistent with the mOF score-based treatment recommendations had a less well-balanced spine shape than those who received treatment consistent with such recommendations. Thus, our results indicate that treatment selection inconsistent with the mOF score-based treatment recommendations may lead to greater deformity of not only a single vertebra but also of the sagittal balance of the entire spine after treatment.
Moreover, the level of patient independence 6 months after treatment was assessed as a measure of clinical outcome. Approximately 80% of the patients were categorized as having a good clinical outcome, in accordance with a previous report on posttreatment independence after BKP (81%) [13]. This concordance validates the appropriateness of the treatments in the present study compared with the existing literature. In the nonsurgical group, a higher number of patients treated consistent with the mOF score-based treatment recommendations fell into the good clinical outcome category compared with those who were not treated based on these recommendations. However, a significant difference could not be established between the two groups. This lack of significance may be attributed to the limited number of patients with an mOF score of ≥7 points.
This study had several limitations. First, differences between the Japanese osteoporosis diagnostic criteria and the OF score criteria led to the exclusion of many patients. This is because the Japanese guidelines diagnose osteoporosis based on fragility fractures without relying solely on T-scores.
Second, clinical outcome evaluations were based solely on levels of independence 6 months after treatment. Incorporating commonly used patient satisfaction scales, such as the VAS, would provide a more comprehensive assessment. In our evaluation of independence, group D was designated as an indicator of poor outcome based on the developer’s perspective. However, group D is a heterogeneous category potentially encompassing groups A–E, and the overrepresentation of patients in group D might confound the accurate interpretation of treatment outcomes.
Lastly, selection bias was present because of insurance constraints in Japan, which mandate that BKP be performed under general anesthesia. This could exclude patients at a high risk of anesthesia complications. A large-scale prospective study of the mOF score is expected as the next step.
Conclusions
The mOF score may be associated with higher compliance than the OF score. Nearly all patients in the BKP and open surgery groups received treatment consistent with mOF score-based selection, whereas patients in the nonsurgical therapy group who received treatment inconsistent with the mOF score-based treatment recommendation had a greater deformity of the affected vertebrae and a less well-balanced shape of the thoracolumbar spine after treatment. These results suggest that the mOF score is a valid tool for use in clinical practice.
Acknowledgments
We thank Edanz (https://jp.edanz.com/ac) for improving English of this manuscript.
Notes
Conflict of Interest
No potential conflict of interest relevant to this article was reported.
Author Contributions
Conception and design: ST, TT; data acquisition: ST, KM; analysis of data: ST; drafting of the manuscript: ST, TT; critical revision: TT, TI, RK, MM, IS, SN, JH; administrative support: TT; supervision: TT, JH; and final approval of the manuscript: all authors.