


Introduction
In the elderly, spine fractures are often triggered by a minor fall or an unknown trauma and are associated with osteoporosis [1]. Patients with diffuse idiopathic skeletal hyperostosis (DISH) have an increased incidence of fractures with age and grow bone bridges [2]. DISH occurs in >10% of patients aged >50 years [3,4]. In DISH, the length of the lever arm created by bony bridging between adjacent vertebrae is a risk factor for spine fractures, classified as type B3 according to the new Association of Osteosynthesis (AO) Spine Thoracolumbar Injury Classification System [5–8]. The complex interplay between bone density and bridging makes it challenging to understand the fracture mechanics of DISH; lower bone density and longer lever arms increase the risk of fractures. Previously, we devised an index for the maximum number of vertebral bodies with bony bridges between adjacent vertebrae without interruption (maxVB) to measure the lever arms [9]; it captures not only the length of the lever arm but also, to some extent, bone density and bone metabolism markers [10,11]. A definition by Resnick et al. [12] of DISH as a bony bridge spanning four vertebrae is widely used. Nevertheless, the larger the maxVB in DISH-associated spine fractures, the longer the lever arm and the higher the risk of spine fractures; thus, the maxVB index can be used to elucidate bony cross-link–associated spine fractures [9].
This study was designed to investigate the impact of bone bridging on fracture mechanisms and surgical outcomes in vertebral fractures using the maxVB index.
Materials and Methods
2. Participants
At Murayama Medical Center and Shizuoka City Shimizu Hospital, 315 patients underwent surgery for thoracic to lumbar spine fractures from 2010 to 2020. Of them, 260 patients aged >60 years who underwent computed tomography (CT) scans (Discovery CT750 HD; GE Healthcare, Chicago, IL, USA) of the thoracic to lumbar spines were included. We enrolled 242 patients, excluding those with a history of thoracic to lumbar fusion before the vertebral fractures and those who underwent corrective fusion owing to kyphosis (i.e., when fractures fuse but are crushed, resulting in localized kyphotic deformity and ongoing back pain, etc.) after the vertebral fractures. As a sub-analysis, we investigated the surgical outcomes in 146 patients with spine fractures of the thoracolumbar transition region who could be followed up for ≥6 months postoperatively. This study was conducted according to the principles of the Declaration of Helsinki. The study’s protocol was reviewed and approved by the Institutional review Board of Murayama Medical Center (IRB approval no., 20–10) and Shizuoka City Shimizu Hospital, and written informed consent was obtained from all patients.
3. Variables
We examined the number of cases, distribution of bone bridging, age at injury, sex, situations arising due to injury, neurological symptoms, fracture morphology, fracture level, and maxVB for all participants. The starting point of injury was selected from (1) unknown, (2) getting up, (3) tumbling, (4) falling, (5) traffic accident, and (6) others. Fracture morphology was classified using the AO Spine Thoracolumbar Injury Classification System [13]. Fracture levels were classified as thoracic (T1–T10), thoracolumbar transition (T11–L2), and lumbar (L3–L5). In a previous study examining male patients, the maxVB (0–8) was positively correlated with femoral bone mineral density, with patients in the maxVB (2) group having a higher bone mineral density than those in the maxVB group (0) [10]. Additionally, patients in the maxVB (4–8) group had a higher proximal femur bone density than those in the maxVB (9–18) group [10]. Therefore, the maxVB was measured using CT from the thoracic to lumbar spines and categorized into three groups: no bony bridging, maxVB (0); from 2 to 8, maxVB (2–8); and from 9 to 18, maxVB (9–18). The American Spinal Injury Association (ASIA) impairment scale and AO neurological type (N0, neurology intact; N1, transient neurological deficit; N2, radicular symptoms; N3, incomplete spinal cord injury or any degree of cauda equina injury; and N4; complete spinal cord injury) were used to assess neurological symptoms [13,14]. The number of preoperative neurological deficits was evaluated based on the AO neurological type (N1+N2+N3+N4), and the rate of preoperative neurological deficits was calculated as follows: 100×(N1+N2+N3+N4)/(N0+N1+N2+N3+N4). The surgical techniques selected included balloon kyphoplasty, anterior fusion, posterior fusion, and combined anterior-posterior surgery. Postoperative paralysis was defined as “improved” if there was improvement by at least one ASIA grade after surgery and as “not improved” if the patient had a preoperative ASIA grade of D or lower. The paralysis improvement rate was determined as follows: 100×the number of improved cases/the number of cases of ASIA grades (A+B+C+D).
4. Measurements
We evaluated the values of the items under study in all cases: age at injury, sex, situations arising due to injury, neurological symptoms, preoperative neurological deficits, fracture morphology, fracture level, and maxVB. Subsequently, the distribution of bone bridges was assessed in all cases and in the maxVB (2–8) and maxVB (9–18) groups. Next, comparisons were made among the three groups classified according to their maxVB for the aforementioned items. In the sub-analysis of spine fracture cases in the thoracolumbar transition area, the following parameters were evaluated—age at injury, sex, maxVB, fracture type, operative technique, the number of fixed vertebral segments, operative time, blood loss, the rate of improvement in paralysis, the number and frequency of perioperative complications, new vertebral fractures occurring within 6 months postoperatively, the reoperation rate within 6 months postoperatively, and mortality occurring within 3 months postoperatively—and compared among the aforementioned three groups classified according to their maxVB.
5. Statistical analysis
The number and frequency or median and standard deviation were obtained for all items considered in all cases. We used three-way analysis of variance with Pearson’s chi-square test for two-arm and three-arm comparisons only for items significantly different among the three groups. Twenty-eight cases had missing values for operative time and blood loss. All statistical analyses were performed using IBM SPSS ver. 26.0 (IBM Corp., Armonk, NY, USA) and R ver. 4.0.3 (index of /src/base/R-4; https://www.r-project.org/). p-values of less than 0.05 were used to denote statistical significance.
Results
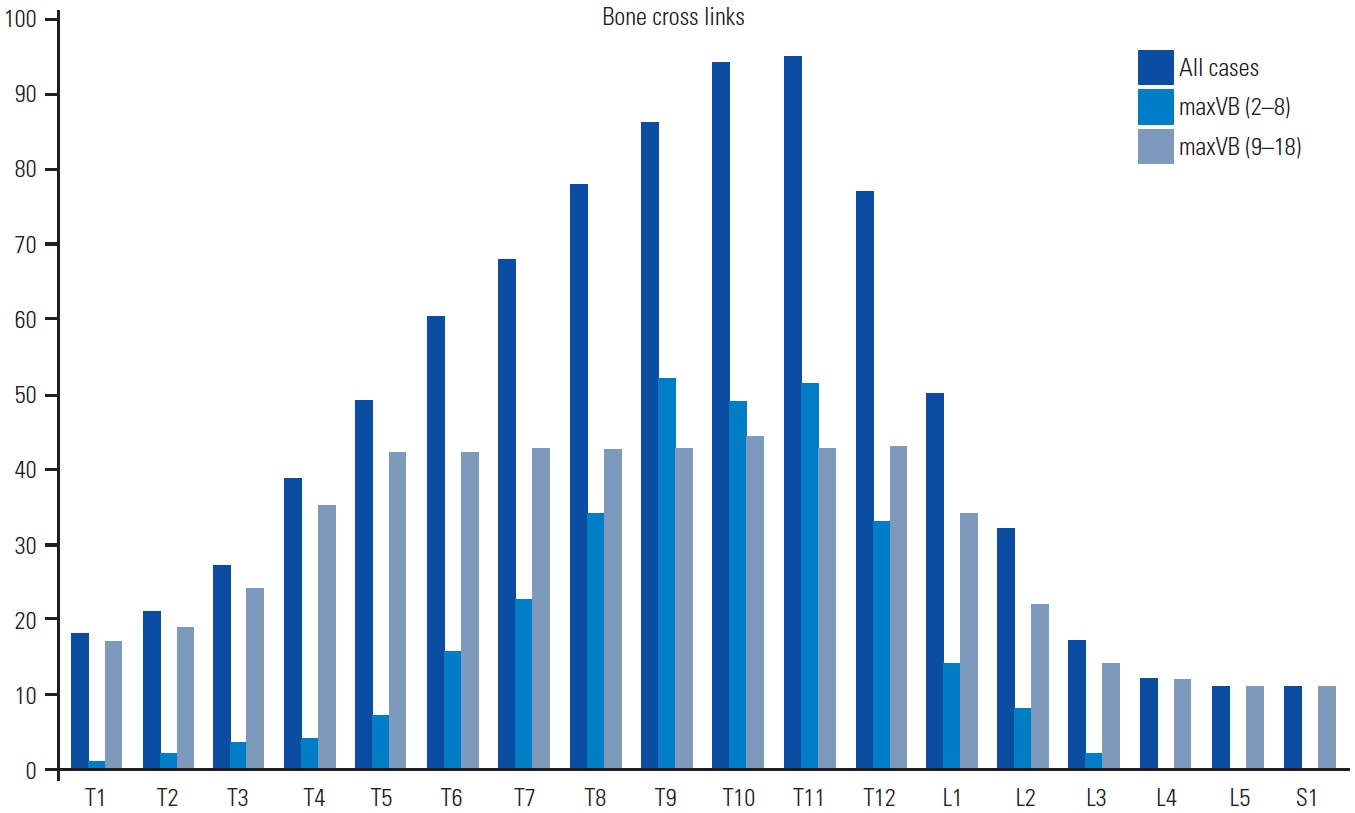
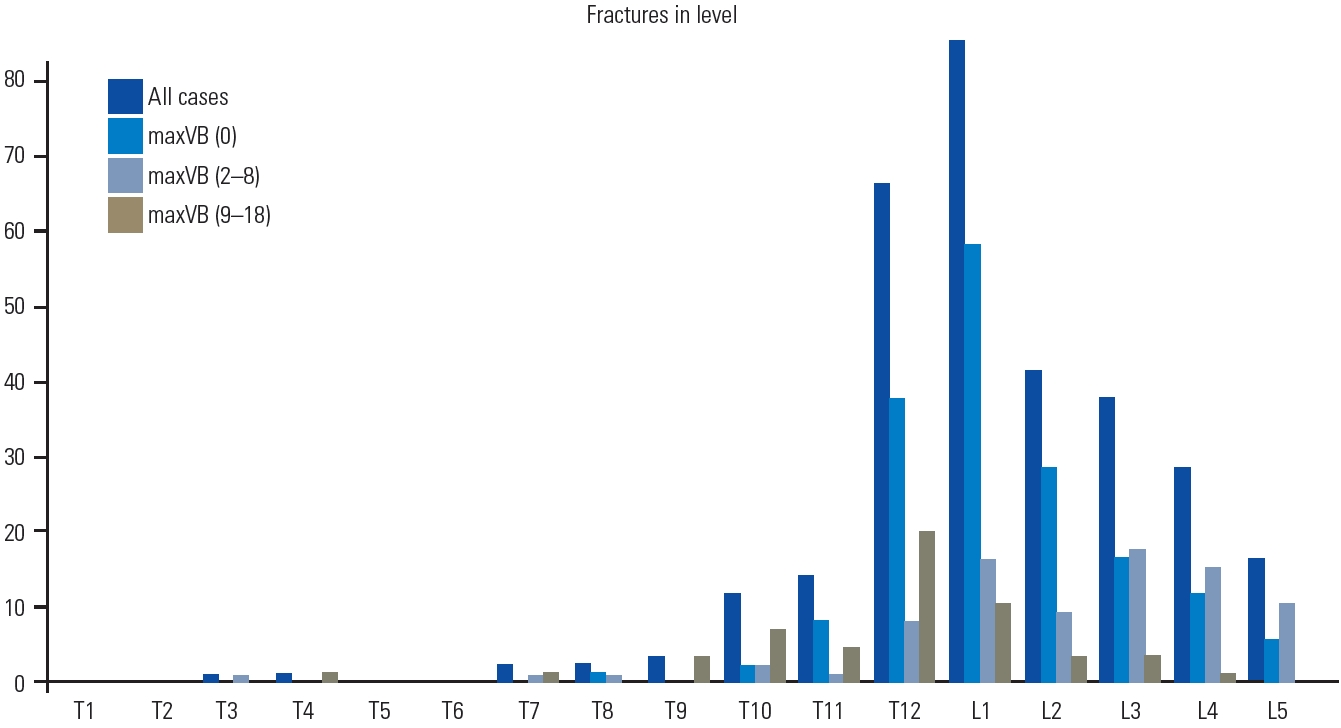
The mean age at the time of injury for all patients was 78.3 years, without sex differences (male, 107; female, 135). In this study, A3 and A4 fracture types were the leading AO classifications. Tumbling (n=173) was the leading cause of injury, and the fracture level was mostly in the thoracolumbar transition region. The distribution of all cases and all groups of bony bridging was more common in the T10 and T11 levels and gradually decreased toward the cephalocaudal side (Fig. 1). In all patients, the fracture level was higher in the thoracolumbar transition region than in other vertebral regions (Fig. 2).
The three-group comparison revealed significant differences in age at injury, fracture type, fracture level, and AO neurological type (Table 1). The comparison of the maxVB (0) and maxVB (2–8) groups revealed that patients in the maxVB (0) group had a higher age at injury and more A4 fractures and thoracolumbar lesions, whereas those in the maxVB (2–8) group had more B (B1 and B2) fractures and lumbar lesions. The comparison of the maxVB (0) and maxVB (9–18) groups revealed that A3 and A4 fractures and neurological deficits were more common in the maxVB (0) group, whereas age at injury was higher and B (B1–B3) and C and thoracic spine fractures were more common in the maxVB (9–18) group. The comparison of the maxVB (2–8) and maxVB (9–18) groups revealed that the maxVB (2–8) group had more A3 fractures, lumbar lesions, and neurological deficits, whereas the maxVB (9–18) group had more B3 and C fractures, thoracic spine fractures, and thoracolumbar lesions (Table 2).
The sub-analysis of 146 patients with spine fractures in the thoracolumbar transition region revealed significant differences in age at injury, fracture type, surgical technique choice, maxVB, the number of fixed vertebrae, the reoperation rate, and mortality within 3 months postoperatively based on the three-group comparison (Table 3). Additionally, the two-group comparisons showed the same results as those of the three-group comparisons in terms of the fracture type. In the comparison between the maxVB (0) and maxVB (9–18) groups, anterior fusion was the preferred technique in the maxVB (0) group, whereas the max VB (9–18) group had a higher age at injury, increased selection of posterior fusion, and more fixed vertebrae and reoperated cases. Mortality occurring within 3 months postoperatively was noted only in the maxVB (9–18) group, which had a significantly higher mortality rate than the maxVB (0) group. Furthermore, the maxVB (2–8) group did not differ significantly from the maxVB (0) and maxVB (9–18) groups in all items under study, except for the fracture type (Table 4).
Discussion
1. Characteristics of spine fractures in the elderly who underwent surgery
Because the variation caused by minor trauma, such as tumbling, is often small, the effect of bone bridging on fracture type and the level of vertebral fractures can be precisely assessed. The thoracolumbar transition region has the highest rate of bone bridging, followed by the thoracic spine, and bone bridging was less frequently observed in the lumbar spine, which is not a substitute of the distribution of bone cross-links in DISH [15,16]. The types of vertebral fractures in the elderly included A3 (incomplete burst fracture) and A4 (complete burst fracture), and fractures were more likely to occur in the thoracolumbar transition region, corroborating the findings of previous studies [17,18].
2. Fracture type according to the maxVB
The morphology of A3 and A4 fractures was the most common in the maxVB (0) group, perhaps because the impact was absorbed by the upper and lower intervertebral disks, owing to the lack of bony bridging, thereby preserving the posterior tissue. The incidence of both B1 and B2 types was increased in the maxVB (2–8) group compared with that in the maxVB (0) group. B1 fractures are also considered “chance fractures” [19]. As the vertebrae become bridged, the lever arm becomes larger and the spinal mobility at the bridging site is reduced, which increases the force applied to the point of action and is thought to cause fractures in the posterior tissues. Additionally, patients in the maxVB (9–18) group were older at the time of injury, and the number of bony bridges usually increases with age and the lever arm becomes longer [2]. Westerveld et al. [20] reported that DISH-associated spine fractures were more likely to be type B extensions; in the AO classification, they belong to the B3 type; in the maxVB (9–18) group, most patients had fractures within the maxVB, which explains the increase in the incidence of B3 type fractures. These findings indicate that the maxVB is closely related to fracture morphology.
3. Fracture level according to the maxVB
The thoracolumbar junction is the transition zone from the rigid, stable kyphotic thoracic spine to the mobile, lordotic, relatively stable lower lumbar spine, and facet joint loading is a crucial factor in the acute thoracolumbar burst-fracture loading mechanism observed in specimens tested in extension. Additionally, the selective activation of multifidus muscle fascicles in the thoracolumbar region appears to be the primary contributor to the relatively high vertebral compressive loading in the thoracolumbar spine [21–24], making it predominantly susceptible to injury. In the maxVB (2–8) group, bony bridging was more common from the thoracolumbar region to the thoracic spine and less common in the lumbar spine. Anterior bony bridging rather strengthens the spine if the lever arm is short; this results in fewer fractures at the thoracolumbar transition. Moreover, this is considered a tendency to cause fractures in the lumbar vertebrae not bridged by other vertebrae. As the number of bony cross-links further increases, a long lever arm is formed from the thoracic to the lumbar region. Specifically, bone bridges are formed at a high frequency in the thoracic to the thoracolumbar transition areas, and they may have occurred at a high frequency in the same area in our patients because fractures were induced in the lever arms.
4. Neurological deficits in spine fracture according to the maxVB
DISH-associated spine fractures, if missed, can cause spinal cord injuries. Unexpectedly, neurological symptoms at our first visit were less common in the maxVB (9–18) group than in the other groups. The appearance of lower extremity paralysis and lower extremity pain can be observed on CT and magnetic resonance imaging even if the fracture is not evident on X-ray. A long lever arm complicates the problem even further because if the fracture is missed, the dislocation will progress over time and become irreversible. Even in the absence of neuropathies, cases with extensive bony bridging should be thoroughly investigated to ensure an accurate diagnosis.
5. Comparison of surgical outcomes of spine fractures in the thoracolumbar transition region according to the maxVB
In this study, maxVB differences affected the fracture level; however, the number of fractures was higher in the thoracolumbar transition region than in other vertebral regions in all three groups. The surgical procedures selected for these thoracolumbar transitional vertebral fractures differed according to the maxVB because of the difference in fracture type; however, no difference in the rate of improvement in paralysis or the frequency of perioperative complications was observed. In the case of maxVB (0) without bone bridging, many bone defects were observed, anterior fixation was frequently selected, and the number of fixed vertebral intervertebral segments was small. New postoperative vertebral fractures occurred in 11 cases, possibly due to osteoporosis or implant failures; however, the occurrence rate of these fractures did not differ significantly from that of the other groups. The frequency of reoperations was low, and no deaths were reported within 3 months after surgery, suggesting that stable results were obtained. In contrast, for patients in the maxVB (9–18) group, posterior fusion was selected, and the range of fixation was wide. The reoperation rate was high primarily because of wound infections. Three patients in this group died of pneumonia within 3 months after surgery. Note that patients in the maxVB (9–18) group had a large surgical area, and DISH indicated a high complication rate of diabetes mellitus and decreased lung function because of the fusion of the ribs and thoracic spine, which may have resulted in more wound infections and pneumonia [25–28]. Consequently, particularly in this group, the postoperative course should be monitored carefully for complications. In the maxVB (2–8) group, the fracture type, operative choice, and reoperation rate tended to be intermediate between those of the maxVB (0) and maxVB (9–18) groups. This indicates that the maxVB is a useful indicator of not only the fracture type but also postoperative complications.
6. Limitations
This was a retrospective study with a small sample size, and there were fewer cases of reoperation and deaths, although the differences were statistically significant. Additionally, the second and third highest numbers of continuous vertebral bone bridges were not considered. Hence, future prospective studies should be conducted to confirm the findings of this study.
Conclusions
In this study, the maxVB was identified as a factor that influenced the fracture type, fracture level, neurological symptoms, and surgical outcomes. Our findings suggest that understanding the maxVB could help elucidate fracture mechanics and identify factors to consider while performing surgery.