


Introduction
By 2050, the percentage of the worldâs total population aged >60 years will double, placing a tremendous strain on the global healthcare system [1]. With the advent of an aging society, the increasing number of patients with fragility fractures caused by osteoporosis has become problematic. Currently, approximately 12 million patients in Japan have osteoporosis, predominantly women. Approximately 3 million men have osteoporosis [2]. The risk of death following a fragility fracture of the hip is 3.17 times higher for men compared with 2.18 times higher for women, using a standardized mortality ratio. In men, the treatment of osteoporosis has become even more important now that their life expectancy has reached 80 years [3]. Although menopause accelerates bone loss in women, the relationship between skeletal muscle mass and bone density has recently attracted increasing attention. Miyakoshi et al. [4] reported a significant association between sarcopenia and osteoporosis in Japanese women. According to Eguchi et al. [5], leg muscle mass and grip strength are associated with the risk of osteoporotic vertebral fractures. Many other studies have reported the correlation between bone mineral density (BMD) and skeletal muscle mass [6â9].
Given that secondary osteoporosis accounts for half of all osteoporosis in men [10], many studies have reported an association between androgen deprivation therapy and prostate cancer [11], diabetes [12], gastrectomy [13], and osteoporosis. Smoking and alcohol consumption are reported to be important behavioral risk factors. However, fewer studies have evaluated osteoporosis in men than in women, and only a few have examined the relationship between osteoporosis and skeletal muscle mass.
Advanced glycation end products (AGEs) are active biomolecules formed by the non-enzymatic covalent binding of sugars with proteins and other molecules [14]. With age, AGEs accumulate in various musculoskeletal tissues including the intervertebral disk, bones [15,16], and muscles [17] and adversely affect the biomechanical properties of these structures. The severity of spine malalignment was reported to be associated with high serum levels of pentosidine in older women. Moreover, a study suggested that AGEs are markers of the progression of lumbar scoliosis and kyphotic deformity [18]. Skin autofluorescence (SAF) is a marker of dermal AGE accumulation. SAF can be quantified using a new noninvasive device [19].
This cross-sectional study aimed to investigate risk factors for male osteoporosis by assessing the BMD, skeletal muscle mass, body fat mass, grip strength, and AGEs.
Materials and Methods
Informed consent was obtained from all participants before the study began. The study protocol was approved by the ethical review committee of Qiball Clinic (no., IDRB: H26â-6). All study participants visited the outpatient clinic in Qiball Clinic between April 2015 and December 2016. The study included 99 men (mean age, 74.9 years; range, 28â93 years) with BMD and body composition assessments. The osteoporosis group consisted of 24 patients (mean age, 72.5 years; range, 44â92 years), and the control group included 75 participants (mean age, 74.9 years; range, 28â93 years).
1. Measurement of dual-energy X-ray absorptiometry
The BMD values of the left proximal femur and lumbar spine (L2âL4) were measured by dual-energy X-ray absorptiometry (Lunar Prodigy; GE Healthcare, Waukesha, WI, USA). According to the World Health Organization criteria for the diagnosis of osteoporosis, osteoporosis was defined as a bone density T score of â2.5 or less [20].
2. Analysis of skeletal muscle mass
A multifrequency bioelectrical impedance analyzer (BIA; InBody 720 Biospace device; Biospace Co., Seoul, Korea) was used according to the manufacturerâs guidelines. BIA measures body composition using the difference in the electrical conductivity of biological tissues. Conductivity is proportional to the amount of water since adipose tissue contains relatively less water than other tissues. Increased body fat results in decreased conductivity and relatively high impedance. The volume of water in the body and fat mass can be quantified by measuring bioimpedance. A total of 30 impedance measurements were obtained using six frequencies, namely, 1, 5, 50, 250, 500, and 1,000 kHz, for the following five body segments: right and left arms, trunk, and right and left legs.
The appendicular muscle mass was calculated as the total of the skeletal muscle mass of the arms and legs, assuming that the mass of lean soft tissues is effectively equivalent to the skeletal muscle mass. The appendicular skeletal mass index (SMI) was defined as the sum of the lean arm and leg mass in kilograms divided by height squared (kg/m2).
3. Skin autofluorescence measurement
SAF was measured using an AGE Reader (DiagnOptics BV, Groningen, Netherlands), an automated noninvasive device that uses the characteristic fluorescence properties of certain AGEs to estimate the level of dermal AGE accumulation. SAF was expressed in arbitrary units.
4. Grip strength
Grip strength was measured in kilograms using a Jamar dynamometer (Sammons Preston, Bolingbrook, IL, USA). During measurement, the elbow was bent 90°, and the forearm was held in neutral rotation. The mean values of two measurements were used.
5. Statistical analysis
Student t-tests were used to statistically compare demographic data between groups. Pearson correlation coefficients were calculated to determine the correlation between femoral T scores and skeletal muscle mass in both groups. Logistic regression was performed to predict the occurrence of osteoporosis, using the loss of lean lower limb muscle mass (independent variable) and osteoporosis (dependent variable). Other covariates included in the multivariate analyses were height, body fat mass, lower limb muscle mass, age, and SAF. These tests were two-tailed, and p<0.05 was considered statistically significant. All data are expressed as meansÂąstandard deviations. R ver. 3.5.1 (patched; The R Foundation, Vienna, Austria; http://www.r-project.org) was used for all statistical analyses.
Results
Physical examinations revealed no significant differences between the osteoporosis and control groups in terms of age, height, weight, body mass index (BMI), body fat mass, and body fat percentage (p>0.05) (Table 1).
The skeletal muscle mass was significantly lower in the osteoporosis group than in the control group in terms of lean body muscle (23.1 kg versus 24.9 kg, respectively; p=0.04) and lean leg mass (13.0 kg versus 14.4 kg, p=0.01). The SMI was also significantly lower in the osteoporosis group than in the control group (6.7 kg/m2 versus 7.1 kg/m2, p=0.03). No difference in lean trunk or arm mass was found between the groups; however, lean body muscle, lean mass leg, and SMI were significantly lower in the osteoporosis group than in the control group (p<0.05).
BMD values at the femur (0.646 g/cm2 versus 0.874 g/cm2, respectively) and lumbar spine (0.913 g/cm2 versus1.169 g/cm2, both regions p<0.0001) were significantly lower in the osteoporosis group than in the control group, as were the femoral T scores (â2.9 versus â1.3) and lumbar T scores (â1.4 versus 0.3, all scores p<0.0001).
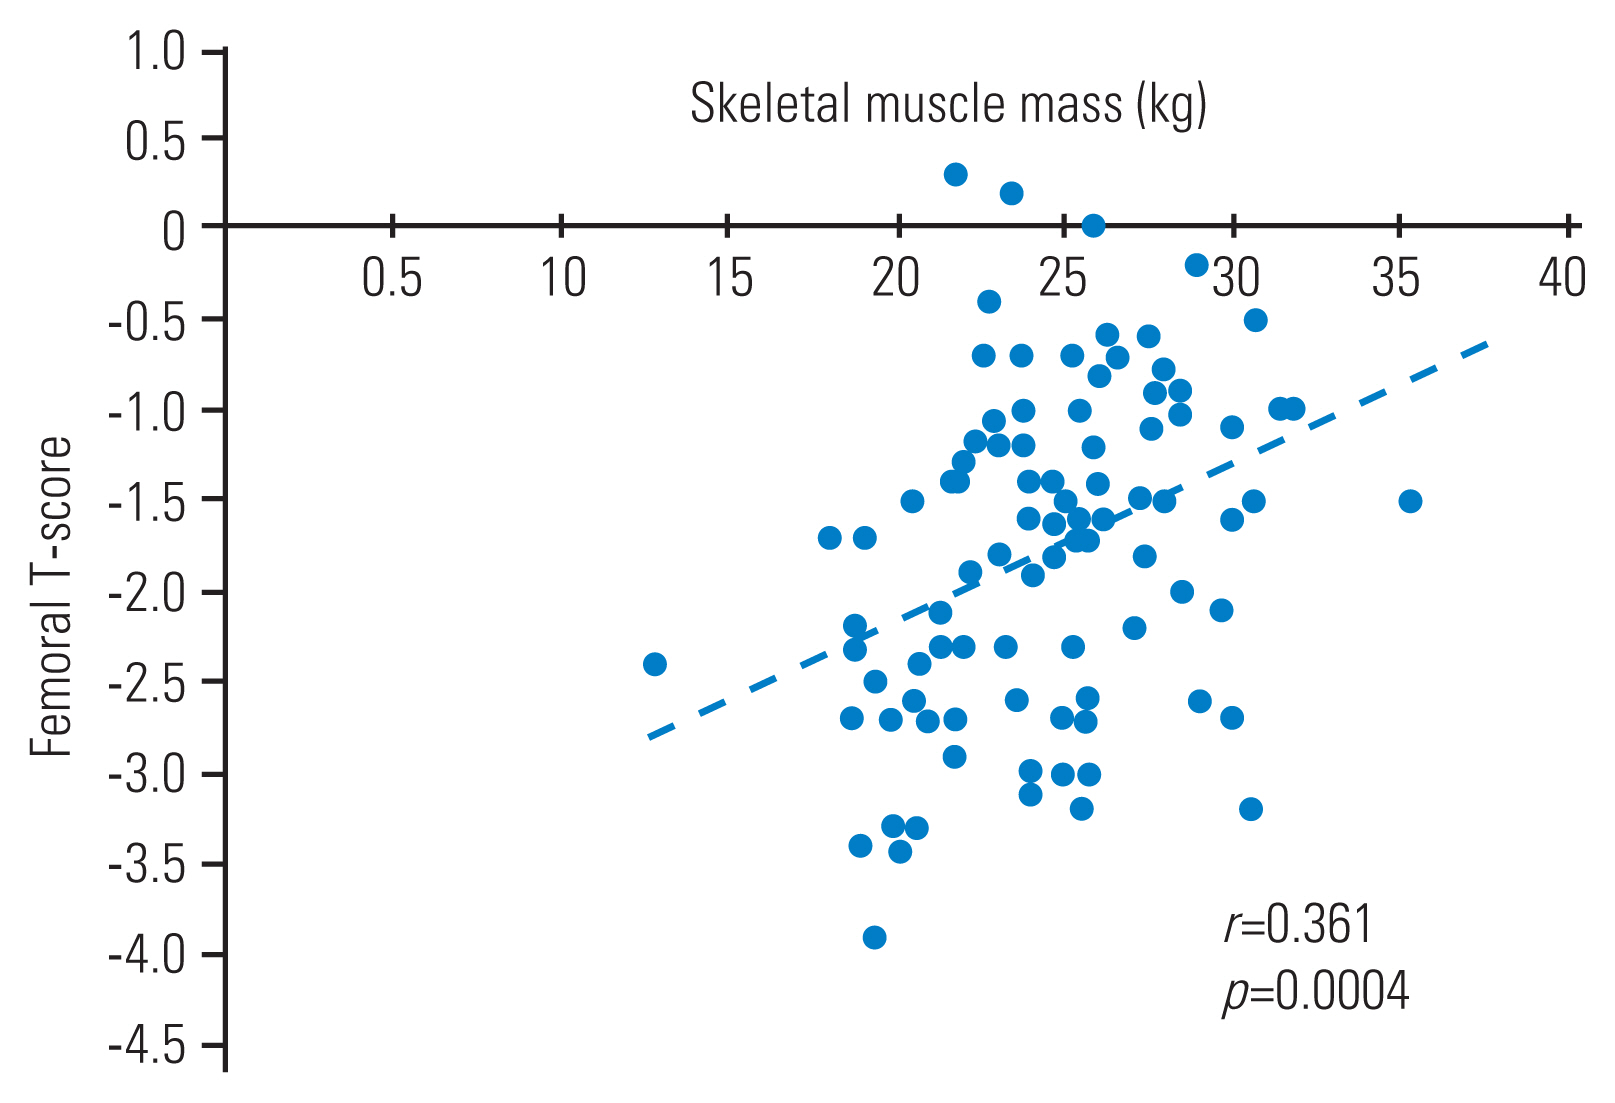
Bilaterally, grip strength was numerically lower in the osteoporosis group than in the control group; however, the differences did not reach statistical significance. Similarly, SAF was not significantly different between the groups. The femoral T score was positively correlated with the lean body muscle (r=0.361, p=0.004) (Fig. 1). Logistic regression analysis (with osteoporosis as the objective variable and height, body fat mass, lower limb muscle mass, age, and SAF as explanatory variables) was used to identify lean leg mass as a risk factor for osteoporosis in men (odds ratio, 0.64; p=0.03) (Table 2).
Discussion
In recent years, the relationship between osteoporosis and skeletal muscle mass has been the focus of much attention, although most studies have been on women, and few have been conducted in men. In this study, the osteoporosis group had significantly lower skeletal muscle mass, leg muscle mass, and SMI than the control group, indicating that low muscle mass, particularly in the legs, was associated with male osteoporosis. The results of the logistic regression analysis revealed that low muscle mass in the legs can be a risk factor for osteoporosis.
In Japan, 23% of the population with osteoporosis and 20% of patients with proximal femur fractures are male, and this number is expected to increase to 31% by 2050 globally [19,21]. However, the percentage of Japanese men diagnosed with osteoporosis is low, and the treatment rate is low compared with that of Japanese women. Given these circumstances, osteoporosis should not be ignored in men, and risk factors and prevention strategies must be identified.
Recently, the relationship between osteoporosis and skeletal muscle mass in women has been in the spotlight. According to a report from Finland, osteoporosis was 13 times higher in women with sarcopenia than in women without sarcopenia, and osteoporosis was 12 times higher in the group with reduced grip strength [22]. Women with sarcopenia have 3 times more fractures and twice as many falls than women without sarcopenia [4]. Moreover, decreased leg muscle mass and grip strength in postmenopausal women correlated with the risk of osteoporotic vertebral compression fractures [5].
In this study, skeletal and leg muscle mass values were significantly lower in men in the osteoporosis group than in men in the control group, and low leg muscle mass was found to be a risk factor for osteoporosis, a finding that is comparable with reports of women with osteoporosis [5]. Regarding grip strength, left grip strength of â¤18 kg, which is the diagnostic criteria for sarcopenia, is a risk factor for vertebral compression fractures in older women [5]. In this study, in men, the left-side grip strength tended to decrease from 24.1 kg in the osteoporosis group and 26.7 kg in the control group (p=0.15), satisfying the diagnostic criteria for sarcopenia (grip strength of â¤26 kg). A simple screening for osteoporosis based on grip strength could be a powerful diagnostic tool. Thus, the sample size must be increased.
In recent years, systematic reviews and meta-analyses have assessed empirical evidence and summarized the statistical strength of risk factors for osteoporosis and fractures in men [23â25]. The systematic review conducted by Liu et al. [23] revealed that the quality of evidence for low bone density and osteoporotic fractures was high for age, low body weight, weight loss, physical inactivity, and history of fracture. The meta-analysis reported by Drake et al. [24] revealed that significant risk factors included older age, low BMI, current smoking, excessive alcohol intake, chronic glucocorticoid use, pre-existing fracture, history of falls, gonadal dysfunction, stroke, and diabetes. In Japan, a cohort study conducted by Iki et al. [25] revealed that smoking and consumption of alcohol, milk, and natto (fermented soybeans) were associated with osteoporosis in men.
Based on the results of this study, low leg muscle mass could be considered a risk factor that precipitates osteoporosis in men, and we propose that it may also lead to physical inactivity.
Sakuma et al. [26] showed that 81% of patients who sustained hip fractures also had vertebral fractures and that the mean age at the time of injury was higher for hip fractures (81.4 years) than for vertebral fractures (77.7 years). Those results suggest that vertebral fractures can lead to hip fractures, and early fracture prevention strategies are important for older patients with osteoporosis [26]. The results of this study showed that male patients with osteoporosis have lower bone density in the lumbar spine and femur; thus, they may be more likely to fall because of the loss of their leg muscle mass, which can increase the likelihood of femoral neck fractures and vertebral compression fractures.
Based on our results, effective conservative treatment of osteoporosis in men is needed for the maintenance or strengthening of skeletal muscles. This will include exercise therapy (i.e., resistance training [27]) and nutritional supplementation (i.e., essential amino acids, minerals, and vitamins such as vitamin D [28]), particularly on the lower extremities.
This study has limitations. First, the number of patients analyzed is small. Second, the study employed a cross-sectional research design, not a longitudinal design. Third, the presence or absence of complications such as diabetes, malnutrition, smoking, and steroid use, which are etiologic factors of secondary osteoporosis, was not investigated. Finally, the study included men of all ages attending an orthopedic outpatient clinic, and nearly half of the participants (48/99, 48.5%) were taking osteoporosis drugs at the time of the study. Thus, many patients with osteoporosis and relatively low muscle mass were included. Therefore, they were not representative of the general population.
Conclusions
According to our observations, skeletal and leg muscle mass values were significantly lower in men with osteoporosis; in particular, the loss of leg muscle mass was identified as a risk factor for osteoporosis. Moreover, lower leg muscle mass could be considered a risk factor for male osteoporosis and may lead to physical inactivity. Thus, male osteoporosis will require conservative treatment that effectively facilitates the maintenance or strengthening of skeletal muscle mass; ideally, treatment should include exercise therapy, focusing on the lower extremities, and nutritional supplementation.