


Introduction
Traumatic fractures of the low lumbar spine (L3–L5) are uncommon, accounting for only 10%–13% of thoracolumbar (TL) injuries [1,2]. In comparison to the thoracic and TL spinal regions, the lower lumbar spine has unique anatomical and biomechanical characteristics [3,4]. The lordotic position of the lower lumbar spine shifts the body’s center of gravity posterior to the vertebral body, resulting in an even distribution of axial compression force and higher risks of burst fractures [5].
As the spinal canal in the lower lumbar region is comparatively wider, injuries to the cauda equina and spinal root, although result in neurological impairment, have a higher chance of recovery following surgery [5–8]. Numerous studies have investigated radiological findings related to neurological deficits in TL fractures, such as the canal anteroposterior diameter, anterior vertebral compression ratio, interpedicular distance (IPD), and presence of vertical laminar fractures [9–14]. In a study of 198 patients with TL and lumbar fractures, Meves and Avanzi [15] reported a significant correlation between spinal canal stenosis and the severity of incomplete neurologic deficits. However, most studies have analyzed computed tomography (CT)-based parameters and focused on TL fractures [15].
Recently, Lee et al. [16] analyzed various CT parameters to determine the incidence of neurological deficit in patients with mid and lower lumbar fractures (LLFs, L2–L5). However, their results were constrained by the relatively small sample size and lack of magnetic resonance imaging (MRI) parameters [16]. Moreover, the utility of MRI in predicting neurological deficits in cervical and thoracic spine injuries has been widely studied based on cord signal changes. Its applicability in lumbar spine fractures has been least explored. Thus, we decided to analyze both CT and MRI parameters in our patients with LLFs because of some cases of spinal epidural hematoma formation in LLFs that resulted in neurological deficits.
Materials and Methods
1. Inclusion/exclusion criteria
Between January 2010 and January 2020, data from 108 patients with traumatic LLFs who underwent surgical management in Ganga Medical Center and Hospitals Pvt. Ltd. (Ganga Hospital) were retrospectively reviewed after clearance from the institutional review board (IRB no., 2022/10/12). On the contrary, patients who had inadequate follow-up data, lacked CT/MRI data, had undergone spine surgery, and had pathological fractures were excluded. The requirement for informed consent from individual patients was omitted because of the retrospective design of this study.
2. Data collection
Patient demographic details were collected from both the medical records and the hospital information system. The assessment of the neurological status was documented using the American Spinal Injury Association (ASIA) Impairment scale. Patients were classified into two groups, namely, patients with neurodeficits (ASIA A, B, C, and D) and patients with normal neurology (ASIA E), and radiological predictors were analyzed between the two groups. Fractures were categorized by the Thoracolumbar Injury Classification and Severity (TLICS) score, load-sharing classification score, and AO spine classification.
3. CT and MRI-based imaging
In all patients, CT images were focused on the bone tissue with a mean window width of 2,000 Hounsfield units and a mean window level of 500 Hounsfield units and axial images of 3-mm slice thickness, and sagittal and coronal images were reconstructed with a slice thickness of 2 mm. MRI was performed using a 1.5-T MRI (Magnetom Symphony; Siemens, Erlangen, Germany). The spine trauma protocol included axial and sagittal T2- and T1-weighted, sagittal short tau inversion recovery, with a slice thickness of 3 mm for sagittal and 4 mm for axial, using a matrix size of 240×320.
4. CT-based radiological parameters
The following radiological parameters were analyzed in preoperative CT images.
1) Anterior vertebral body height
This was measured as the distance between the most anterior superior point to the most anterior inferior point on the vertebral body rim (Fig. 1).
2) Posterior vertebral body height
This was measured as the distance between the most posterior superior point to the most posterior inferior point on the vertebral body rim (Fig. 1).
3) Loss of vertebral body height
The affected anterior and posterior vertebral body heights of the segment were measured. A normal loss of vertebral body height (LOVBH) was determined as a percentage of the height loss normalized to the average of the vertebral bodies above and below the injured segment, as previously explained by Willen et al. [17] (Fig. 1).
4) Local kyphosis
Local kyphosis (LK) refers to the angle formed between the lines drawn along the superior and inferior endplates of the fractured vertebra (Fig. 1).
5) Retropulsion of the fracture fragment
Retropulsion of the fracture fragment (RFF) refers to the distance from the posterosuperior corner of the fractured vertebral body to a tangent line touching the posterior inferior corner of the above normal vertebra (Fig. 1).
6) IPD
IPD was measured in axial CT cuts by comparing the distance between the medial borders of both pedicles at the injury level and the normal levels above (PA) and below (PB) the injury level (Fig. 2).
7) Canal compromise
Canal compromise (CC) was measured as the cross-sectional area of the spinal canal at the fracture level in axial CT by drawing the region of interest (ROI) on the Picture Archiving and Communication System (PACS), which automatically calculated the cross-sectional area (Fig. 2).
8) Sagittal transverse ratio
The sagittal transverse ratio (STR) was defined as the ratio of the anteroposterior spinal canal diameter to the medial–lateral spinal canal diameter (Fig. 2).
5. MRI-based radiological parameters
The following radiological parameters were analyzed using preoperative MRI scans.
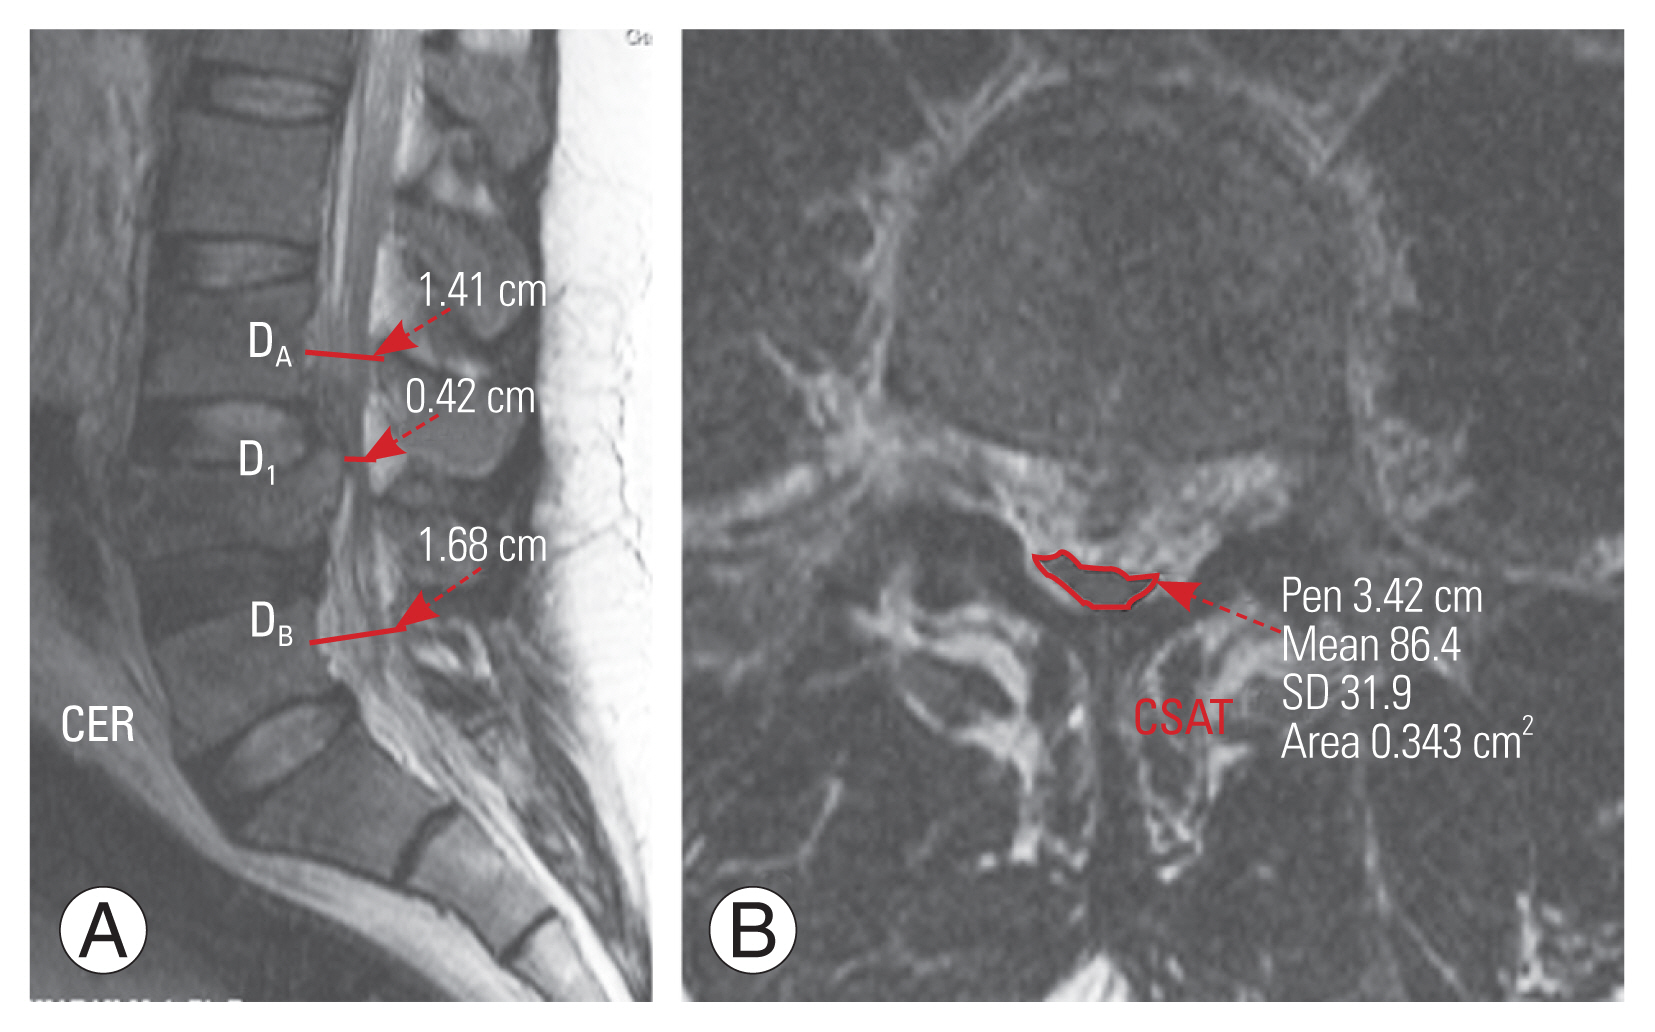
1) Canal encroachment ratio
Canal encroachment ratio (CER) was calculated using the anteroposterior canal diameter of the fractured vertebra (DI) and the vertebrae above (DA) and below (DB) on the midsagittal MRI (Fig. 3).
2) Cross-sectional area of the thecal sac
This was measured on the selected axial image by drawing an ROI around the thecal sac on a PACS, which then automatically calculated the cross-sectional area of the thecal sac (CSAT) (Fig 3).
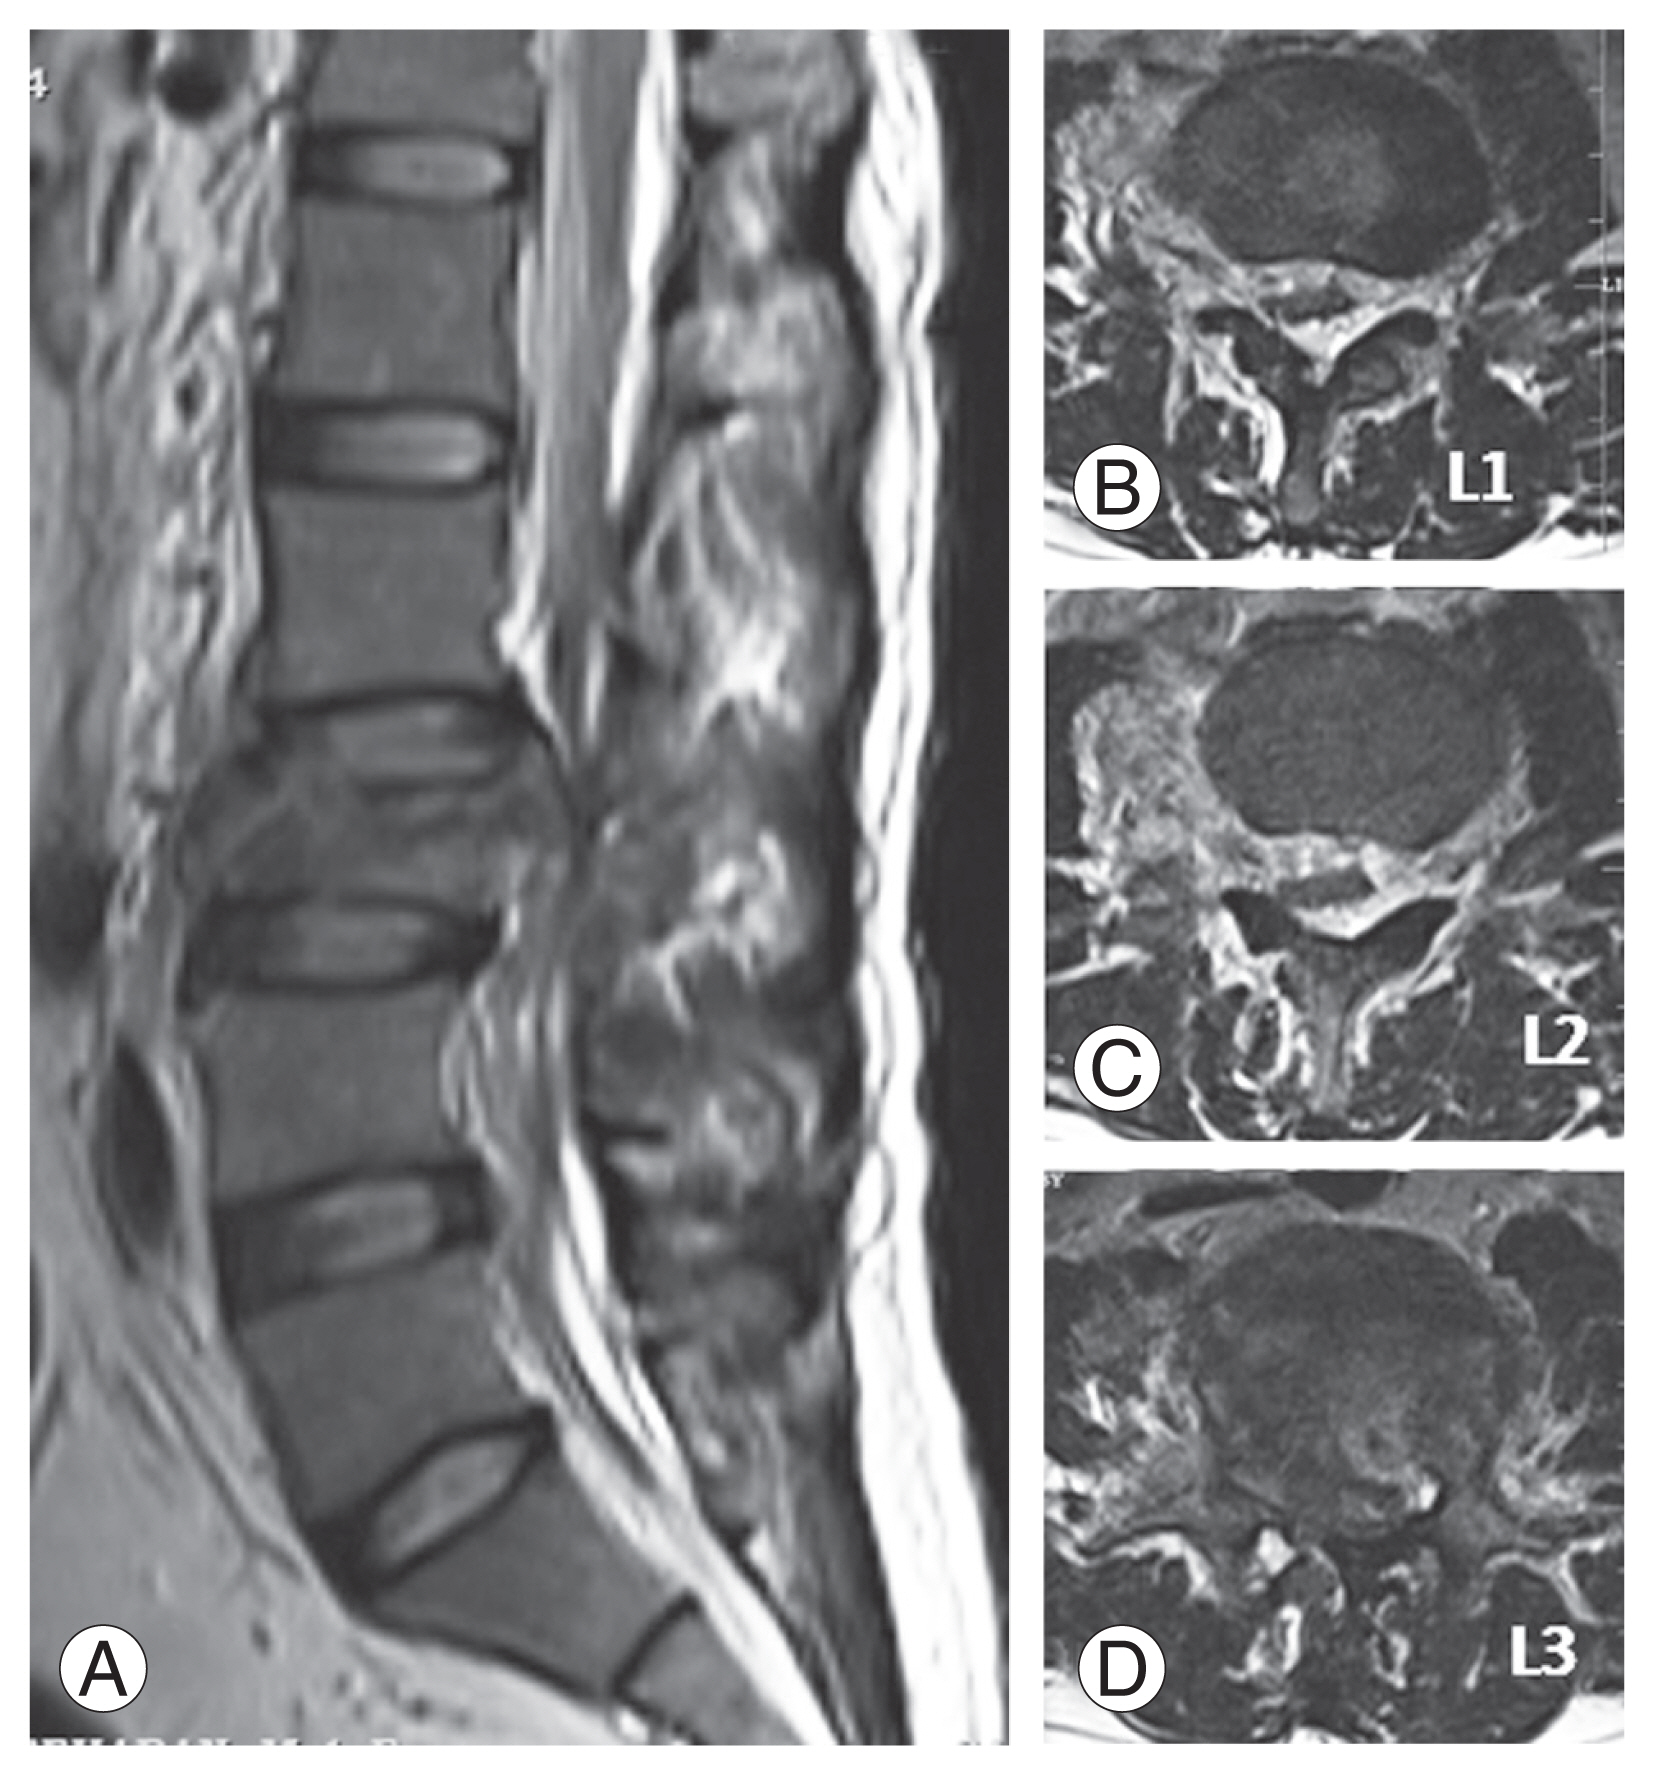
3) Presence of epidural hematoma
This was diagnosed based on the isointense or hyperintense signal present on T1W and hyperintensity with areas of hypointensity to the spinal cord in T2W images causing compression of epidural fat, subarachnoid sac, and spinal cord (Fig. 4).
6. Statistical analysis
Statistical analysis was performed using IBM SPSS Statistics for Windows ver. 24.0 (IBM Corp., Armonk, NY, USA). The unpaired t-test was used to analyze continuous variables, whereas the chi-square test or Fisher’s exact test was used to analyze categorical ones. Wilson confidence intervals (CIs) were used to determine CIs for proportions. Multivariate logistic regression analysis was used to determine the independent risk variables associated with neurological deficits. Variables significant at p<0.05 in the univariate analyses were eligible for inclusion in the multivariate models. It determined the diagnostic accuracy of radiological parameters for predicting neurological deficit, namely, sensitivity, specificity, positive and negative predictive values, and positive and negative likelihood ratios. To determine the cutoff, receiver operating characteristic (ROC) curves were generated. Using the area under the curve (AUC), the discriminatory ability of risk factors was evaluated. The threshold was determined based on the Youden index.
Results
1. Baseline demographics and injury characteristics
Of the 108 patients, 96 were males and 12 were females. The mean age was 35.8 years (range, 15–84 years). Moreover, 71 patients (65.7%) had L3 fracture, 34 (31.5%) had L4 fracture, and 3 (2.8%) had L5 fracture. MRI identified posterior ligamentous complex (PLC) injury in 57 patients (52.8%). Among the 108 patients, 9 (8.3%) had ASIA A, 4 (3.7%) had ASIA B, 17 (15.7%) had ASIA C, 21 (19.4%) had ASIA D, and 57 (52.9%) had ASIA E neurology status upon admission. Epidural hematoma was noted significantly higher (p-value=0.001) in the group with neurodeficit (64.7%) than in the group without neurodeficit (7%) (Table 1).
2. Relationship between radiological predictors and neurological deficit
The neurodeficit group had a substantially higher mean TLICS (7.08±1.07) than the control group (4.58±0.75) (p=0.001). Furthermore, the mean load-sharing score for the neurodeficit group was 7.82±1.29, which was substantially higher (p=0.001) than that for the control group, which was 6.67±1.95. Moreover, statistically significant differences in RFF (p=0.001), CC (p=0.001), CER (p=0.001), and CSAT (p=0.001) were found between the groups (Table 2).
The TLICS, load-sharing score, RFF, CC, CER, CSAT, and presence of epidural hematoma were found significant (p<0.05) on the univariate analysis (Table 3). However, multivariate logistic regression analysis revealed that TLICS (odds ratio, 19.124; 95% CI, 4.647–78.699; p=0.000), CER (odds ratio, 1.062; 95% CI, 1.000–1.128; p=0.050), and CSAT (odds ratio, 0.924; 95% CI, 0.865–0.987; p=0.019) were independently associated with neurological deficit (Table 4). Only CER and CSAT have high discriminating power, as shown by ROC analyses (AUC, 0.926; 95% CI, 0.860–0.968; AUC, 0.963; 95% CI, 0.908–0.990, respectively). The optimal cutoff value for CER was 50% with a sensitivity and specificity of 84.3% and 91.2%, respectively. Similarly, the optimal cutoff for CSAT was 65.3 mm2 with a sensitivity and specificity of 94.7% and 90.2%, respectively.
Discussion
The results of our study highlight that among CT and MRI parameters, the major determinants of neurological deficits in traumatic LLFs are the CER and CSAT. Both are MRI-based parameters, implicating the importance of MRI in patients with LLFs.
MRI has been the imaging modality of choice in acute spinal injury. To evaluate spinal cord damage and rule out soft tissue injuries, epidural hematoma, or disc herniation, MRI has largely replaced CT as the modality of choice, even if CT can reveal more information about the extent of a bone injury [10]. Various qualitative and quantitative parameters are used to assess and prognosticate the extent of spinal cord injury (SCI) [9–15]. Ramon et al. [18] classified qualitative MRI parameters into five patterns: pattern 1, hemorrhage; pattern 2, edema; pattern 3, contusion; pattern 4, compression; and pattern 5, transection. They highlighted that patients with cord hemorrhage and transection were associated with irreversible neurological deficits, whereas those with contusion and edema were associated with reversible neurological deficits [18].
Similarly, the quantitative parameters used for assessing SCI are maximum canal compromise (MCC) and maximum spinal cord compression (MSCC), which reflect acute neurological deficits caused by cord compression. The optimum MCC and MSCC cutoffs are 29% and 52.8% in the cervical region and 30% and 24.0% in the cervicothoracic region, respectively [19,20]. These MRI parameters have been widely used in patients with acute cervical and thoracic SCIs.
Biomechanically, the TL region (T11–L1) represents a transitional region between the rigid thoracic and mobile lumbar spine. The neurological deficit pattern at T11 and T12 differs significantly from that of L1. This may be attributed to the variation in the position of the conus medullaris, variable involvement, and sensitivity of the cord, conus, or cauda equina at the level of injury. Similarly, the mid (L2) and lower lumbar (L3–L5) regions have wider spinal canal diameter; thus, injuries to the lower motor neuron, such as the cauda equina and spinal root, cause neurological impairment but have a high chance of recovery following surgery than injuries to the upper motor neurons [5–8].
Several studies have reported radiographic findings that can predict neurological deficits in TL fractures, including spinal canal stenosis, vertebral body height loss, IPD, and presence of vertical laminar fractures [11,12]. According to Hashimoto et al. [21], the incidence of neurological deficit in patients with burst fractures was significantly high when the degree of CC was ≥35% at T11 and T12, ≥45% at L1, and ≥55% in other lumbar vertebrae. Meanwhile, Mohanty et al. [13] found a median of 50% spinal CC in their group of patients with neurological deficits caused by TL fractures, they were unable to find a statistically significant relationship between CC and severity of neurological deficit. The majority of radiological parameters described in the literature are based on CT, whereas MRI results are just briefly mentioned. In a study of 76 patients with acute TL fractures, Naduvanahalli Vivekanandaswamy et al. [22] found that among all MRI-based parameters, the length of cord edema was the most significant predictor of neurological deficits.
The radiological predictors of neurological deficit in LLFs may vary substantially from those in TL fractures. Lehman et al. [23] reported that in 19 patients with LLFs, 10 (52.6%) had neurological deficits. Similarly, Motten et al. [24] reported an incidence rate of 33% in their patients with LLFs. In the present study, out of 108 patients, 51 (47.2%) had neurological deficits, which was comparable to previous reports.
In TL fractures, neurological impairment is associated with the fracture type, injury level, kyphotic deformity, and various parameters [13,25,26]. The results of this study showed that the injury level and type did not correlate with the incidence of neurological deficits. Moreover, no correlation was found between the incidence of neurological deficit and the presence of lamina fractures or PLC injury. Among CT parameters, RFF and CC were found to be significantly higher in patients with neurological deficits. However, other parameters such as the LOVBH, LK, IPD, and STR were not significant.
In this study, MRI parameters, namely CER, CSAT, and presence of epidural hematoma, were analyzed. The importance of a critical analysis of these parameters can be substantiated by our results. On the multivariate analysis of all radiological parameters, only CER and CSAT were statistically significant.
Although the incidence of neurological deficit is as high as 60% in patients with burst fractures, the degree of CC may vary [27]. According to Denis [28], the obstruction of 25%–50% of the spinal canal rarely resulted in neurological damage at the L2–L5 level, although it was comparatively higher at the T11–L1 level. Hashimoto et al. [21] reported that the optimal cutoff of CER was 55% at the level of cauda equina in 22 patients with LLFs. In a study involving 71 patients with mid and LLFs, Lee et al. [16] reported a cutoff of 47% as the optimal value for patients to undergo emergency decompression.
According to Sandler and Tator [29], the degree of neurological damage is primarily determined by the severity of the initial insult, and the deficit may continue despite the elimination of the spinal cord pressure. Moreover, during injury, various dynamic changes in the geometry of the spinal canal, vertebral endplates, and intervertebral disc result in a higher magnitude of damage to the neural structures in the canal [29]. Panjabi et al. [30] highlighted its importance based on an in vitro study where they showed that dynamic canal encroachment in a burst fracture during injury increased substantially by 85% compared with static canal encroachment at the time of imaging. Thus, evaluating the CER ratio on MRI would be optimal because it provides more information about the intervertebral disc and PLC in cases of LLFs. In this study, the optimal cutoff for CER was 50%, which is similar to previous reports.
In patients with substantial spinal canal stenosis, the CSAT is the most important MRI parameter that determines the severity of the canal stenosis. In LLFs, the CSAT must be measured because the spinal canal diameter provides a rough estimate of the space available for the nerve rootlets. In addition, the presence of the epidural hematoma with buckling of the ligamentum flavum significantly reduces the CSAT, causing neurological weakness. In this study, the optimal value of CSAT for determining neurological deficits was 65.3 mm2. Moreover, 33 (64.7%) of 51 patients with neurological deficits had an epidural hematoma. In these patients, the presence of epidural hematoma significantly reduced CSAT, which necessitated emergency decompression.
This study has a few limitations. First, this is a retrospective study with a relatively smaller sample size; thus, bias is possible. To validate the results of this study, a multicentric prospective study with a relatively larger sample size is necessary. Second, only patients who had undergone surgery were analyzed. Therefore, we may be unable to conduct an appropriate analysis because of insufficient data from the nonsurgically treated group. Third, given the potential for human errors due to manual measurements, an automated software tool may provide more reliable data. Finally, as the patients presented to our center at different periods, analyzing the factors that can predict neurological recovery was quite difficult.
Conclusions
The results of this study suggest that MRI parameters, namely, the CER and CSAT, are important radiological parameters for predicting the incidence of neurological deficits in patients with LLFs, with an optimal cutoff of 50% and 65.3 mm2. Moreover, the higher incidence of traumatic epidural hematomas in LLFs requires preoperative MRI in patients with neurological deficits to plan the appropriate extent of decompression.