


Introduction
A key aspect of cervical disorders is the involvement of dynamic factors, which have been well documented in the literature [1–5]. A critical consideration in the management of cervical disorders is the development of spinal stenosis caused by the pincer mechanism in the extended cervical position [4]. To adequately address this issue, identifying and decompressing potential stenosis sites during evaluation are essential [6–8]. Assessing the cervical spine in the extended position can help identify these sites, enabling more effective decompression and reducing the risk of insufficient decompression [6–8].
Dynamic cervical magnetic resonance imaging (MRI) is an extremely useful diagnostic tool for assessing the involvement of dynamic factors in cervical disorders [6–8]. However, in general clinical practice, cervical MRI in the neutral position is common [9,10]. This approach may not fully capture the extent of spinal cord (SC) compression during neck extension, leading to suboptimal surgical planning and postoperative outcomes.
This study aimed to investigate imaging findings that may be risk factors for the development of stenosis in the extended position in cases requiring surgery for cervical disorders, in which preoperative MRI is not feasible in the neutral position. If these risk factors are identified, surgeons can better predict the sites of stenosis that may become problematic during neck extension, allowing for more targeted and effective decompression strategies.
Materials and Methods
2. Ethical approval
This study was conducted in compliance with the principles of the Declaration of Helsinki. The study protocol was reviewed and approved by the Institutional Review Board (IRB) of Tokyo Dental College Ichikawa General Hospital (IRB approval no., 254). Written informed consent was obtained from all patients.
3. Participants
At our academic institution, 143 patients underwent decompression surgery for cervical spine disorders between January 2012 and December 2014 and were followed up for >12 months. The inclusion criteria were as follows: symptomatic cervical disorders with at least one clinical sign of myelopathy or radiculopathy, evidence of cervical SC or nerve compression on MRI or cervical computed tomography (CT) myelogram, and no history of cervical spine surgery. Decompression alone was not performed in patients with a local kyphosis of >20°, spondylolisthesis of >3.5 mm, and occupying ratio of ossification of the posterior longitudinal ligament of >60%.
4. Data collection
Patients’ demographic data, namely, age, sex, body height, body weight, disease type, Japanese Orthopedic Association score, and follow-up period, were retrospectively obtained.
5. Analysis of radiological findings
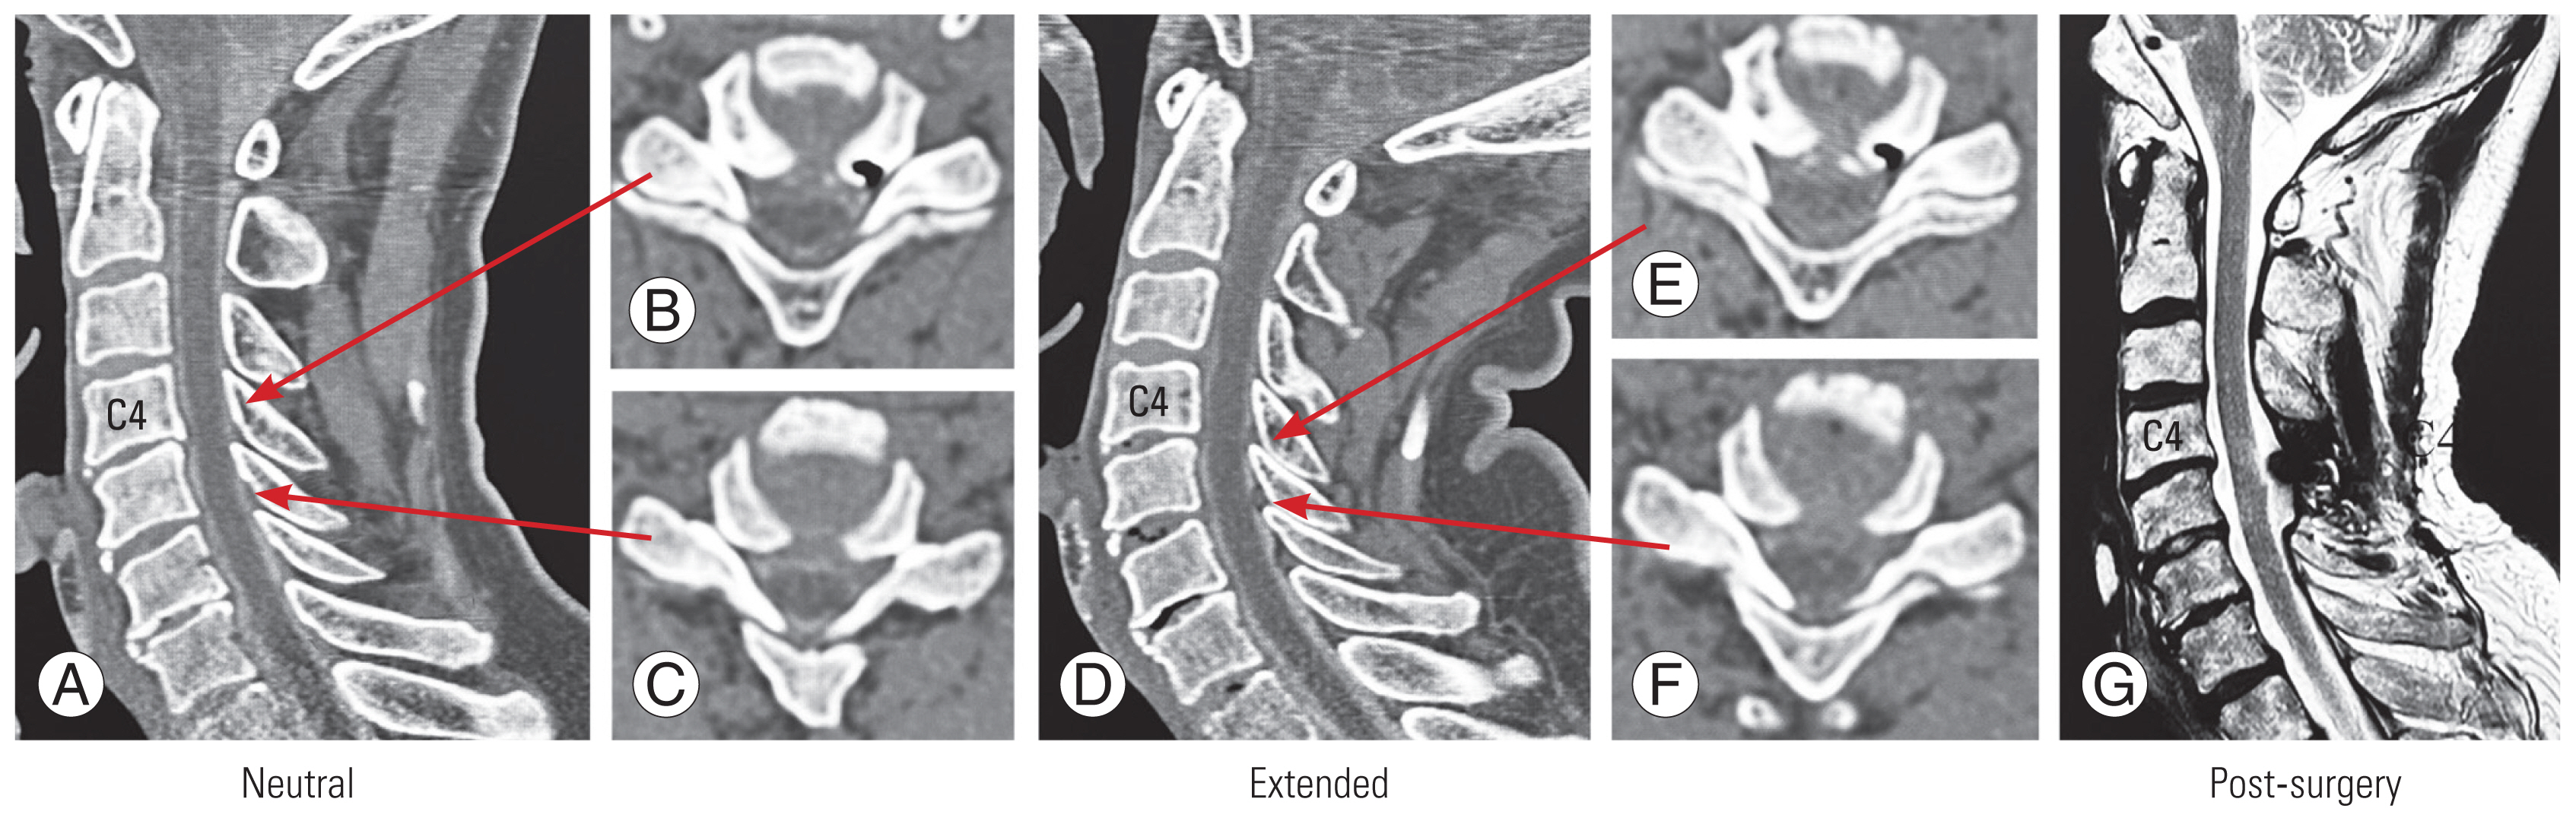
Five spinal surgeons independently performed radiological evaluations using digital imaging and communications in medicine viewer (Synapse ver. 4.1.0; FUJIFILM Medical, Tokyo, Japan). The intervertebral disc level with the disappearance of the subarachnoid space in the cervical neutral and extended positions was used to determine the stenosis level. Myelography was performed in nearly all patients undergoing surgery, and the disappearance of the subarachnoid space was determined by preoperative CT myelogram in the cervical neutral and extended positions (Fig. 1). However, for patients who could not undergo myelography because of allergies, etc., preoperative MRI was performed in the neutral and extended positions on the same day.
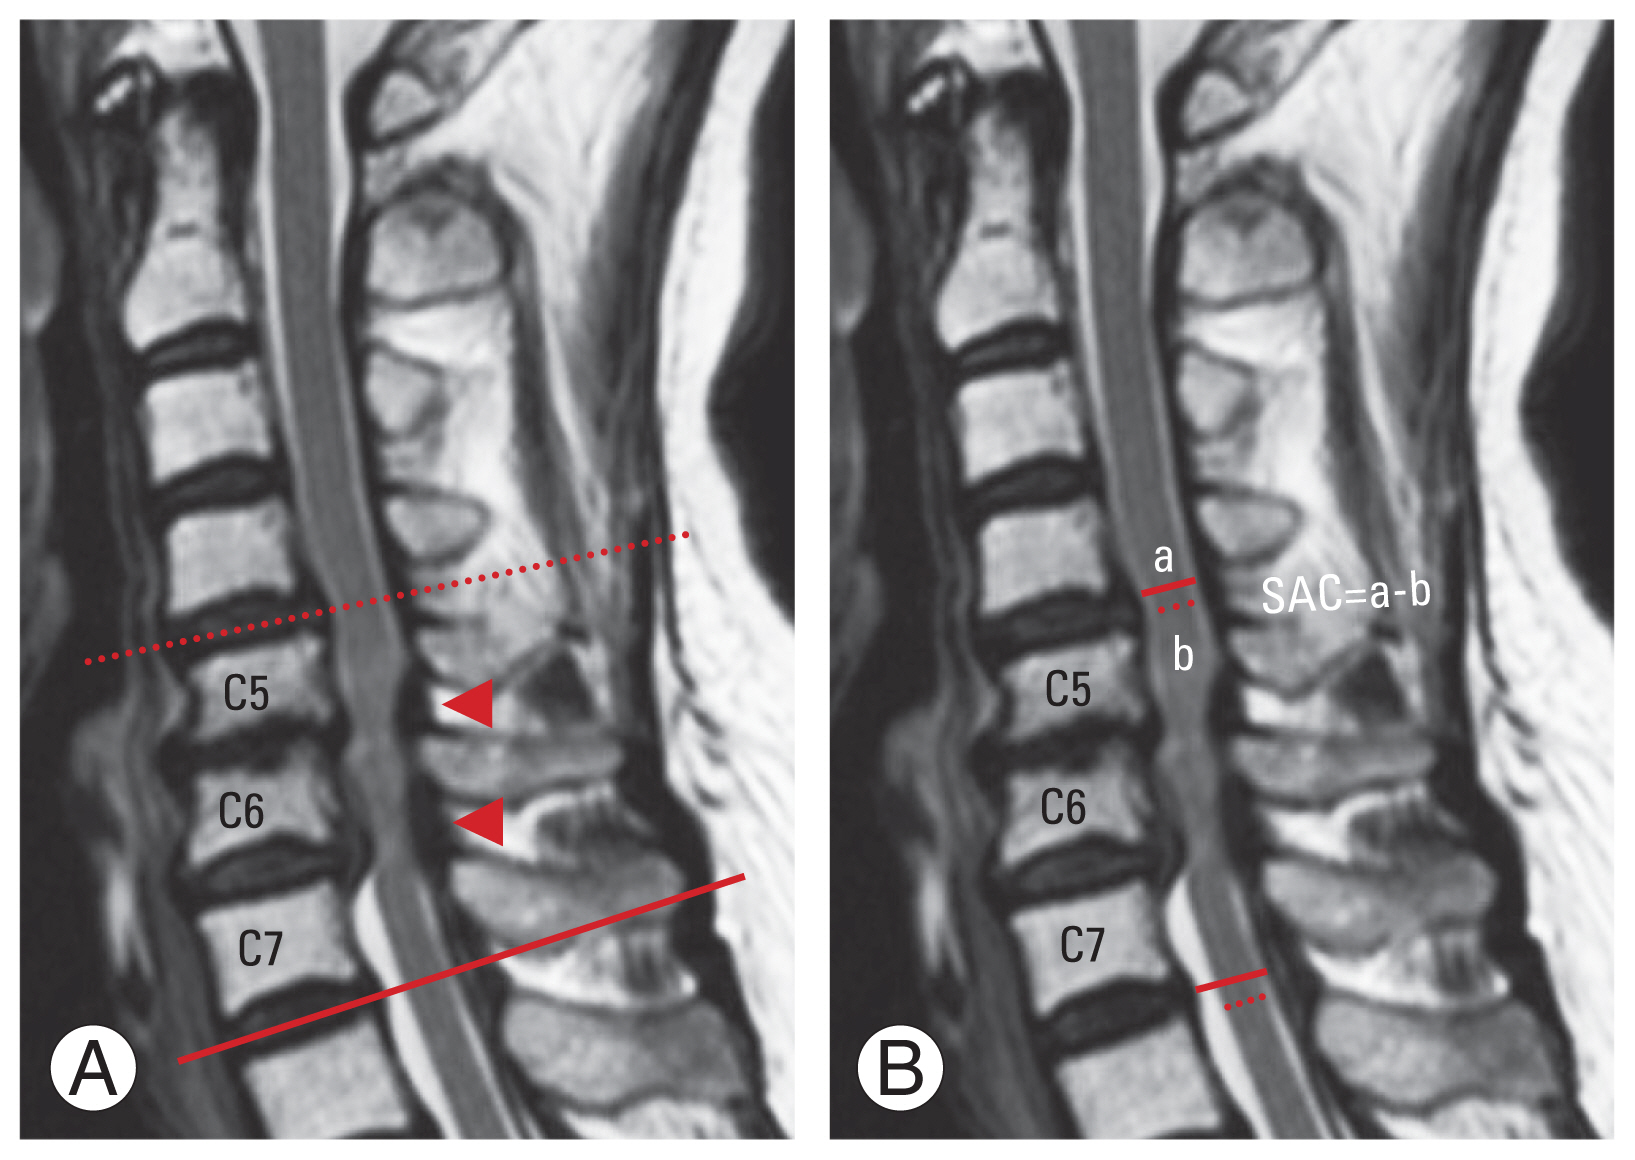
Initially, the location of the stenosis in the neutral position was evaluated. The development of new stenosis in the extended position in the nonstenotic intervertebral segment adjacent to the intervertebral segment with stenosis in the neutral position was investigated (Fig. 2).
At the upper and lower-disc levels adjacent to the stenosis site in the neutral position, the anteroposterior (AP) diameter of the dural tube (AP of the dura) and the AP diameter of the SC (AP of the SC) were measured on a T2-weighted sagittal MRI in the neutral position. This measurement was performed at the site with the least residual space for the SC (space available for the SC [SAC]) and was performed in a line orthogonal to the SC. The SAC was calculated as the difference between the AP of the SC and the AP of the dura (Fig. 2).
Standing lateral-view plain radiographs were obtained with the neck in the neutral position, flexion, and extension preoperatively. Neutral-position lateral radiographs were obtained with the patient standing comfortably, with the head facing forward, and gazing in the horizontal direction. Cervical alignment was determined on preoperative neutral radiographs using a classification proposed by Chiba et al. [9] and analyzed as (1) lordosis, (2) straight, (3) sigmoid, and (4) kyphosis. In this study, the C2–C7 angle was measured as the Cobb angle between the C2 and C7 vertebral bodies. A positive value in the C2–C7 angle indicates lordosis. The range of motion was calculated as the difference between the C2–C7 angle during flexion and extension. The angles associated with the C2–C5 and C5–C7 angles were measured in the same way as those for C2–C7. The C2–C7 sagittal vertical axis was defined as the distance between the C2 plumb line and the superior posterior corner of the C7 vertebral body. The T1 slope was determined as the angle between the superior endplate of T1 and the horizontal line.
The intraobserver reliability tested by the interclass correlation coefficient (ICC) (1, 1) was 0.917 (0.859–0.952). The interobserver reliability tested by the ICC (2, 1) was 0.916 (0.833–0.959).
6. Statistical analysis
Statistical analysis was performed using IBM SPSS ver. 25.0 (IBM Corp., Armonk, NY, USA). All values were expressed as the mean±standard deviation, and p<0.05 was considered significant. All independent variables between the two groups were compared using the t-test for continuous variables and the Mann-Whitney U test for discrete variables. A chi-square test was performed to compare the development of new stenosis. Logistic regression analysis was used for risk factor analysis of new stenosis. Initially, univariate analysis was used to determine the significance of various parameters with p<0.10 in comparisons between the two groups. Factors with p<0.10 in the univariate analysis were then included in the multivariate analysis. Receiver operating characteristic (ROC) curve analysis was performed to investigate the threshold for new stenosis using parameters detected as risk factors in the multivariate logistic regression analysis. The Youden index was used to determine the cutoff value for each parameter.
Results
1. Overview of new stenosis development in the extended position
The number of patients and the location of stenosis at various intervertebral segments in a neutral position were investigated (Table 1). Four-level stenosis between C3/C4 and C6/C7 was the most common pattern, affecting 32 patients (91% of all four-level cases). The next most frequent was a two-level stenosis between C4/C5 and C5/C6 (n=29, 64% of all two-level cases). C5/C6 was the most common among single-level cases (n=14, 70% of single-level cases). For three-level cases, stenosis from C3/C4 to C5/C6 was the most frequent (n=18, 53% of three-level cases).
In the extended position, new stenosis developed most frequently at the upper level in C4/C5–C5/C6 and C4/C5–C6/C7 patterns in the neutral position, affecting six patients each. For the C4/C5–C5/C6 two-level cases, new stenosis developed in the extended position in 21% of the patients, whereas 43% of the patients with C4/C5–C6/C7 three-level stenosis experienced new stenosis in the extended position.
The highest number of new stenosis at the lower level in the extended position was 10, accounting for 56% of patients with C3/C4–C5/C6 three-level stenosis in the neutral position. The second most common was the C4/C5–C5/C6 two-level pattern (n=9, 31%).
3. Comparison divided by the level of the intervertebral disc segment adjacent to the stenosis segment in the neutral position
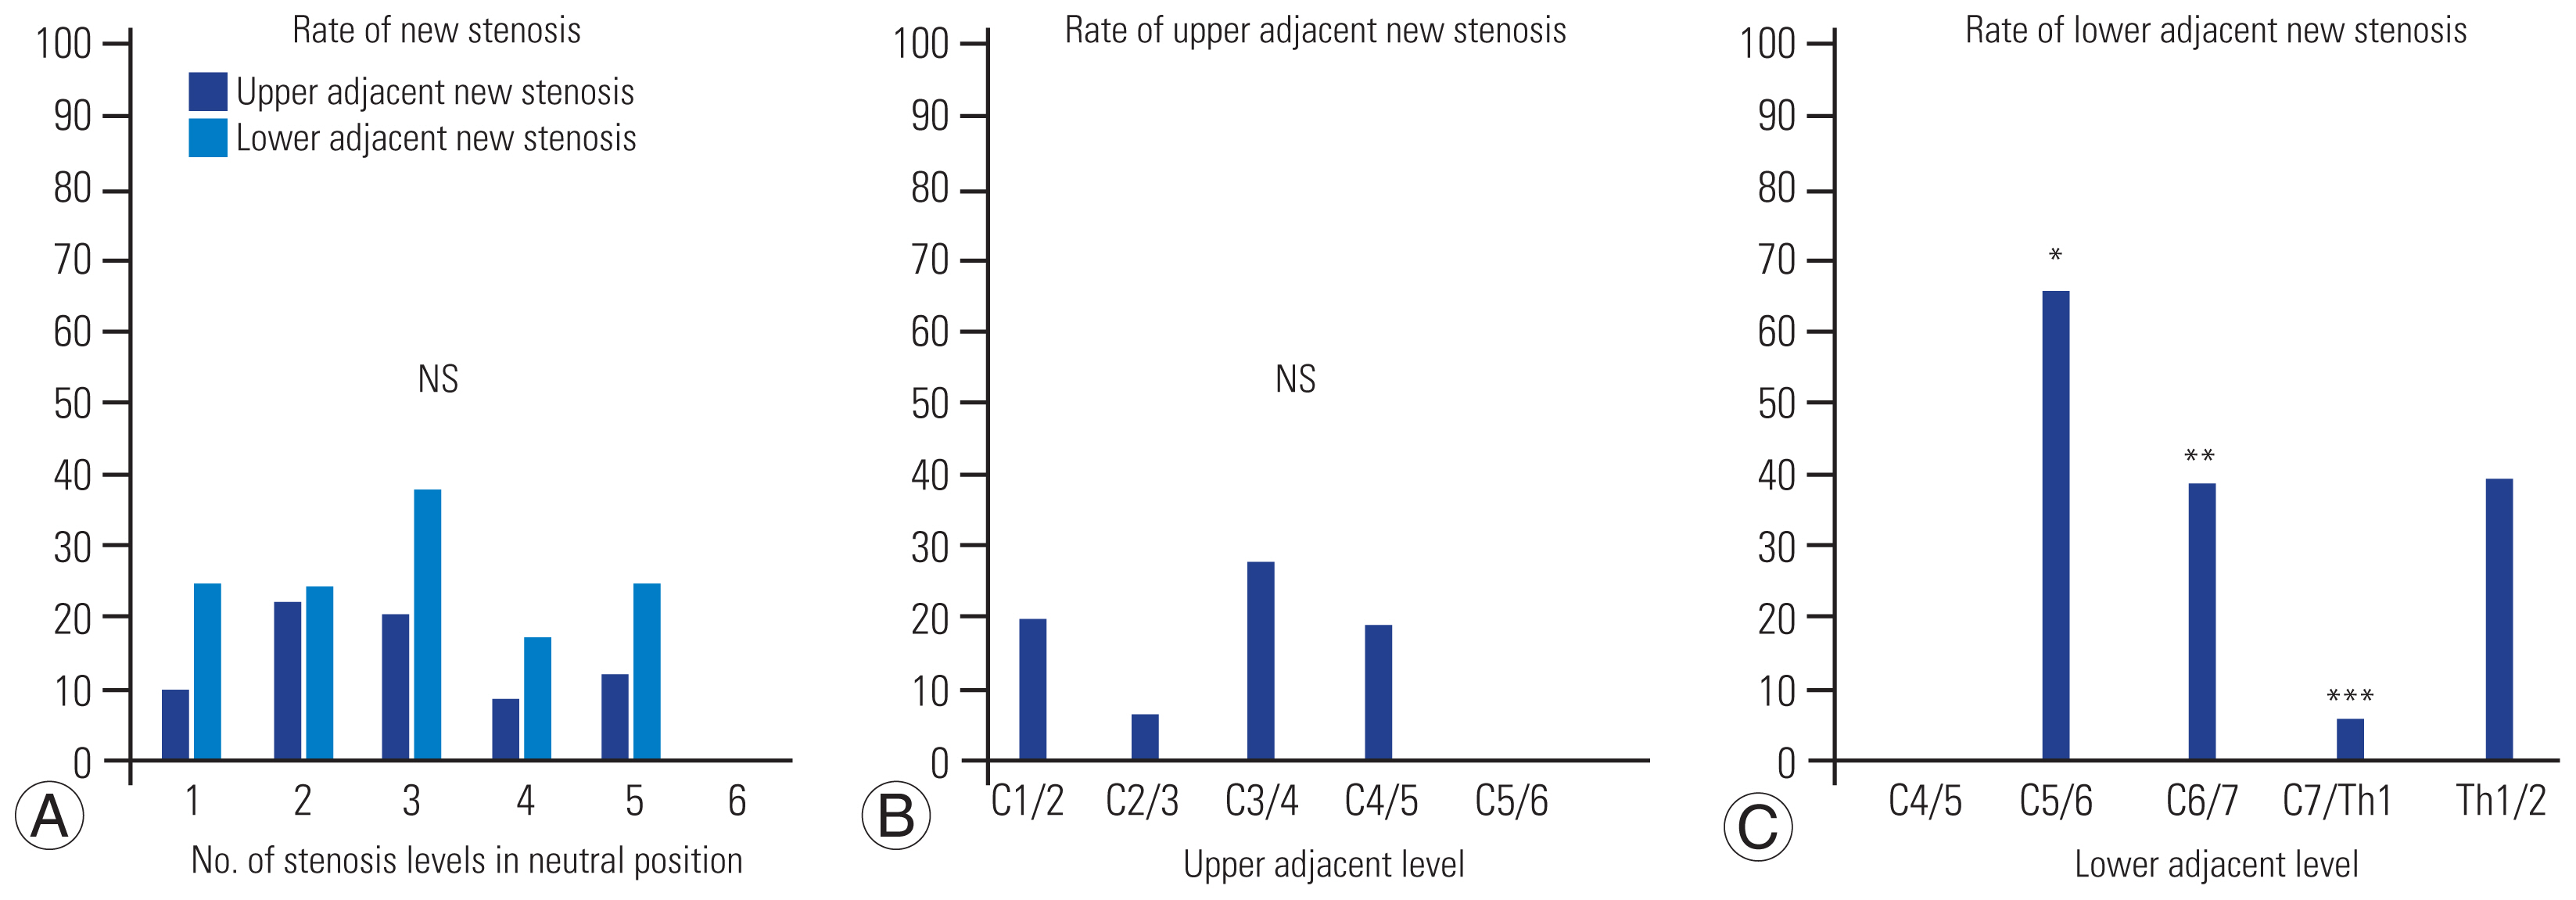
The incidence rate of new stenosis at the upper adjacent level in the extended position was the highest (28%) when C3/C4 was at the upper adjacent level. However, no significant difference was found when compared with other locations (Table 3, Fig. 3).
Similarly, the incidence of new stenosis at the lower level in the extended position was the highest (67%) when C5/C6 was at the lower adjacent level; however, no significant difference was noted when compared with other locations (p<0.10). When C6/C7 was at the lower adjacent level, the incidence of new stenosis was 39%, which was significantly higher. Conversely, the incidence when C7/T1 was at the lower adjacent level was 6%, which was significantly lower.
4. Evaluation of cases of new stenosis development in the upper adjacent disc level in the extended position
The U (+) group developed new stenosis in the upper adjacent intervertebral disc level in the extended position, whereas the U (−) group did not. Statistically significant differences were observed in the AP of the dura and SAC. The U (+) group had lower AP of the dura and SAC (Table 4).
5. Evaluation of cases of new stenosis development in the lower adjacent disc level in the extended position
The L (+) group developed new stenosis in the extended position of the lower adjacent intervertebral disc level, whereas the L (−) group did not. Statistically significant differences were observed in the following parameters: level of the lower adjacent intervertebral disc segment, AP of the dura, AP of the SC, and SAC. The L (+) group had higher cephalad adjacent intervertebral disc levels. The L (+) group had lower AP of the dura, AP of the SC, and SAC (Table 4).
6. Risk factor analysis of new stenosis development in the extended position
In the analysis of risk factors for new stenosis developing in the extended position, univariate analysis was performed on factors with a p-value of <0.10 in the U and L group analyses. Multivariate analysis was then conducted on factors with a p-value of <0.10 in the univariate analysis (Table 5).
In the univariate analysis for new stenosis in the upper adjacent intervertebral disc level, the AP of the dura and SAC were significant risk factors. In the multivariate analysis, only SAC was a significant risk factor. A 1-mm decrease in SAC resulted in an 8.9-fold increased risk of new stenosis development in the upper adjacent disc level (Table 5).
The adjacent disc level, AP of the dura, AP of the SC, and SAC were significant risk factors. In the multivariate analysis, AP of the dura and SAC were significant risk factors in the univariate analysis for new stenosis developing in the lower adjacent intervertebral disc level. A 1-mm decrease in the AP of the dura resulted in a 2.5-fold increased risk of new stenosis development in the lower adjacent disc level, whereas a 1-mm decrease in the SAC resulted in a 2.7-fold increased risk at the same location (Table 5).
7. Evaluation of magnetic resonance imaging measurement errors
The difference between the two measurements of the AP of the SC and AP of the dura by the same examiner was −0.07350±0.49112 mm. The 95% confidence interval for the difference in measurements was −0.30335 to 0.15635 mm.
8. Analysis of space available for the spinal cord cutoff values
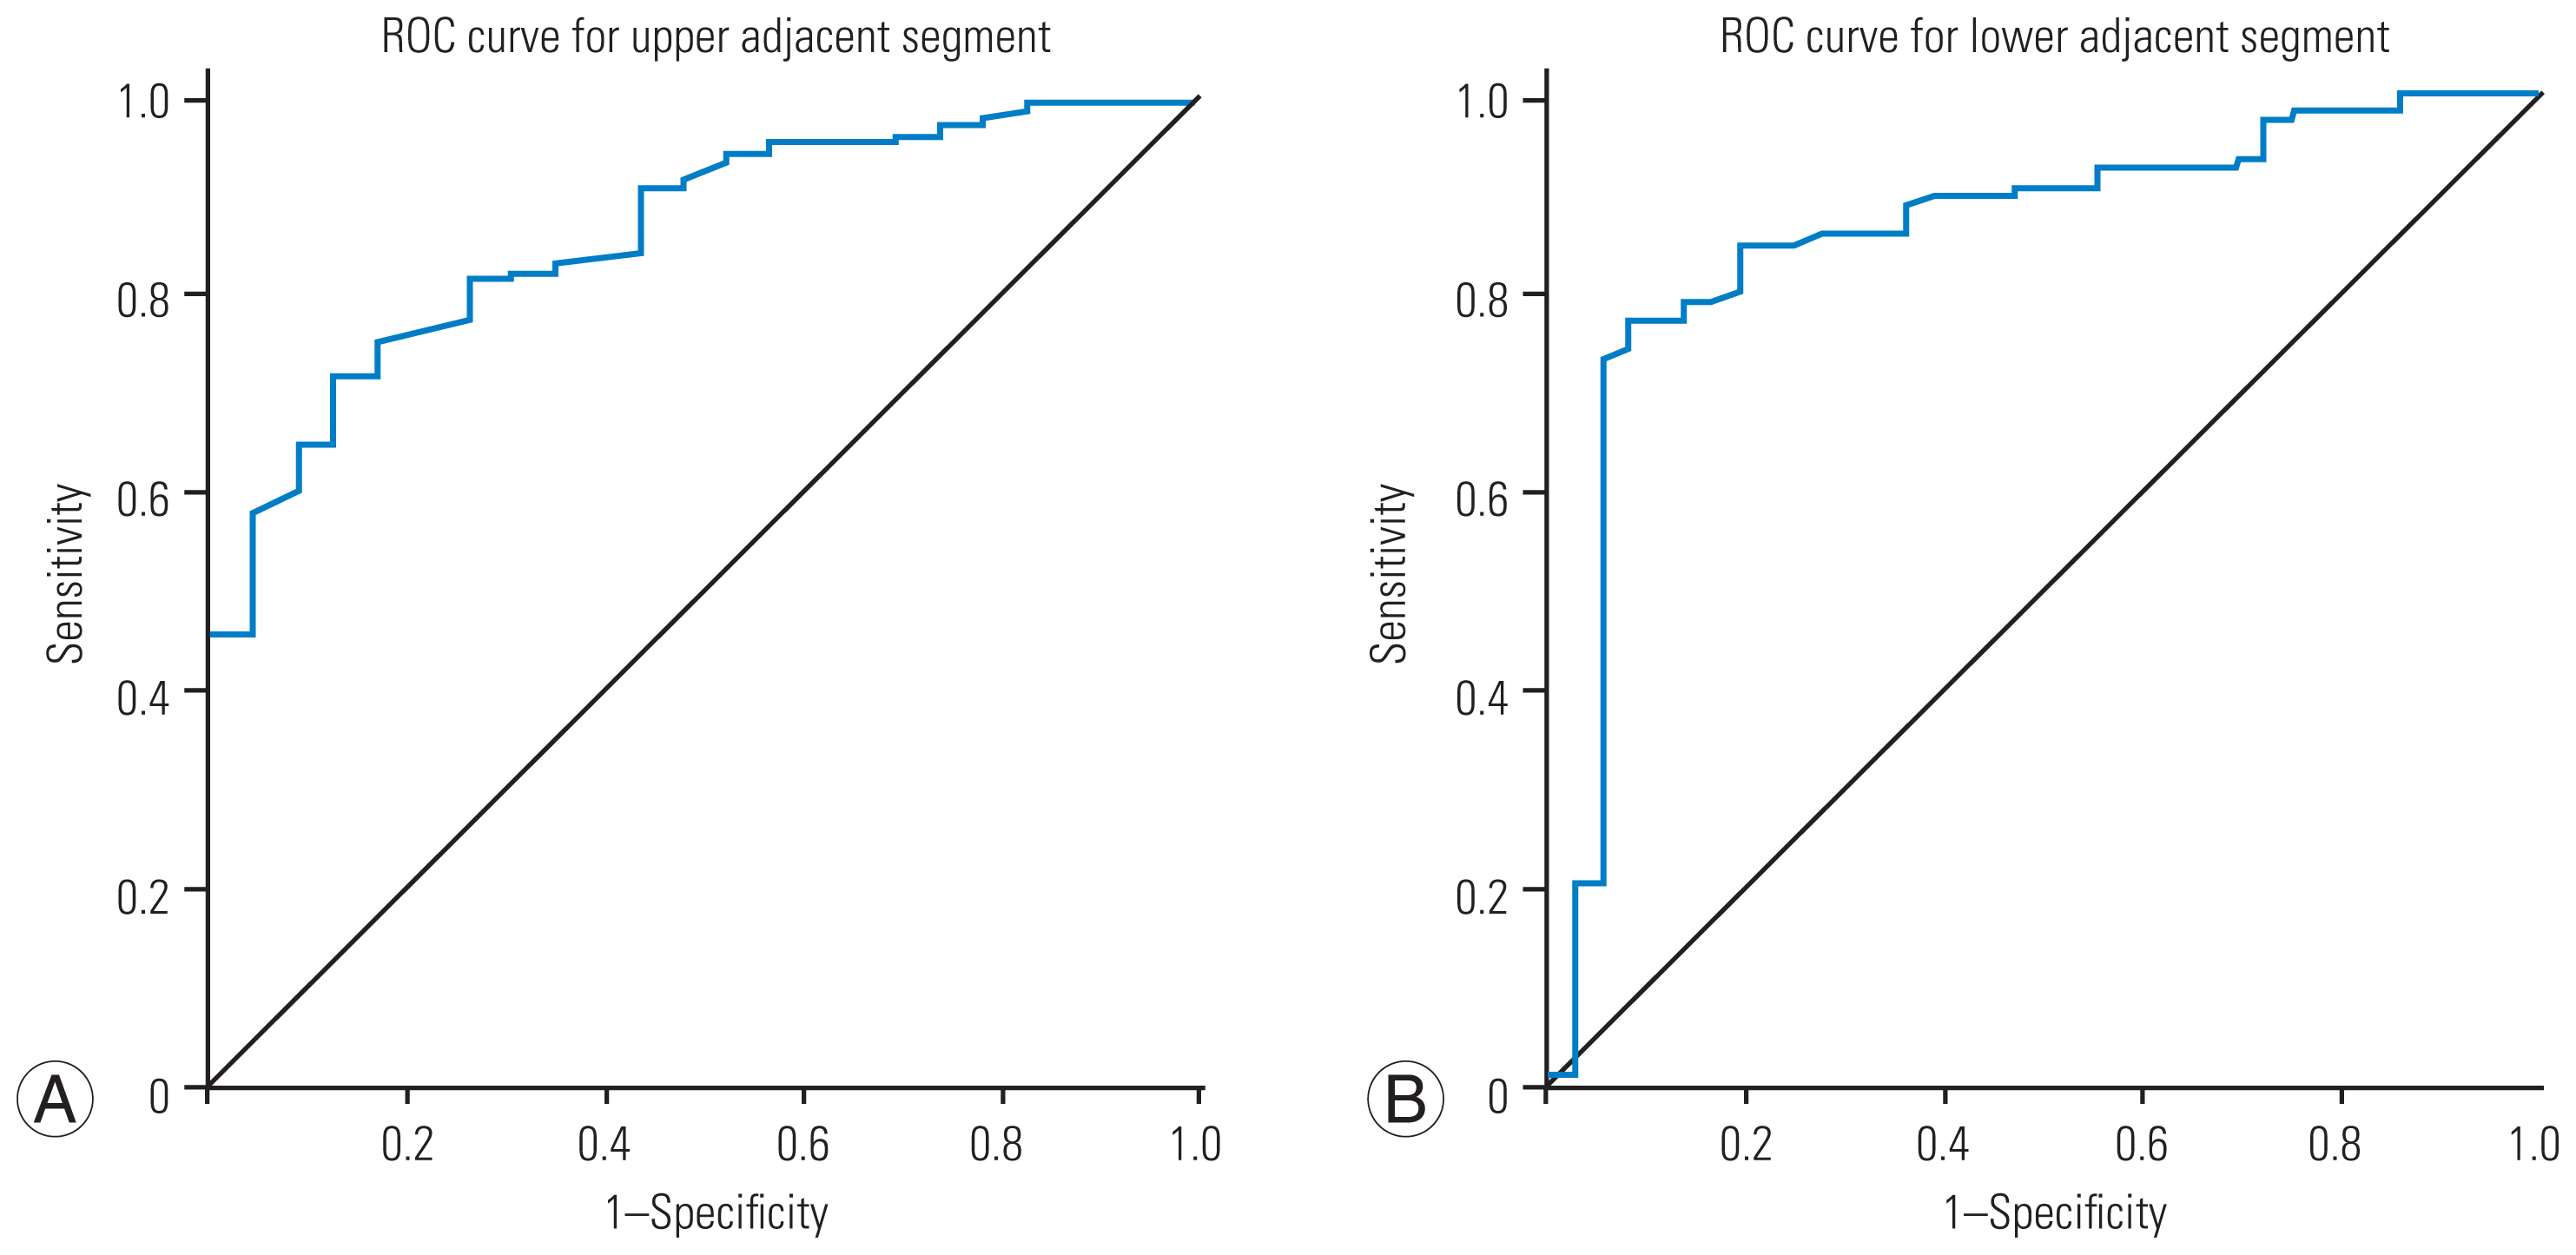
Considering the ROC curves, the cutoff value of the SAC for new stenosis development in the upper adjacent intervertebral disc level was 0.8450 mm (area under the curve [AUC], 0.859; sensitivity, 0.992; specificity, 1.000). A SAC of 1.1250 mm had the sensitivity and specificity of 0.992 and 0.957, respectively. Clinically, a SAC of 1.0 mm is practical (Fig. 4).
The cutoff value of the SAC for new stenosis development in the lower adjacent intervertebral disc level was 0.9550 mm (AUC, 0.858; sensitivity, 1.000; specificity, 0.972). A SAC of 1.210 mm had the sensitivity and specificity of 1.000 and 0.944, respectively. A SAC of 1.0 mm appeared to be practical (Fig. 4).
Discussion
Numerous studies have investigated dynamic compression factors in the cervical spine and have suggested that this dynamic compression contributes to the development of cervical spondylotic myelopathy [1–8]. This study aimed to predict new stenosis development in cervical extension based on the images of the cervical spine in a neutral position. While two studies have examined factors causing stenosis in flexion and extension based on images of the cervical spine in a neutral position [6,7], neither considered the SC status. Note that the SC size does not proportionally correspond to the spinal canal size, and the disproportion between the SC and the canal is thought to contribute to canal stenosis [10]. No previous reports have considered SC status as a factor in the development of new stenosis, which appears insufficient when evaluating factors in cervical canal stenosis. To our knowledge, this is the first to include SC status when considering the AP diameter of the SC.
A key finding from our study is that new stenosis in the cervical spine frequently appeared caudal to the site of stenosis in a neutral position. This finding is crucial because a study reported that new stenosis following decompression surgery for cervical spondylotic myelopathy often occurs caudally [11]. Our study results also demonstrated that the cervical spine is more susceptible to dynamic compression on the caudal side. C5/C6 and C6/C7 were identified as the most common sites of new stenosis, possibly related to the fact that C5/C6 and C6/C7 are frequently involved in the stenosis sites of cervical spondylotic myelopathy [12]. Similarly, adjacent segment diseases are more likely to occur when C5/C6 and C6/C7 are adjacent intervertebral levels following anterior cervical fusion surgery [13], suggesting that this area is inherently prone to dynamic compression and stenosis.
In the cervical spine, extension movement is pronounced in the lower cervical segments, such as C5–C7 [14]. This increased motion can lead to the development of new stenosis when the cervical spine is in an extended position. The greater mobility of the lower cervical vertebrae may make this region more prone to developing spinal stenosis, which can cause pain and neurological symptoms.
New stenosis development in the extended cervical position was not associated with the number of stenotic segments in the neutral position or with any of the alignment parameters examined. Multivariate logistic regression analysis revealed that the significant factor in new stenosis was the narrowing of the SAC. Previous reports have identified narrowing of the AP diameter of the dural canal, bulging disc, disc mobility in flexion and extension, and local kyphosis as risk factors for new stenosis development [6–8]. When taken together, our results suggest that the development of new stenosis is less related to factors of the cervical spine as a whole and emerges primarily from local factors.
Although the narrowing of the SAC remained as a significant risk factor for new stenosis in this study, setting a clinically straightforward cutoff value at 1 mm appears reasonable. This is because a 1-mm difference in the SAC can be considered significant in this study when taking into account the error in MRI measurements, and the sensitivity and specificity in the ROC curve at cutoff values of approximately 1 mm were nearly the same.
Because a site with only 1 mm of SAC is prone to be stenotic in extension, treating it as a stenosis site is safer. To avoid insufficient postoperative decompression, decompression should be considered for stenotic levels and narrowing canal levels with only 1 mm of SAC on neutral MRI.
This study has several limitations. First, the exclusive focus on Japanese subjects may limit generalizability. Second, the small sample size potentially reduces rigor and statistical power. Third, given the retrospective design, we could not provide data on the SC in the flexed position, which is a serious limitation. Assessing the cervical spine in flexed positions is essential to provide additional insights into its biomechanics and pathophysiology. The omission of intervertebral disc angles and slippage evaluation may affect the understanding of cervical spine characteristics. Thus, future studies should include imaging in larger, more diverse cohorts, including complete cervical spine dynamics, in the flexed position, and comprehensive local measurements.
Conclusions
This study identifies the narrowing of the SAC as the primary risk factor for developing new stenosis in extension, with a clinically relevant cutoff value established at 1 mm. It underscores the significance of local factors in developing stenosis and advocates for further research to enhance patient outcomes in managing cervical spine disorders.