

Introduction
Low back pain is a common clinical problem and is of major socioeconomic importance. However, at the current time, there is little information regarding the pathogenesis of this disease. Any of the spinal structures (intervertebral discs, facet joints, vertebral bodies, ligaments or muscles) may be a source of low back pain [1,2,3].
The treatment for patients with chronic low back pain and its evolving disability primarily attempts to improve the patients' levels of activities and participation. Mostly, self-reported questionnaires have been used to assess daily functioning for clinical and research purposes. For example, the Oswestry Disability Questionnaire (ODQ) has been one of the most commonly used disease-specific measures for patients with low back pain [4]. The Oswestry disability index (ODI) is calculated from the score for each of the ten ODQ items. The Roland-Morris Disability Questionnaire (RDQ) was designed for the use in primary care research, to assess physical disability because of low back pain [5]. It has been extensively used in different clinical practice settings (primary care, occupational health and multidisciplinary rehabilitation centers), to monitor the progress in patients with acute, sub-acute, and chronic low back pain and in patients with sciatica [6]. RDQ scores are dependent on self-reported questionnaires.
The scores of these pain assessment questionnaires are based on the subjective reporting by patients. A newly developed device, PainVision PS-2100 (Nipro, Osaka, Japan), has been used to quantitatively determine pain intensity as the "degree of pain" calculated from the current production of electrical threshold perception and the current production of a comparable pain sensation [7,8]. To our knowledge, there has been no previous report on the use of PainVision to assess low back pain. In the current study, we aimed to evaluate the efficacy of PainVision for the assessment of low back pain.
Materials and Methods
The procedures in this study were approved by the ethics committee of our institution and an written informed consent was obtained from each subject.
1. Patients
In this study, the low back pain in 89 patients was assessed, continuing for at least 3 months and with or without accompanying radicular pain. The Investigation by X-ray film and magnetic resonance imaging revealed lumbar spondylosis, lumbar disc herniation and lumbar spinal stenosis as likely causes of low back pain in the study subjects. Patients were excluded from this study if they had previously undergone a spinal surgery or had infections, tumors or a trauma. Also patients with planned surgery were excluded.
2. Pain score
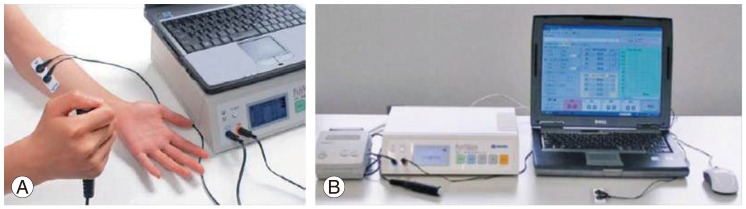
Only the low back pain was evaluated in the current study, we didn't evaluate the radicular leg pain. In each patient was the numeric rating scale (NRS) (with 0 being no pain and 1 the worst pain), the McGill Pain Questionnaire (MPQ) [9] (0-45; where 45 is worst) scores and the degree of pain calculated by the PainVision apparatus were measured twice at 4 week intervals in each patient. The electrode of the PainVision apparatus was patched onto the surface of the forearm of patients, and both, the current at the threshold of perception and current producing pain compatible with their low back pain (i.e., the current producing pain of the same intensity as the low back pain reported by the patient) were measured. The current was pulsed for 0.3 ms at 50 Hz and 0-120 µA. The degree of pain was automatically calculated (degree of pain=100×[current producing pain comparable with low back pain-current at perception threshold/current at perception threshold]) (Fig. 1). The correlations between the degree of pain, NRS and MPQ scores and score changes over 4 weeks were evaluated using Spearman's rank correlation test.
Results
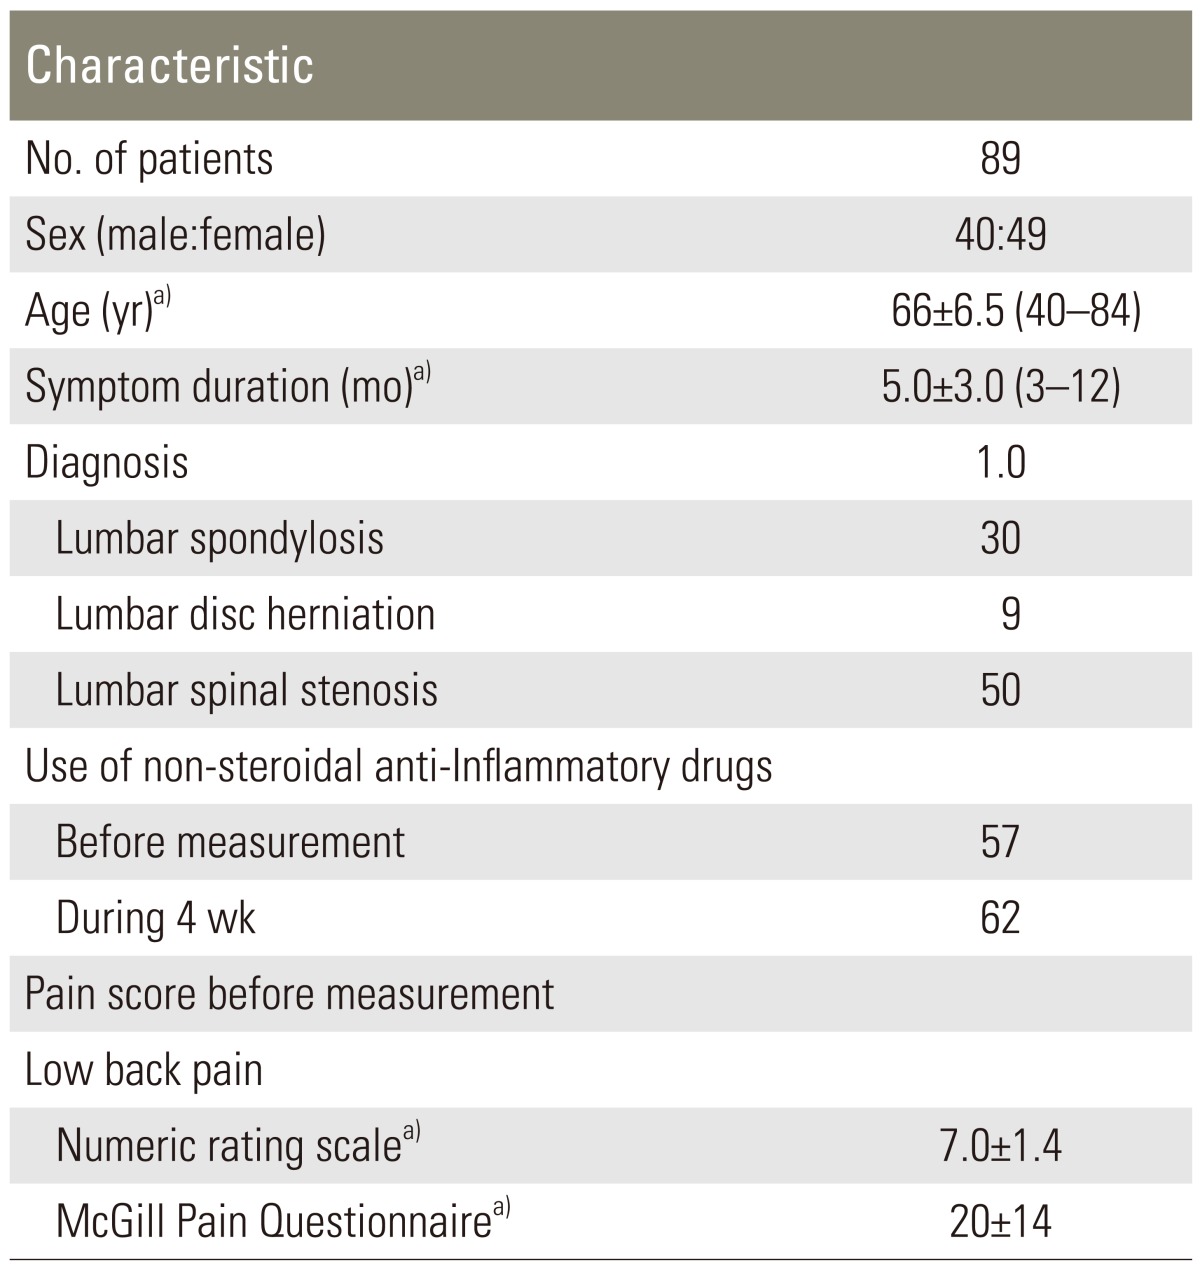
Table 1 shows the demographic characteristics of the 89 patients.
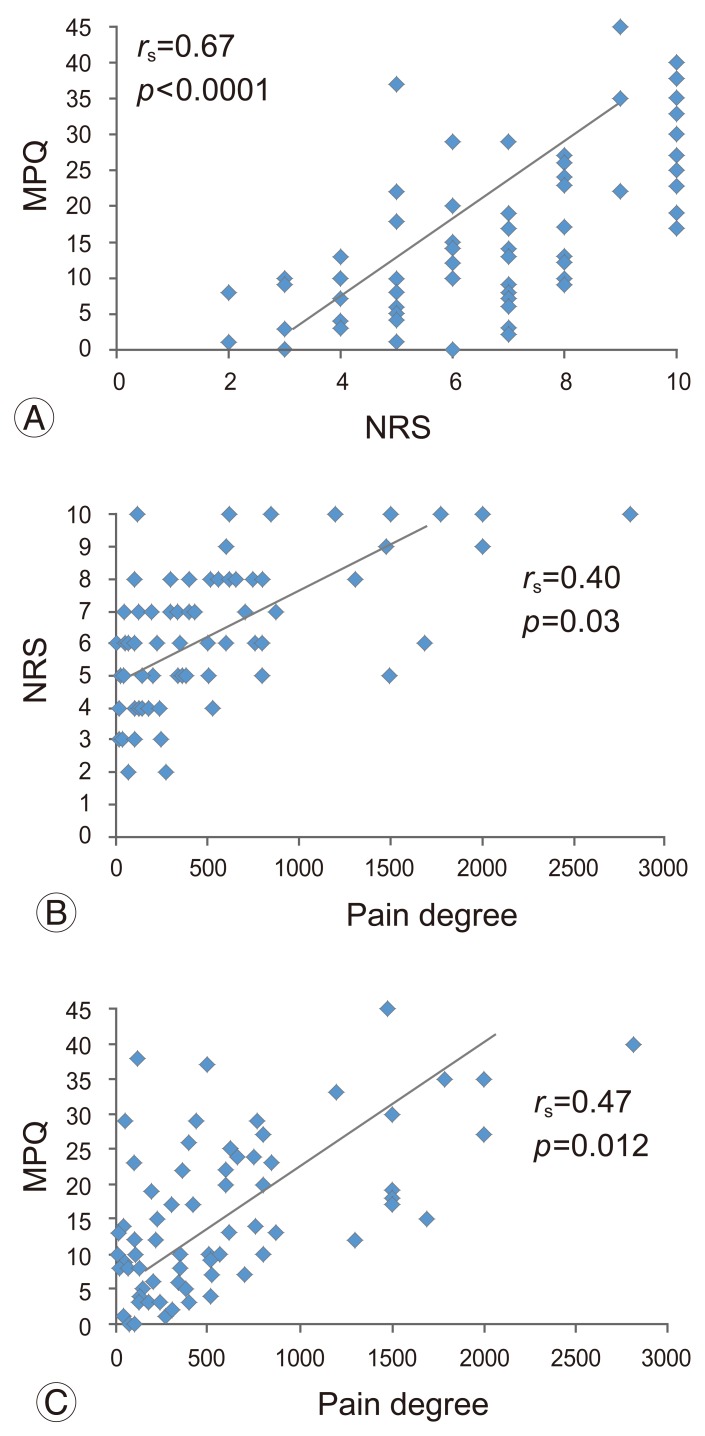
Fig. 2 shows the initial correlation between the NRS and MPQ scores and the degree of pain. There was a strong correlation between NRS and MPQ scores (rs=0.67, p<0.0001). The degree of pain showed moderate correlations with NRS score (rs=0.40, p=0.03) and MPQ score (rs=0.47, p=0.012).
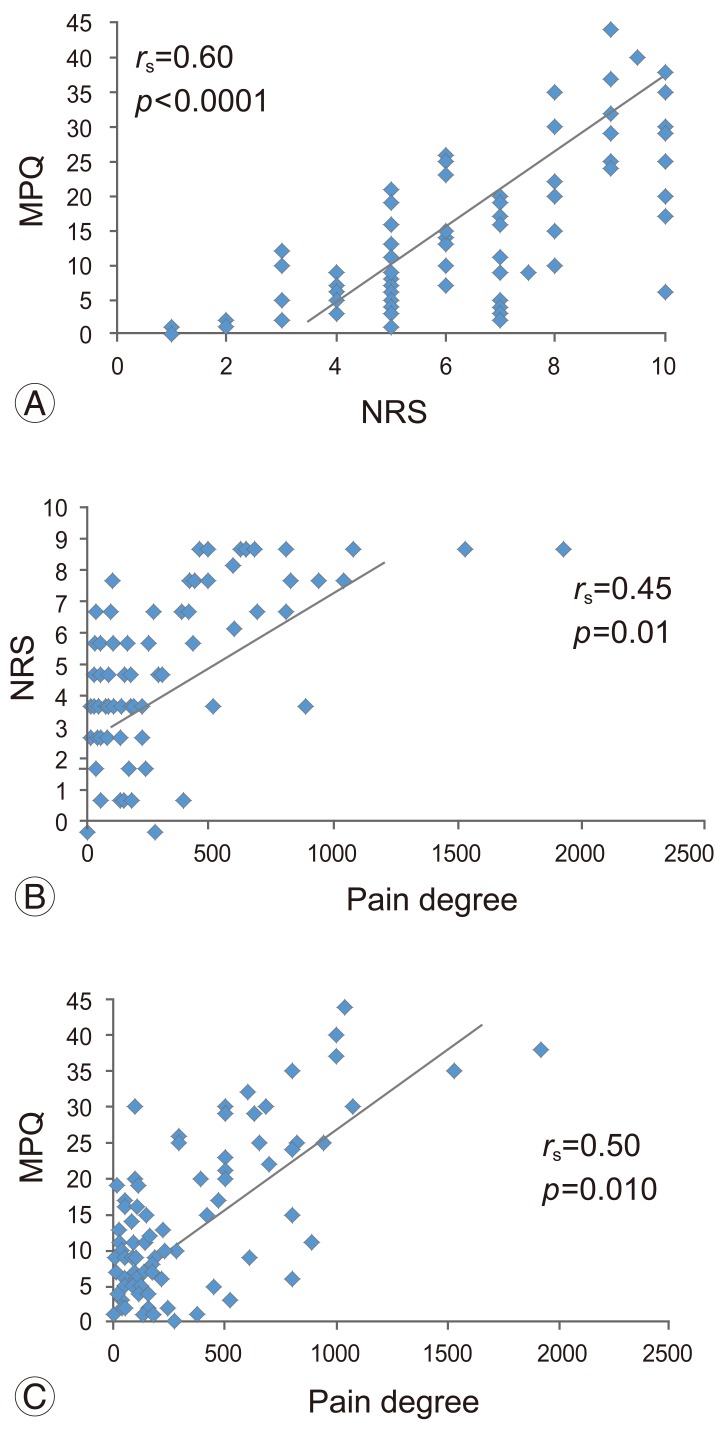
Fig. 3 shows the correlation between NRS and MPQ scores and the degree of pain 4 weeks after the initial measurement. There was a strong correlation between NRS and MPQ scores (rs=0.60, p<0.0001). The degree of pain showed moderate correlations with NRS score (rs=0.45, p=0.01) and MPQ score (rs=0.50, p=0.010).
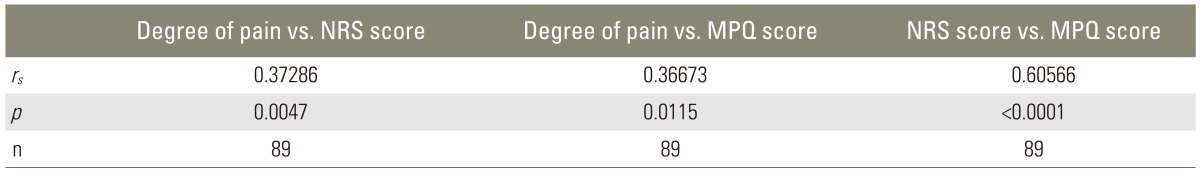
Table 2 shows that the change in NRS score during 4 weeks has a strong correlation with the change in MPQ score (rs=0.60, p<0.0001). Changes in the degree of pain during 4 weeks showed moderate correlations with the changes in NRS score (rs=0.37, p=0.0047) and MPQ score (rs=0.37, p=0.01).
Discussion
In the current study, there was a statistically significant correlation between the degree of pain that was calculated by PainVision and the NRS and MPQ scores at each measurement. In this regard, it is useful to calculate the pain degree by PainVision for the evaluation of low back pain.
Several ways of function measurements have been reported in patients with low back pain including the Low Back Pain Rating Scale, ODI, Progressive Isoinertial Lifting Evaluation, Quebec Back Pain Disability Scale and the RDQ [10]. All measurements are based on self-reported questionnaires [10].
A neurometer may be used to objectively evaluate nerve function and pain in several diseases. Neurometers allow the selective stimulation of nerve fibers with different thicknesses, based on the concept that nerve fibers with different thicknesses have different depolarization times that depend on the frequency of their sinusoid electrical stimulation [11]. Because quantitative electrophysiological diagnosis offers a means by which the function of selective nerve fibers should be evaluated, neurometers have been used as auxiliary diagnostic tools for the assessment of allodynia, dysesthesia and malingering [12]. Several authors have reported that a neurometer is very useful in the assessment of lower-extremity sensory functions and pain before and after surgery of lumbar disc herniation [13,14].
A newly developed device, PainVision PS-2100, has recently been used for the quantitative analysis of pain perception and sensation, measuring pain intensity as "degree of pain" [7,8].
The PainVision apparatus can stimulate Ab and Adfibers and the degree of pain is calculated from two variables, the current perception threshold and current producing comparable pain as measured by this device. The current perception threshold variable is defined as the lowest electrical current detected by the patient and the current producing comparable pain is defined as the electrical current judged by the patient as being comparable with the intensity of their ongoing pain [7,8]. A neurometer can only evaluate current perception thresholds; however, PainVision can evaluate the degree of pain automatically by the stimulation of Aβ and Aδ fibers.
In this study, the low back pain was objectively measured and the degree of low back pain correlated with the subjective NRS and MPQ scores at 2 time points. Furthermore, change in the degree of pain over 4 weeks showed a moderate correlation with the changes in NRS and MPQ scores. Therefore, we concluded that PainVision is as tool as useful as self-reported questionnaires for the assessment of low back pain.
This study has several limitations. First, we examined only a small number of patients. A larger number of patients need to be evaluated to strengthen the findings of the current study. Second, we did not compare the degree of pain with scores of other evaluation methods such as the ODI and RDQ score. Finally, the patients had low back pain; however, the electrodes of the apparatus were located on the forearm and not on the low back. The electrodes were located on the forearm because there were fewer skin hairs and sweat glands, the surface of the forearm is flat and no muscle contraction was effected by the stimulation. Furthermore, it has been reported that reproducibility and reliability of pain degree obtained from the forearm are significantly superior to those from foot and leg. So, the degree of pain was obtained from the forearm [15].
Conclusions
In summary, we evaluated the low back pain in 89 subjects. NRS, MPQ scores and degree of pain computed using PainVision were measured twice at 4-week intervals in each patient and statistically significant correlations were found between the 3 types of measurements. We conclude that PainVision is a useful tool for the assessment of low back pain.